. 2017 Feb 10:8:14399.
doi: 10.1038/ncomms14399.

Cancer cell-secreted IGF2 instigates fibroblasts and bone marrow-derived vascular progenitor cells to promote cancer progression

Affiliations

Cancer cell-secreted IGF2 instigates fibroblasts and bone marrow-derived vascular progenitor cells to promote cancer progression

Wen Wen Xu et al. Nat Commun. .

Abstract

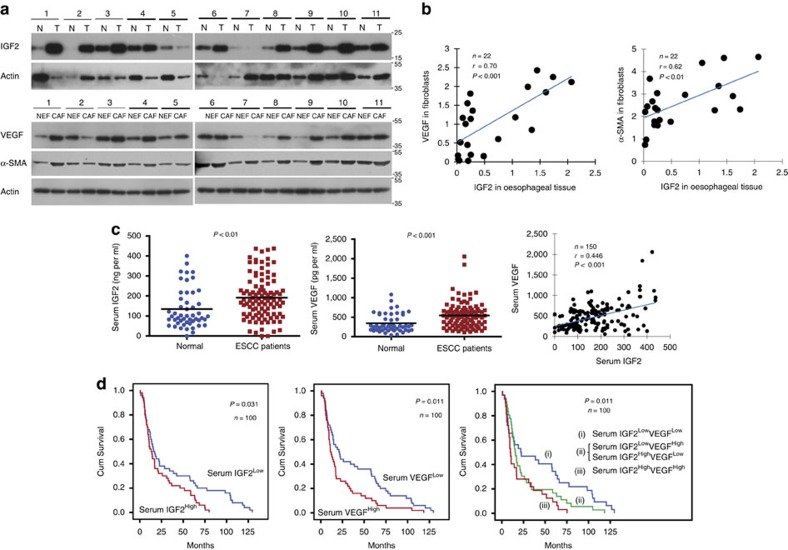
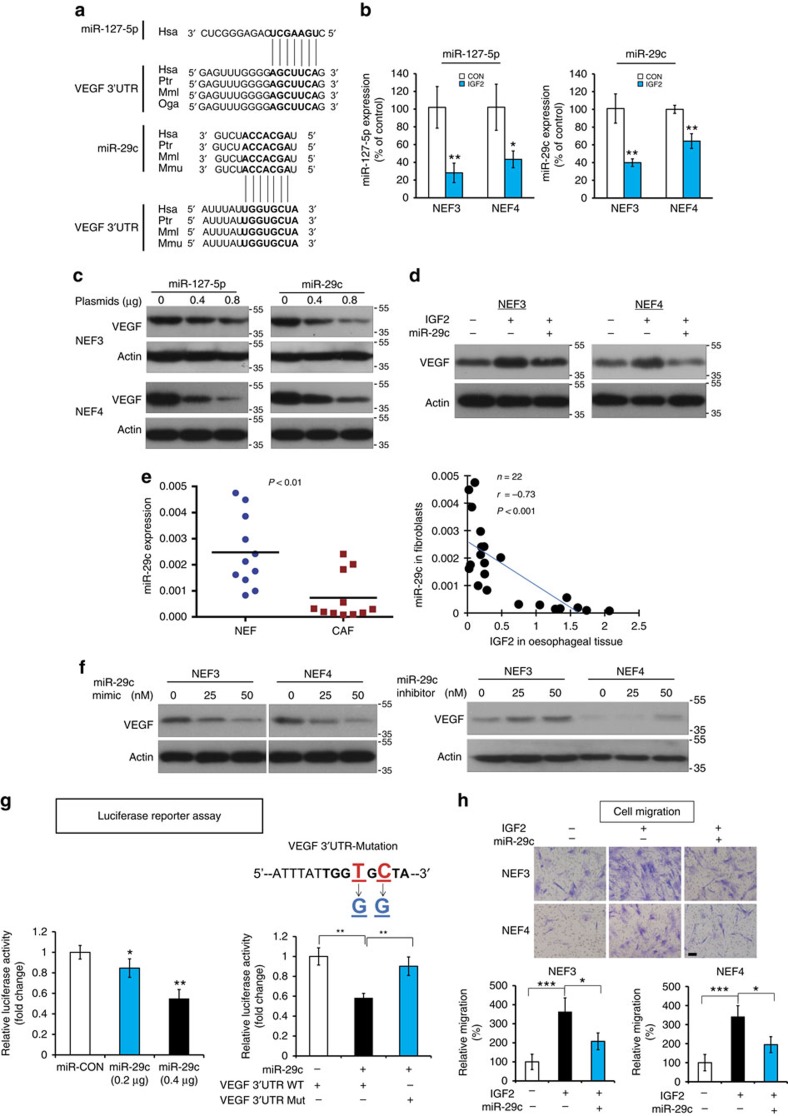
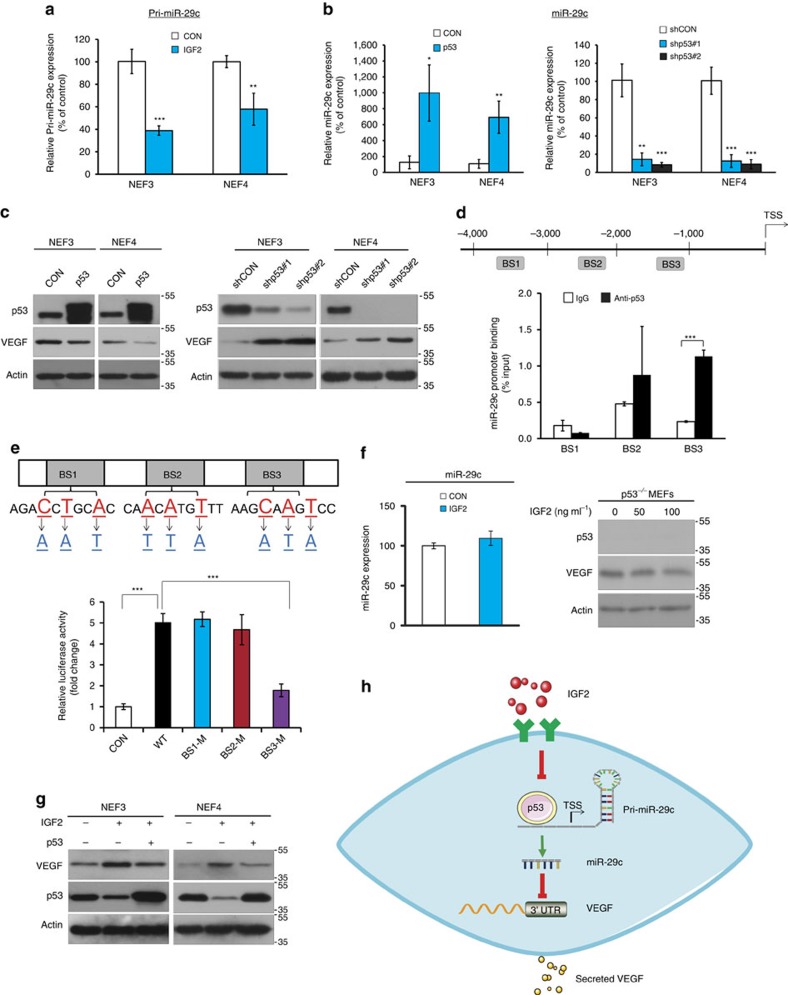
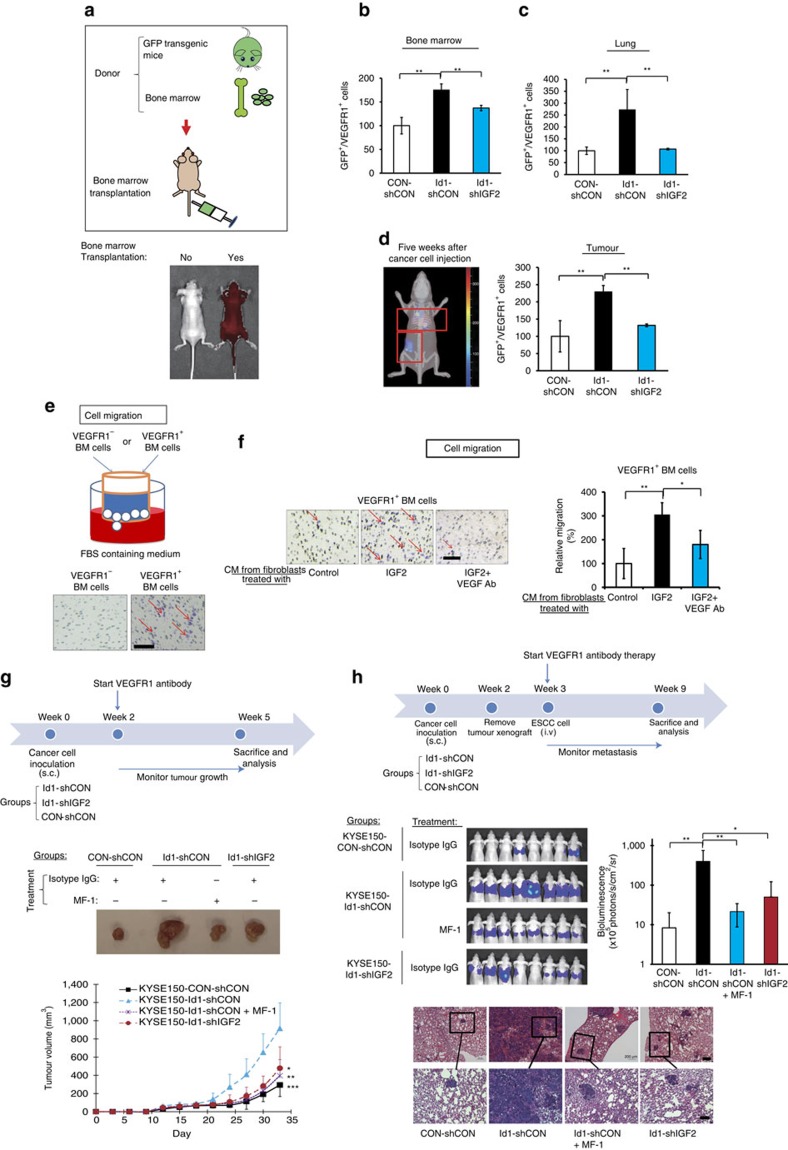
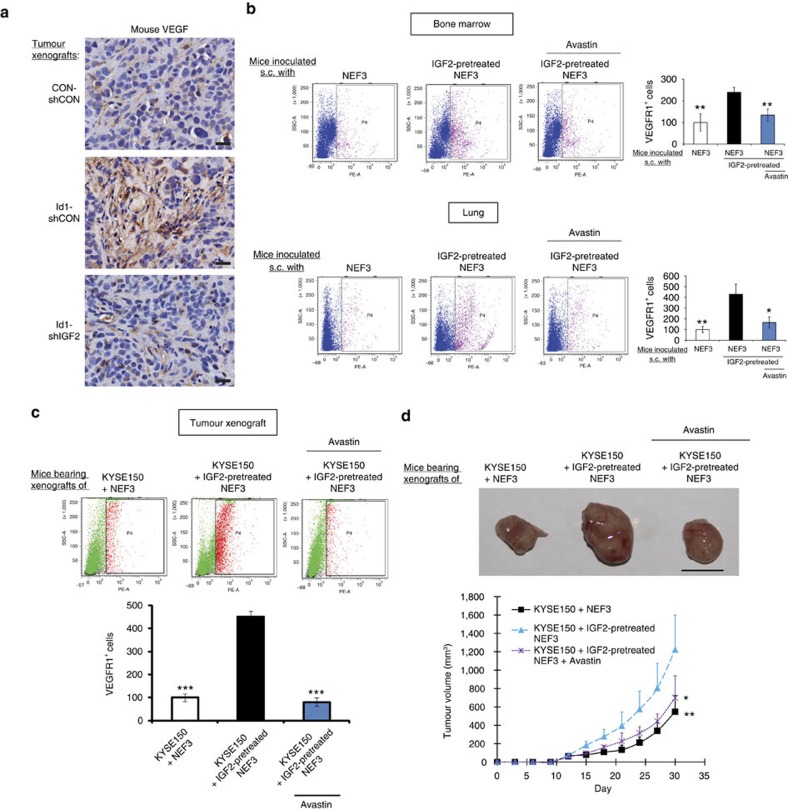
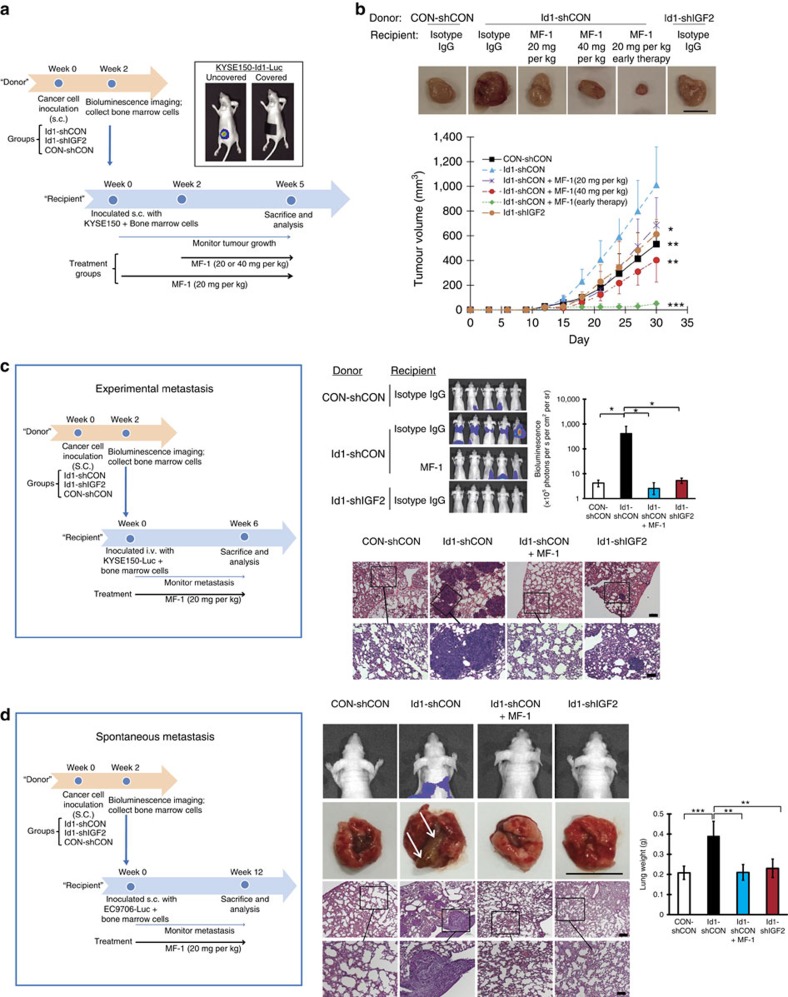
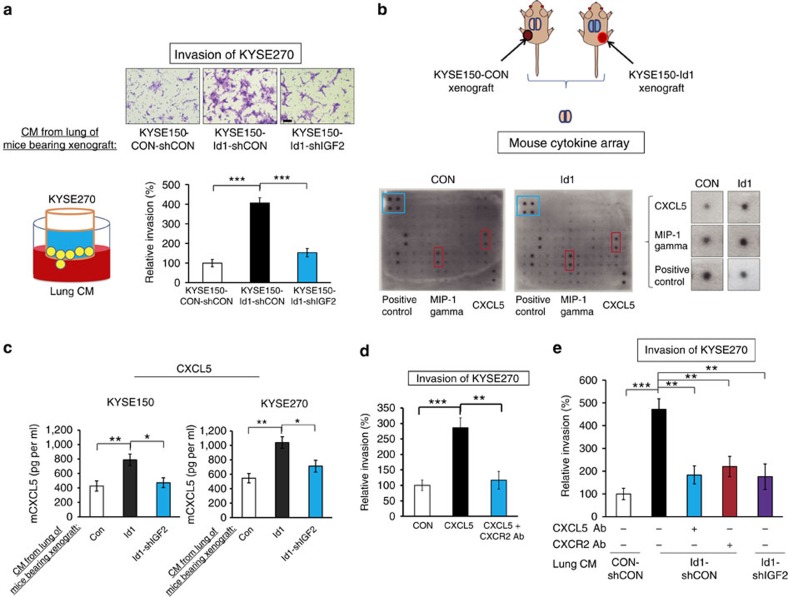
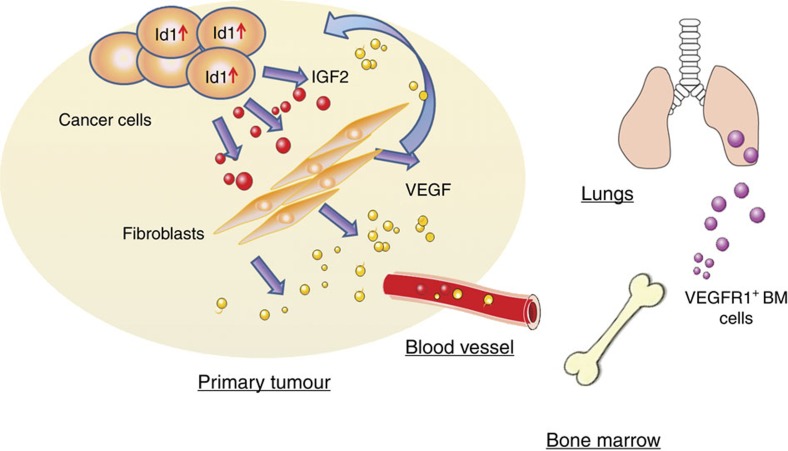
Local interactions between cancer cells and stroma can produce systemic effects on distant organs to govern cancer progression. Here we show that IGF2 secreted by inhibitor of differentiation (Id1)-overexpressing oesophageal cancer cells instigates VEGFR1-positive bone marrow cells in the tumour macroenvironment to form pre-metastatic niches at distant sites by increasing VEGF secretion from cancer-associated fibroblasts. Cancer cells are then attracted to the metastatic site via the CXCL5/CXCR2 axis. Bone marrow cells transplanted from nude mice bearing Id1-overexpressing oesophageal tumours enhance tumour growth and metastasis in recipient mice, whereas systemic administration of VEGFR1 antibody abrogates these effects. Mechanistically, IGF2 regulates VEGF in fibroblasts via miR-29c in a p53-dependent manner. Analysis of patient serum samples showed that concurrent elevation of IGF2 and VEGF levels may serve as a prognostic biomarker for oesophageal cancer. These findings suggest that the Id1/IGF2/VEGF/VEGFR1 cascade plays a critical role in tumour-driven pathophysiological processes underlying cancer progression.


Conflict of interest statement

The authors declare no competing financial interests.

Figures

Figure 1
Figure 1. Id1-induced IGF2 activates fibroblasts in a paracrine manner.
(a) Tumour xenografts established from KYSE150-CON-shCON, KYSE150-Id1-shCON or KYSE150-Id1-shIGF2 ESCC cells were immunostained for CD31 and analysed for microvessel density (female 6–8-week-old nude mice, n=3 per group; scale bar, 100 μm). (b) Human VEGF (left panel) and mouse VEGF (right panel) concentration in serum of mice bearing Id1-overexpressing, Id1-shIGF2 or control tumours (female 6–8-week-old nude mice, n=6 per group) was analysed using ELISA. (c,d) Expression of VEGF and α-SMA (c) and secretion of VEGF (d) in fibroblasts fed with conditioned medium (CM) from KYSE150-CON-shCON, KYSE150-Id1-shCON or KYSE150-Id1-shIGF2 cells were assayed using western blot and ELISA, respectively. (e,f) Expression of VEGF and α-SMA (e) and secretion of VEGF (f) in fibroblasts treated with recombinant human IGF2. (g,h) Chemotactic migration of fibroblasts in response to conditioned medium (scale bar, 100 μm) from indicated ESCC cells (g) and exogenous IGF2 (h).Three biological replicates were performed for in vitro assays. Data in bar charts are presented as mean±s.d.; *P<0.05; **P<0.01; ***P<0.001 by Student's t-test.
Figure 2
Figure 2. Clinical relevance of tumour IGF2 and stromal VEGF axis.
(a) Western blot showing expression of IGF2 in ESCC (T) and matched non-tumour specimens (N), as well as expression of VEGF and α-SMA in CAFs and matched NEF from 11 ESCC patients. (b) Graphs showing positive correlation between IGF2 expression in oesophageal tissue and expressions of VEGF (left panel) and α-SMA (right panel) in fibroblasts, respectively, in 11 pairs of ESCC and adjacent normal tissues. Correlation was assessed using Pearson's rank correlation coefficient. (c) Comparison of serum IGF2 (left panel) and VEGF (middle panel) levels between healthy individuals (n=50) and ESCC patients (n=100); the data were pooled and a positive correlation was found between serum VEGF and IGF2 levels (n=150) (right panel) using unpaired t-test. (d) Gene expressions were further divided into high and low levels using median expression level as the cut-off point for survival analyses. Kaplan–Meier curves comparing survival outcome of ESCC patients (n=100) with high and low serum IGF2 levels (left panel), high and low serum VEGF levels (middle panel), and IGF2 High/VEGF High and IGF2 Low/VEGF Low levels (right panel); statistical significance was calculated by log-rank test.
Figure 3
Figure 3. miR-29c mediates the regulation of IGF2 on VEGF in fibroblasts.
(a) Base pairing between 3′UTR of VEGF and miR-127-5p and miR-29c, respectively. (b) Quantification of miR-127-5p and miR-29c expressions in IGF2-treated fibroblasts by TagMan miRNA assay. (c) Western blot analysis showing the expression of VEGF in the fibroblasts transfected with miR-127-5p and miR-29c plasmids, respectively. (d) VEGF expression was determined in the fibroblasts transfected with miR-29c or miR-CON in the presence or absence of IGF2. (e) Comparison of miR-29c expression level between CAFs and matched NEFs from 11 ESCC patients (left panel; paired t-test), and correlation with oesophageal tissue IGF2 expression (right panel; Pearson's rank correlation coefficient). (f) VEGF expression in the fibroblasts transfected with miR-29c mimic (left panel) or inhibitor (right panel). (g) Luciferase activity in fibroblasts co-transfected with miR-29c and wild-type or mutant VEGF 3'UTR luciferase reporter plasmids. (h) miR-29c abrogated the stimulatory effect of IGF2 on migration of fibroblasts (scale bar, 100 μm). Three biological replicates were performed for in vitro assays. Bars, s.d.; *P<0.05; **P<0.01; ***P<0.001 by Student's t-test.
Figure 4
Figure 4. p53-dependent regulation of miR-29c by IGF2.
(a) Quantification of pri-miR-29c level in IGF2-treated fibroblasts using TagMan pri-miRNA assay. Data were normalized to U6 expression. (b,c) Fibroblasts were transfected with p53 overexpression or knockdown plasmids, and then expression levels of miR-29c (b) and VEGF (c) were determined by TagMan miRNA assay and western blot, respectively. (d) Three putative p53 binding sites in the promoter of miR-29c were identified by in silico prediction, and the enrichment of p53 in miR-29c promoter region was determined by ChIP. (e) Diagram illustrating the site-specific mutations introduced in the reporter plasmid for miR-29c promoter (Pgl3-hsa-miR29c-pro-BS3-WT) (upper panel). Lower panel showed the luciferase activity in fibroblasts transfected with p53 and wild type (WT) or mutated (M) miR-29c promoter. (f) Tagman miRNA assay and western blot analysis showing the expression of miR-29c and VEGF in p53 null fibroblasts upon IGF2 treatment, respectively. (g) VEGF expression in fibroblasts transfected with p53 or vector control in the presence or absence of IGF2. (h) Schematic diagram illustrating how IGF2 can induce fibroblasts to secrete VEGF via the mediation of miR-29c in a p53-dependent manner. Three biological replicates were performed for in vitro assays. Bars, s.d.; *P<0.05; **P<0.01; ***P<0.001 by Student's t-test.
Figure 5
Figure 5. Systemic instigation of VEGFR1+ bone marrow cells by Id1-induced IGF2.
(a) Illustration within the box shows the experimental scheme for bone marrow transplantation; lower panel shows representative fluorescence images of recipient control mice without (labelled ‘No') and with bone marrow transplantation (labelled ‘Yes'); the red intensity indicated strong GFP signals. (b,c) Quantification of VEGFR1+ cells in bone marrow (b) and lung (c) of mice (female 6–8-week-old nude mice, n=3 per group) from each experimental group by flow cytometry analysis. (d) Representative three-dimensional tomography image of mice showing accumulation of GFP-positive cells in the thoracic region and in the subcutaneous tumour indicated by red frames (left panel) and quantification of VEGFR1+ cells in the subcutaneous tumours (right panel). (e) Migrating ability of sorted VEGFR1+ and VEGFR1 bone marrow cells compared by FBS-gradient induced cell migration assay (scale bar, 100 μm). (f) The migration ability of VEGFR1+ bone marrow cells in response to the attraction of conditioned medium from IGF2-induced fibroblasts in the presence or absence of VEGF antibody was compared (scale bar, 100 μm). (g) Outline of experimental scheme and the effect of VEGFR1 blockade on tumour growth (female 6–8-week-old nude mice, n=6 per group; scale bar, 1 cm). (h) Experimental scheme and bioluminescence imaging showing effect of VEGFR1 blockade on lung metastasis; sections of lung tissue (H & E stained) are shown in the bottom panel (female 6–8-week old nude mice, n=8 per group; scale bars, 200 μm and 100 μm for top and bottom rows of photomicrographs, respectively). Bars, s.d.; *P<0.05; **P<0.01, ***P<0.001 by Student's t-test.
Figure 6
Figure 6. Fibroblast-derived VEGF enriches VEGFR1+ cells bone marrow and pre-metastatic sites.
(a) Immunohistochemical expression of mouse VEGF in the tumour xenografts established with KYSE150-Id1, KYSE150-Id1-shIGF2 or vector control cells (scale bar, 20 μm). (b) Flow cytometry data showing the expression of VEGFR1+ cells in bone marrow (upper panel) and lungs (lower panel) of mice with subcutaneous implantation of indicated fibroblasts and treatment (female 6–8-week-old nude mice, n=3 per group). (c,d) Flow cytometry analysis of VEGFR1+ cells (c) and comparison of tumour volume (d) of subcutaneous tumour xenografts established from co-implantation of KYSE150 cells and indicated NEFs in the presence or absence of Avastin treatment. Photographs show representative tumours of the three groups (female 6–8-week-old nude mice, n=6 per group; scale bar, 1 cm). Bars, s.d.; *P<0.05; **P<0.01; ***P<0.001 by Student's t-test.
Figure 7
Figure 7. VEGFR1+ bone marrow cells interact with ESCC cells to promote tumour growth and metastasis.
(a) Experimental scheme of bone marrow admixture-tumour xenograft model. Bioluminescence imaging (inset) showed absence of spontaneous metastasis in the lungs 2 weeks after the mice were subcutaneously injected with Luc-expressing KYSE150-Id1 cancer cells. (b) Representative photos and growth curves of tumours among the experimental groups (female 6–8-week-old nude mice, n=6 per group; scale bar, 1 cm). (c) Experimental scheme of the bone marrow admixture-experimental metastasis model (left panel); bioluminescence imaging and quantification of lung metastasis (right panel) (female 6–8-week-old nude mice, n=5 per group; scale bars, 200 μm and 100 μm for top and bottom rows of photomicrographs, respectively). (d) Experimental scheme of the bone marrow admixture-spontaneous metastasis model (left panel); bioluminescence imaging, macroscopic (arrows indicate visible metastases; scale bar, 1 cm) and microscopic pictures of the dissected lungs and quantification of lung weight (right panel) (female 6–8-week-old nude mice, n=5 per group; scale bars, 200 μm and 100 μm for top and bottom rows of photomicrographs, respectively). Bars, s.d.; *P<0.05; **P<0.01; ***P<0.001 by Student's t-test.
Figure 8
Figure 8. Id1-expressing tumour stimulates the formation of pre-metastatic niches in lungs.
(a) Invasion ability of ESCC cells induced by the conditioned medium of lung cells from mice bearing the tumours expressing Id1 alone, Id1-shIGF2, or vector control, respectively (scale bar, 100 μm). (b) Cytokine profiling of conditioned medium of lung cells from nude mice bearing Id1-expressing and control tumour xenograft, respectively, was performed using a mouse cytokine antibody array. Blue frames indicate the internal positive control and red frames indicate the proteins with markedly increased expression. (c) Quantification of CXCL5 level in conditioned medium of lung cells. (d) The invasion of KYSE270 cells attracted by CXCL5 in the absence or presence of CXCR2 antibody was determined. (e) The invasion ability of KYSE270 cells attracted by conditioned medium from mouse lung cells in the presence or absence of CXCR2 or CXCL5 antibody was compared. Three biological replicates were performed for in vitro assays. Bars, s.d.; *P<0.05; **P<0.01, ***P<0.001 by Student's t-test.
Figure 9
Figure 9. Schematic diagram summarizing the regulatory role of the Id1/IGF2/VEGF/VEGFR1 cascade in oesophageal cancer progression.
IGF2 secreted by Id1-expressing cancer cells activates fibroblasts to secrete VEGF which exerts paracrine effects in the tumour microenvironment, as well as instigates VEGFR1+ bone marrow cells in the tumour macroenvironment to facilitate distant metastasis.

Comment in

  • New incriminating evidence against IGF2.
    Ding W, Shehadeh LA. Ding W, et al. Transl Cancer Res. 2017 Aug;6(Suppl 6):S949-S952. doi: 10.21037/tcr.2017.06.07. Transl Cancer Res. 2017. PMID: 30613484 Free PMC article. No abstract available.

References

    1. Zajicek G. Cancer as a systemic disease. Med. Hypotheses 4, 193–207 (1978). - PubMed
    1. Al-Zoughbi W. et al. Tumor macroenvironment and metabolism. Semin. Oncol. 41, 281–295 (2014). - PMC - PubMed
    1. McAllister S. S. & Weinberg R. A. The tumour-induced systemic environment as a critical regulator of cancer progression and metastasis. Nat. Cell Biol. 16, 717–727 (2014). - PMC - PubMed
    1. Orimo A. et al. Stromal fibroblasts present in invasive human breast carcinomas promote tumor growth and angiogenesis through elevated SDF-1/CXCL12 secretion. Cell 121, 335–348 (2005). - PubMed
    1. Quail D. F. & Joyce J. A. Microenvironmental regulation of tumor progression and metastasis. Nat. Med. 19, 1423–1437 (2013). - PMC - PubMed

Publication types

MeSH terms

Substances