. 2017 Feb 10:7:42065.
doi: 10.1038/srep42065.

Stability, structural and functional properties of a monomeric, calcium-loaded adenylate cyclase toxin, CyaA, from Bordetella pertussis

Affiliations

Stability, structural and functional properties of a monomeric, calcium-loaded adenylate cyclase toxin, CyaA, from Bordetella pertussis

Sara E Cannella et al. Sci Rep. .

Abstract

Bordetella pertussis, the causative agent of whooping cough, secretes an adenylate cyclase toxin, CyaA, which invades eukaryotic cells and alters their physiology by cAMP overproduction. Calcium is an essential cofactor of CyaA, as it is the case for most members of the Repeat-in-ToXins (RTX) family. We show that the calcium-bound, monomeric form of CyaA, hCyaAm, conserves its permeabilization and haemolytic activities, even in a fully calcium-free environment. In contrast, hCyaAm requires sub-millimolar calcium in solution for cell invasion, indicating that free calcium in solution is involved in the CyaA toxin translocation process. We further report the first in solution structural characterization of hCyaAm, as deduced from SAXS, mass spectrometry and hydrodynamic studies. We show that hCyaAm adopts a compact and stable state that can transiently conserve its conformation even in a fully calcium-free environment. Our results therefore suggest that in hCyaAm, the C-terminal RTX-domain is stabilized in a high-affinity calcium-binding state by the N-terminal domains while, conversely, calcium binding to the C-terminal RTX-domain strongly stabilizes the N-terminal regions. Hence, the different regions of hCyaAm appear tightly connected, leading to stabilization effects between domains. The hysteretic behaviour of CyaA in response to calcium is likely shared by other RTX cytolysins.


Conflict of interest statement

The authors declare no competing financial interests.

Figures

Figure 1
Figure 1. Calcium-dependent stability of hCyaAm over time.
Panel (A) (buffer A complemented with 2 mM calcium) and Panel (B) (buffer A complemented with 0.2 mM EDTA): Chromatograms of hCyaAm samples at various time points showing the distribution of monomers and multimers. Samples of hCyaAm at 1 μM were loaded into the injection loop of an Äkta Pure Chromatography System (see Figure S2). At various time points, aliquots of CyaA were injected into a Superdex 200 10/300 column equilibrated with the same buffer as the hCyaAm sample loaded into the injection loop. The species of CyaA are defined according to their retention volumes, i.e., multimers (8–9 mL) and monomers (11–13 mL). Panel (C) fractions of the monomers (filled circles) and multimers (open squares) were calculated by integrating the area under each peak on the chromatograms. SEC experiments were done in buffer A alone (green) or complemented with 2 (red), 0.5 (blue), 0.2 (black) mM calcium. Panel (D) hCyaAm samples were buffer exchanged on G25 column against buffer A complemented with 0.2 mM EDTA and the Superdex 200 10/300 column was equilibrated with the same buffer. Fractions of CyaA monomers (red circles) and CyaA multimers (blue squares) are shown. Buffer A contains 20 mM Hepes, 150 mM NaCl, pH 7.4. Standard deviation values: ±5%. Three independent preparations of hCyaAm were used for this experiment.
Figure 2
Figure 2. Kinetics of holo-RD unfolding upon release of calcium.
Panel (A) EDTA-induced dissociation of calcium from holo-RD followed by tryptophan fluorescence spectroscopy. Two mL of 1 μM of holo-RD in buffer A +2 mM CaCl2 were rapidly mixed with 1 mL of buffer A +5 mM EDTA: the final concentrations of CaCl2 and EDTA became 1.33 mM and 1.66 mM respectively, yielding a free calcium concentration below 0.48 μM. The data show that Holo-RD is fully converted into the apo-RD state in less than 10 seconds. Panel A Inset: Fluorescence spectra of holo-RD in buffer A +2 mM CaCl2 (red) and 20 sec after addition of 5 mM EDTA (green). The spectra are stable on the time scale of the RD experiments. Panel (B) Light scattering analysis of the hydrodynamic radius of RD in the presence of 2 mM CaCl2 (red) and after addition of 5 mM EDTA (green). QELS data were collected and averaged each 10 seconds on RD (12 μM) equilibrated in buffer A +2 mM CaCl2. EDTA was added at time t = 0 to a final concentration of 5 mM (i.e. residual free calcium below 20 nM), and after 10 sec of mixing, QELS data were similarly collected. The average hydrodynamic radii of holo-RD and apo-RD (open circles with error bars) are 3.2 ± 0.3 and 7.2 ± 1.2 nm, respectively in agreement with our prior results. Panel C: Size exclusion chromatography of RD in the presence or absence of calcium. Samples of 5 μM of Holo-RD (dark tone: in buffer A) or apo-RD (light tone: buffer A +2 mM CaCl2) were loaded on a Superdex 200 10/300 column equilibrated either in buffer A +2 mM CaCl2 (red chromatogram) or in buffer A (green chromatogram), at a flow rate is 1 mL/min. The retention volume of holo-RD (14 mL) and apo-RD (10 mL) are characteristics of the folded holo-form and the natively disordered apo-form, respectively. Thus, holo-RD was fully converted to the apo-form during the chromatography time (i.e. within less than 10 minutes).
Figure 3
Figure 3. Identification of proteolytic sites in hCyaAm in the presence of 0.5 or 2 mM calcium.
A batch of hCyaAm at a final concentration of 0.8 μM in buffer A complemented with 0.5 or 2 mM CaCl2 was incubated at 20 °C with trypsin at a final concentration of 20 nM. A sample of hCyaAm without trypsin was included as negative control. Trypsin reaction was stopped by adding AEBSF at final concentration of 200 μM and by plunging the samples into liquid nitrogen. Black stars (★) represent the proteolytic sites identified by mass spectrometry in the presence of 0.5 mM CaCl2 (upper panel) or in the presence of 2 mM CaCl2 (middle panel). The fraction of proteolysis sites over the number of amino acids in each region is 7, 11, 1.5, 5 and 3% in ACD, TR, HR, AR and RD, respectively. The same experiment has been performed on the isolated RD domain (residues 1001–1706). Black stars (★) represent proteolytic sites identified in 0.5 mM calcium, violet stars (formula image
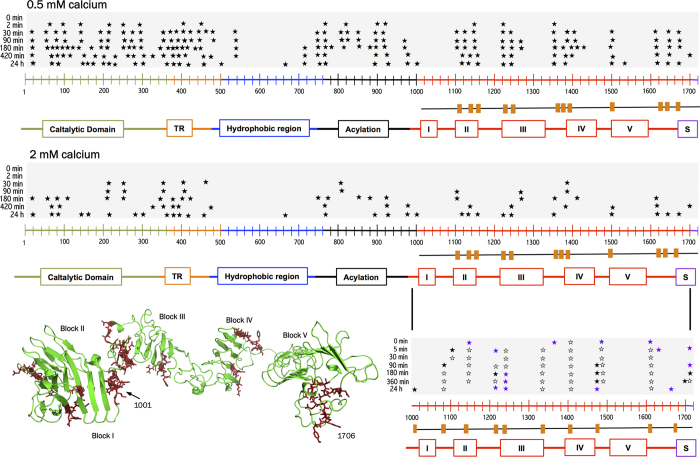
) correspond to cuts identified in 2 mM calcium and open stars (☆) are proteolytic sites identified in both, 0.5 and 2 mM calcium. All proteolytic sites are listed in Tables S1 to S4. The orange boxes below the CyaA sequences correspond to the cleavage sites identified in CyaA and absent in RD while orange boxes below RD sequence correspond to proteolytic sites observed in RD only. These latter proteolytic sites, labeled in red on the SAXS-derived model of holo-RD (34), highlight the regions stabilized in the full-length toxin by the presence of other domains. Buffer A contains 20 mM Hepes, 150 mM NaCl, pH 7.4. Two independent preparations of hCyaAm were used for this experiment.
Figure 4
Figure 4. Thermal stability of hCyaAm followed by tryptophan fluorescence.
Panel (A) Temperature-induced unfolding of hCyaAm at 50 nM followed by intrinsic fluorescence of tryptophan using the ratio of fluorescence emission intensities at 320 nm and 360 nm (rFI 320/360) as described in Materials and Methods. Panel (B) Effect of ionic strength and the presence of the molecular crowding agent Ficoll 100 g/L on the stability of hCyaAm as a function of calcium concentration (i.e., 0, 0.2, 0.5, 1, 2 and 3 mM calcium); hCyaAm in 20 mM Hepes, 50 mM NaCl (grey circles formula image
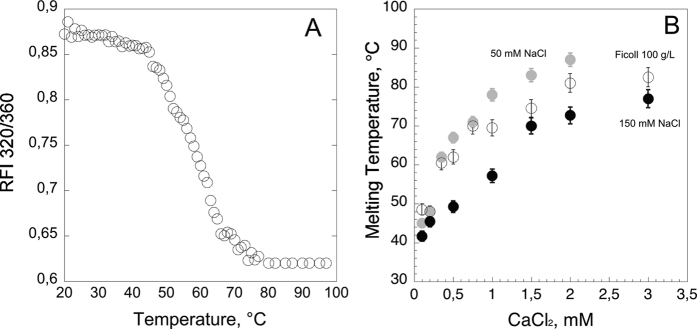
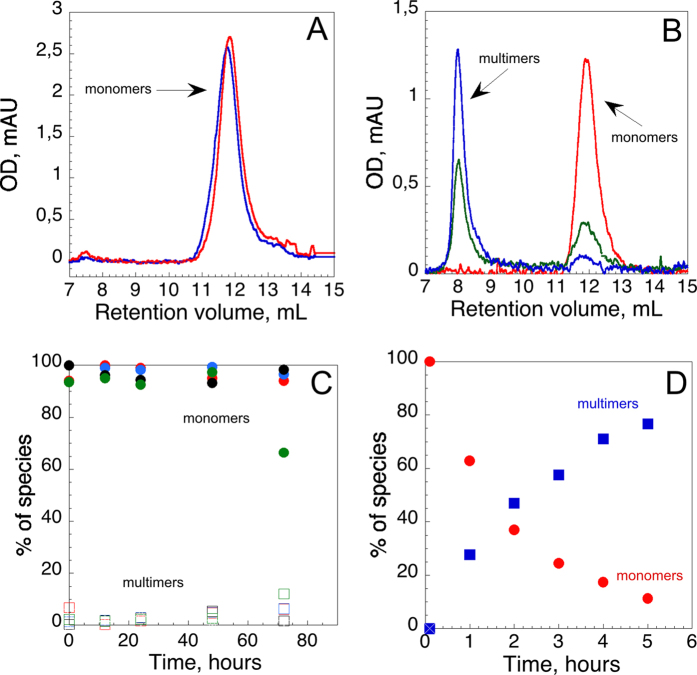
), hCyaAm in 20 mM Hepes, 150 mM NaCl (buffer A, black circles ⦁) and hCyaAm in 20 mM Hepes, 150 mM NaCl, Ficoll 100 g/L (open circles ⚪). Buffer A contains 20 mM Hepes, 150 mM NaCl, pH 7.4. Error bars: S.D. Three independent preparations of hCyaAm were used for this experiment.
Figure 5
Figure 5. LUV permeabilization by various CyaA species.
Panel (A) Amplitudes of ANTS fluorescence changes induced by monomeric holo-CyaA (hCyaAm, red circles), multimeric CyaA (M-CyaA, blue squares) and CyaA diluted from the urea stock solution (U-CyaA, green diamonds). A final concentration of 50 nM of CyaA was added to a LUV solution of 500 μM of lipids. The lipids composition of the LUV was POPC:POPG:Chol in a ratio of 3:1:1. Panel (B) Permeabilization of LUV by the different CyaA species (same color code as in panel A). Panel (C) Permeabilization of LUV (pre-incubated in buffer A) by different CyaA species pre-incubated in buffer A complemented with 2 mM CaCl2. Panel (D) Permeabilization of LUV (pre-incubated in buffer A and complemented with 3 mM EDTA) by the different CyaA species pre-incubated in buffer A. Buffer A contains 20 mM Hepes, 150 mM NaCl, pH 7.4. Standard deviation values in panel (A) ±30 fluorescence intensity units. Four independent preparations of CyaA were used for this set of experiments.
Figure 6
Figure 6. Hemolytic activity of the different CyaA species.
The different CyaA samples, i.e., CyaA in urea (U-CyaA, green diamonds), holo-CyaA monomers (hCyaAm, red circles), CyaA multimers (M-CyaA, blue squares), were directly diluted into erythrocyte suspensions to reach the indicated final concentrations. Panel (A) Erythrocytes were washed and resuspended in buffer A complemented with 2 mM calcium before the hemolysis assay. CyaA batches were in buffer A complemented with 2 mM calcium. Panel (B) Free calcium was removed from all CyaA samples by buffer exchange on a G25 column equilibrated with buffer A. Cells were also washed and resuspended in buffer A. Panel (C) Erythrocytes were washed in buffer A and resuspended in the presence of 2 mM EDTA. Free calcium was removed from all CyaA samples by buffer exchange on a G25 column equilibrated with buffer A. Panel (D) Excess calcium was removed from a preparation of holo-CyaA monomers by buffer exchange on a G25 column equilibrated with buffer A. The protein (2.6 μM hCyaAm) was then incubated at room temperature with an excess of 4 mM EDTA for different times, 24 hours (filled red circles), 6 hours (filled green circles), 5 hours (filled dark blue circles), 4 hours (filled dark green circles), 3 hours (filled cyan circles), 2 hours (filled violet circles), 1 hour (filled orange circles), 5 min (filled grey circles), or 0 min (plain black circles) and then directly diluted - to the final indicated concentrations - into erythrocytes, washed in Buffer A and resuspended in buffer A +4 mM EDTA. The hemolysis was recorded after an overnight incubation at 37 °C. The insert shows the % of hemolysis (measured at 20 nM final concentration of protein) as a function of time of incubation of hCyaAm with EDTA. Buffer A contains 20 mM Hepes, 150 mM NaCl, pH 7.4. Standard deviation values: ±5%. Two independent preparations of CyaA were used for this experiment.
Figure 7
Figure 7. Intoxication activity of the different CyaA species.
The protein samples, i.e., hCyaAm (red circles), U-CyaA, (green diamonds), M-CyaA, (blue squares), AC364 (black circles) were directly diluted into erythrocyte suspensions to reach the final concentrations. CyaA in 6 M urea was buffer exchanged on a G25 equilibrated with buffer A +2 mM CaCl2, providing the U-CyaA sample. Panel (A) Erythrocytes were washed and resuspended in buffer A complemented with 2 mM calcium. Panel (B) All protein samples were buffer exchanged on a G25 equilibrated with buffer A to remove calcium. Erythrocytes where washed and resuspended in buffer A. Panel (C) cAMP accumulation in erythrocytes as a function of calcium concentration. Erythrocytes were extensively washed in buffer A and then supplemented with the indicated concentrations of calcium (i.e., 0, 0.2, 0.5, 0,8, 1.5 and 2 mM CaCl2). Monomeric hCyaAm was desalted on G25 equilibrated in buffer A and diluted into the erythrocyte suspensions at a protein concentration of 2.8 nM, i.e., 500 ng/mL. Buffer A contains 20 mM Hepes, 150 mM NaCl, pH 7.4. Standard deviation values: ±12 nM cAMP. Three independent preparations of CyaA were used for this experiment.
Figure 8
Figure 8. SAXS study of hCyaAm.
Panel (A) UV elution profile of CyaA from the size exclusion chromatography column Bio SEC-3 equilibrated in buffer A complemented with 4 mM CaCl2 in-line with the SAXS measuring cell. Panel (B) distance distribution function P(r) derived from hCyaAm scattering pattern scaled to I(0). The dashed green line corresponds to the P(r) curve obtained by injecting the sample into the size exclusion chromatography column equilibrated with buffer A complemented with 2 mM EDTA. Panel (C) dimensionless Kratky plot of hCyaAm scattering pattern (red line) and PolX scattering pattern (black line, PolX is a compact, fully structured, globular protein80). Panel (D) Two views of the most typical DAMMIN model of CyaA. Top/bottom views are rotated by 90°. Buffer A contains 20 mM Hepes, 150 mM NaCl, pH 7.4. Two independent preparations of hCyaAm were used for this experiment.

References

    1. Ladant D. & Ullmann A. Bordatella pertussis adenylate cyclase: a toxin with multiple talents. Trends in microbiology 7, 172–176 (1999). - PubMed
    1. Vojtova J., Kamanova J. & Sebo P. Bordetella adenylate cyclase toxin: a swift saboteur of host defense. Curr Opin Microbiol 9, 69–75 (2006). - PubMed
    1. Shrivastava R. & Miller J. F. Virulence factor secretion and translocation by Bordetella species. Curr Opin Microbiol 12, 88–93, doi: 10.1016/j.mib.2009.01.001 (2009). - DOI - PMC - PubMed
    1. Carbonetti N. H. Pertussis toxin and adenylate cyclase toxin: key virulence factors of Bordetella pertussis and cell biology tools. Future Microbiol 5, 455–469, doi: 10.2217/fmb.09.133 (2010). - DOI - PMC - PubMed
    1. Glaser P. et al.. The calmodulin-sensitive adenylate cyclase of Bordetella pertussis: cloning and expression in Escherichia coli. Molecular microbiology 2, 19–30 (1988). - PubMed

Publication types

LinkOut - more resources