. 2017 Feb 10:7:42394.
doi: 10.1038/srep42394.

Dysregulated autophagy increased melanocyte sensitivity to H2O2-induced oxidative stress in vitiligo

Affiliations

Dysregulated autophagy increased melanocyte sensitivity to H2O2-induced oxidative stress in vitiligo

Yuanmin He et al. Sci Rep. .

Abstract

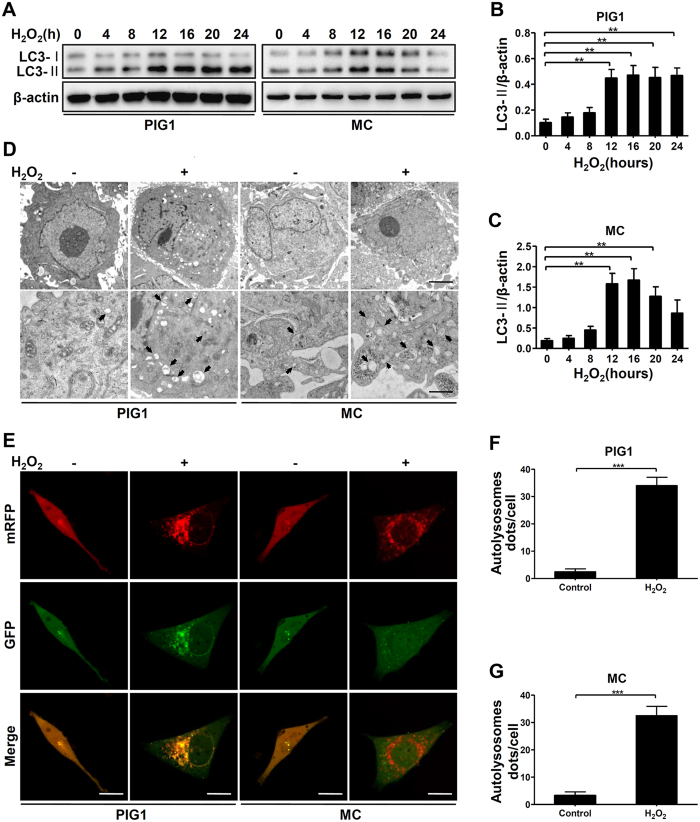
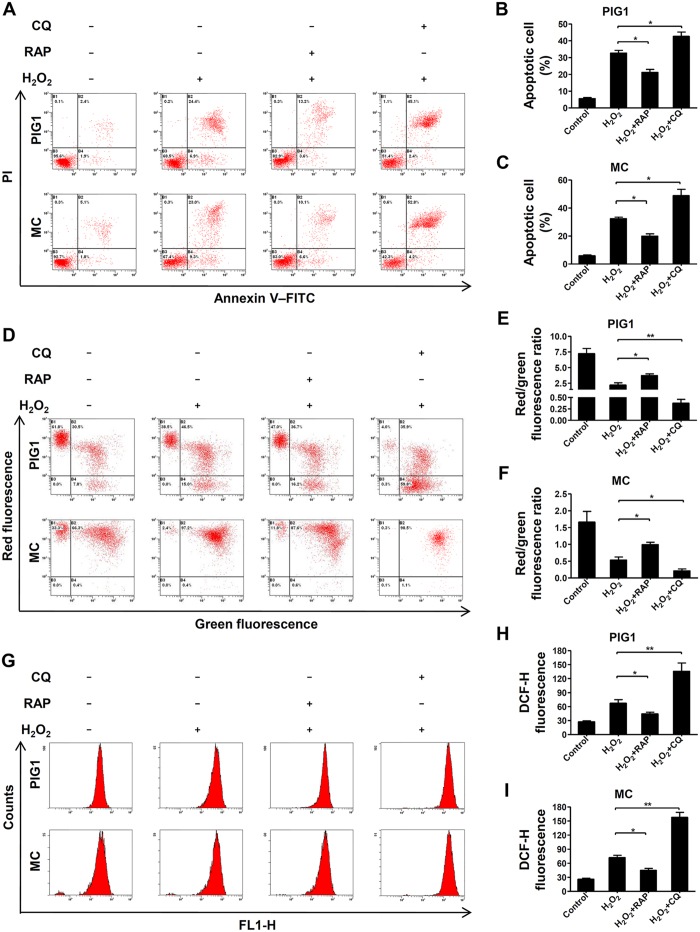
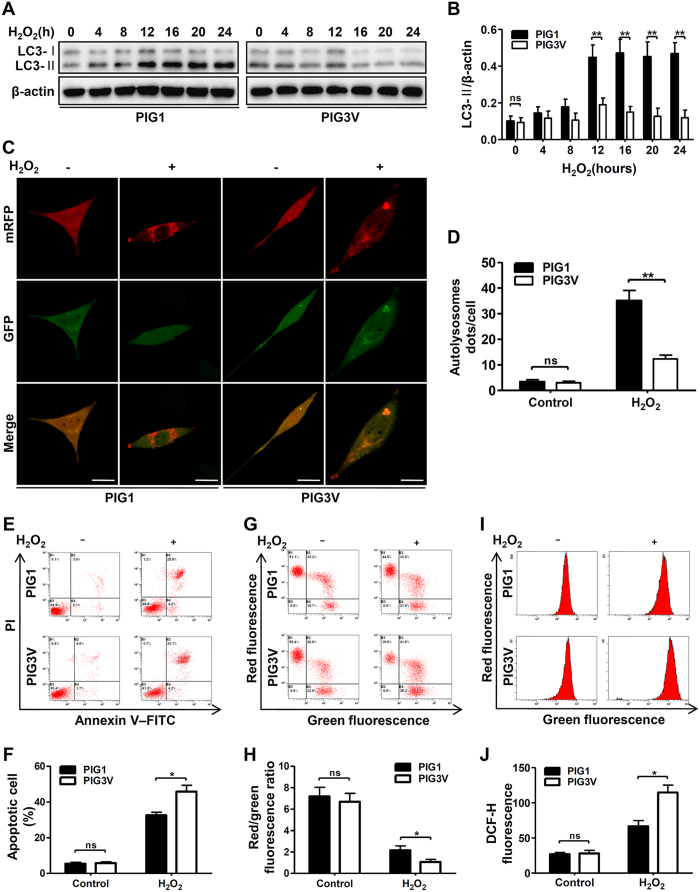
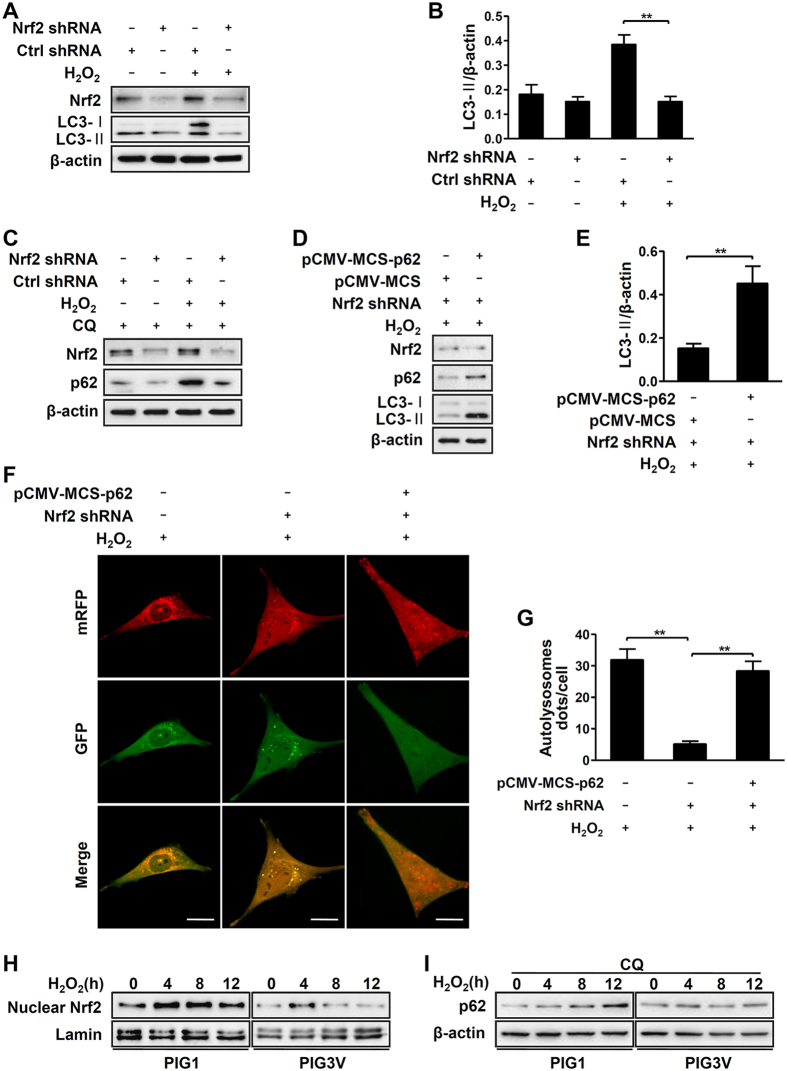
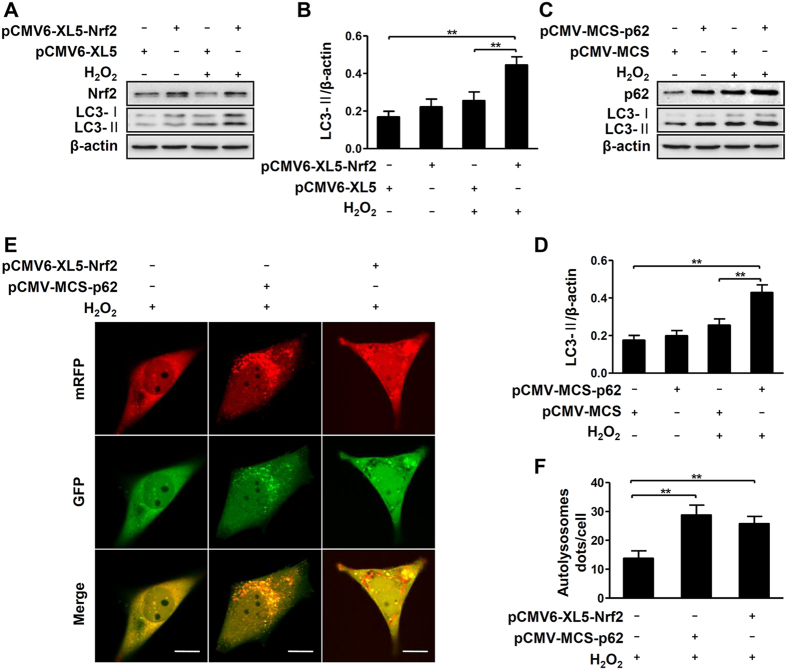
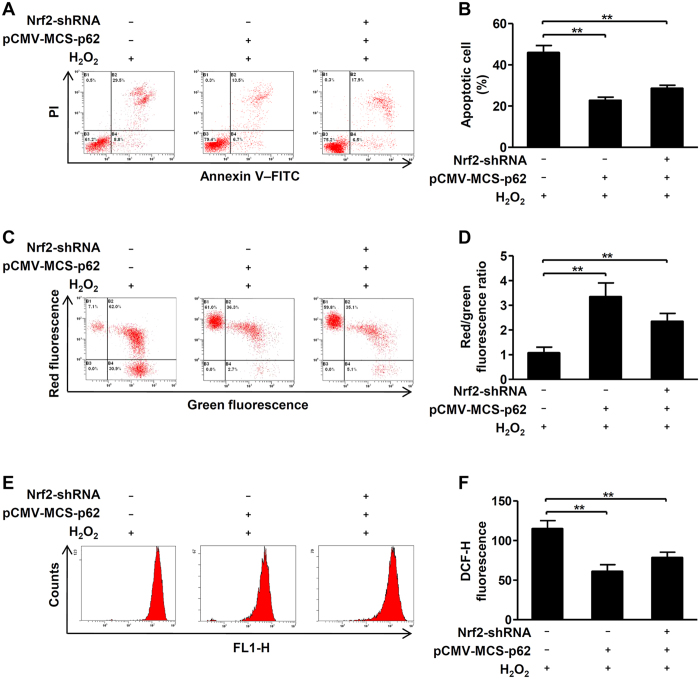
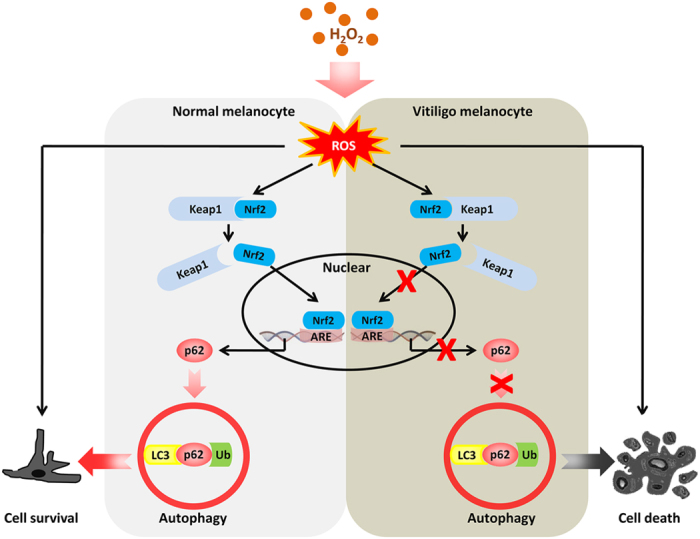
In vitiligo, melanocytes are particularly vulnerable to oxidative stress owing to the pro-oxidant state generated during melanin synthesis and to the genetic antioxidant defects. Autophagy is a controlled self-digestion process which can protect cells against oxidative damage. However, the exact role of autophagy in vitiligo melanocytes in response to oxidative stress and the mechanism involved are still not clear. To determine the implications of autophagy for melanocyte survival in response to oxidative stress, we first detected the autophagic flux in normal melanocytes exposure to H2O2, and found that autophagy was significantly enhanced in normal melanocytes, for protecting cells against H2O2-induced oxidative damage. Nevertheless, vitiligo melanocytes exhibited dysregulated autophagy and hypersensitivity to H2O2-induced oxidative injury. In addition, we confirmed that the impairment of Nrf2-p62 pathway is responsible for the defects of autophagy in vitiligo melanocytes. Noteworthily, upregulation of the Nrf2-p62 pathway or p62 reduced H2O2-induced oxidative damage of vitiligo melanocytes. Therefore, our data demonstrated that dysregulated autophagy owing to the impairment of Nrf2-p62 pathway increase the sensitivity of vitiligo melanocytes to oxidative stress, thus promote the development of vitiligo. Upregulation of p62-dependent autophagy may be applied to vitiligo treatment in the future.


Conflict of interest statement

The authors declare no competing financial interests.

Figures

Figure 1
Figure 1. H2O2 treatment increases autophagy flux in melanocytes.
(A) Immunoblots of LC3 in MC and PIG1 cells treated with H2O2 (0.5 mM) for different hours. (B,C) Band intensity normalized to β-actin is expressed as mean ± SD, **p < 0.01. (D) TEM images of autophagic vacuoles in cells treated with or without H2O2 for 12 hours. Arrows indicate the autolysosome. Scale bars represent 1 μm (upper row) and 500 nm (lower row). (E) MC and PIG1 cells were transfected with adenovirus expressing mRFP-GFP-LC3. After a 24-hour transfection, cells were treated with or without H2O2 for 12 hours. As shown in merged confocal images, the yellow puncta indicate the autophagosome while the red puncta indicate the autolysosome. Scale bars represent 5 μm. (F,G) The number of autolysosome dots were counted on 40 cells in a minimum of 3 experiments and expressed as mean ± SD, ***p < 0.001.
Figure 2
Figure 2. Increased autophagy protects melanocytes against oxidative stress while reduced autophagy renders cells more susceptible to oxidative stress.
(A) MC and PIG1 cells were pretreated with rapamycin (RAP, 400 nM) or chloroquine (CQ, 50 μM) for 2 hours and treated with H2O2 (0.5 mM) for 24 hours, then the level of apoptosis was detected by flow cytometry assay. (B,C) The level of apoptosis are presented as the mean ± SD, *p < 0.05. (D) MC and PIG1 cells were pretreated with rapamycin or chloroquine for 2 hours and treated with H2O2 for 24 hours, then the MMP was measured by flow cytometry assay. (E,F) Quantification of MMP are presented as the mean ± SD, *p < 0.05, **p < 0.01. (G) MC and PIG1 cells were pretreated with rapamycin or chloroquine for 2 hours and treated with H2O2 for 24 hours, then the intracellular ROS level was quantized by flow cytometry assay. (H,I) Quantification of intracellular ROS level are presented as the mean ± SD, *p < 0.05, **p < 0.01.
Figure 3
Figure 3. The difference in autophagy flux and cells sensitivity after H2O2 treatment between PIG1 and PIG3V cells.
(A) Immunoblots of LC3 in PIG1 and PIG3V cells treated with H2O2 (0.5 mM) for different hours. (B) Band intensity normalized to β-actin is expressed as mean ± SD, **p < 0.01. (C) PIG1 and PIG3V cells were transfected with adenovirus expressing mRFP-GFP-LC3. After a 24-hour transfection, cells were treated with or without H2O2 for 12 hours. As shown in merged confocal images, the yellow puncta indicate the autophagosome while the red puncta indicate the autolysosome. Scale bars represent 5 μm. (D) The number of autolysosome dots were counted on 40 cells in a minimum of 3 experiments and expressed as mean ± SD, **p < 0.01. (E) PIG1 and PIG3V cells were treated with H2O2 for 24 hours, and the level of apoptosis was detected by flow cytometry assay. (F) The level of apoptosis are presented as the mean ± SD, *p < 0.05. (G) PIG1 and PIG3V cells were treated with H2O2 for 24 hours, and the MMP was measured by flow cytometry assay. (H) Quantification of MMP are presented as the mean ± SD, *p < 0.05. (I) PIG1 and PIG3V cells were treated with H2O2 for 24 hours, then the intracellular ROS level were measured by flow cytometry assay. (J) Quantification of intracellular ROS level are presented as the mean ± SD, *p < 0.05.
Figure 4
Figure 4. Nrf2-p62 pathway affected autophagy in melanocytes
. (A) Immunoblots of Nrf2 and LC3 in PIG1 cells expressing Nrf2 shRNA, in the absence or presence of H2O2 (0.5 mM) for 12 hours. (B) The ratio of LC3-II/β-actin is presented as mean ± SD, **p < 0.01. (C) With chloroquine (CQ, 50 μM) pre-treatment, PIG1 cells expressing Nrf2 shRNA were treated with or without H2O2 for 12 hours. The expression level of Nrf2 and p62 were detected by western blotting. (D) PIG1 cells expressing Nrf2 shRNA were transfected with or without pCMV-MCS-p62 for 36 hours and then treated with H2O2 for 12 hours. The expression level of Nrf2, p62 and LC3 were detected by western blotting. (E) The ratio of LC3-II/β-actin is presented as mean ± SD, **p < 0.01. (F) PIG1 cells expressing Nrf2 shRNA were transfected with adenovirus expressing mRFP-GFP-LC3. After a 12-hour transfection, cells were treated with or without pCMV-MCS-p62 for 36 hours and then treated with H2O2 for 12 hours. As shown in merged confocal images, the yellow puncta indicate the autophagosome while the red puncta indicate the autolysosome. Scale bars represent 5 μm. (G) The number of autolysosome dots were counted on 40 cells in a minimum of 3 experiments and expressed as mean ± SD, **p < 0.01. (H) Immunoblots of nuclear Nrf2 in PIG1 and PIG3V cells treated with H2O2 for different hours. (I) Immunoblots of p62 in PIG1 and PIG3V cells co-treated with chloroquine and H2O2 for different hours.
Figure 5
Figure 5. Upregulation of Nrf2 or p62 promotes H2O2-induced autophagy in vitiligo melanocytes.
(A) Immunoblots of Nrf2 and LC3 in PIG3V cells which were transfected with pCMV6-XL5-Nrf2 for 36 hours and then were treated with H2O2 (0.5 mM) for 12 hours. (B) The ratio of LC3-II/β-actin is presented as mean ± SD, **p < 0.01. (C) Immunoblots of p62 and LC3 in PIG3V cells which were transfected with pCMV-MCS-p62 for 36 hours and then treated with H2O2 for 12 hours. (D) The ratio of LC3-II/β-actin is presented as mean ± SD, **p < 0.01. (E) PIG3V cells were transfected with adenovirus expressing mRFP-GFP-LC3. After a 12-hour transfection, cells were transfected with pCMV6-XL5-Nrf2 or pCMV-MCS-p62 for 36 hours and then treated with H2O2 for 12 hours. As shown in merged confocal images, the yellow puncta indicate the autophagosome while the red puncta indicate the autolysosome. Scale bars represent 5 μm. (F) The number of autolysosome dots were counted on 40 cells in a minimum of 3 experiments and expressed as mean ± SD, **p < 0.01.
Figure 6
Figure 6. Upregulation of p62 reduces sensitivity of vitiligo melanocytes to H2O2-induced oxidative stress.
(A) PIG3V cells were stably infected with or without the Nrf2 shRNA, then cells were transfected with or without pCMV-MCS-p62 for 24 hours and then treated with H2O2 (0.5 mM) for 24 hours, the level of apoptosis was detected by flow cytometry assay. (B) The level of apoptosis are presented as the mean ± SD, **p < 0.01. (C) PIG3V cells were stably infected with or without the Nrf2 shRNA, then cells were transfected with pCMV-MCS-p62 for 24 hours and then treated with H2O2 for 24 hours, the MMP was measured by flow cytometry assay. (D) Quantification of MMP are presented as the mean ± SD, **p < 0.01. (E) PIG3V cells were stably infected with or without the Nrf2 shRNA, then cells were transfected with pCMV-MCS-p62 for 24 hours and then treated with H2O2 for 24 hours, the intracellular ROS level was quantized by flow cytometry assay. (F) Quantification of intracellular ROS level are presented as the mean ± SD, **p < 0.01.
Figure 7
Figure 7. Nrf2-p62 pathway regulates autophagy in normal human melanocytes and vitiligo melanocytes under H2O2-induced oxidative stress.
Under H2O2-induced oxidative stress in normal human melanocytes, Nrf2 dissociates from Kelch-like ECH-associated protein (Keap1) and then translocates to the nucleus where it binds to ARE and finally upregulates p62 expression. Upregulation of p62 can further promote cell autophagy and then protect melanocytes from H2O2-induced oxidative damage. On the contrary, in vitiligo melanocytes, impaired activation of the Nrf2-p62 pathway leads to decreased p62 expression, which fails to induce cell autophagy and then cause cell death exposed to H2O2-induced oxidative stress.

References

    1. Ongenae K. et al.. Psychosocial effects of vitiligo. J Eur Acad Dermatol Venereol 20, 1–8 (2006). - PubMed
    1. Boissy R. E. & Manga P. On the etiology of contact/occupational vitiligo. Pigment Cell Res 17, 208–214 (2004). - PubMed
    1. Schallreuter K. U. et al.. Low catalase levels in the epidermis of patients with vitiligo. J Invest Dermatol 97, 1081–1085 (1991). - PubMed
    1. Schallreuter K. U. et al.. Blunted epidermal L-tryptophan metabolism in vitiligo affects immune response and ROS scavenging by Fenton chemistry, part 1: Epidermal H2O2/ONOO(−)-mediated stress abrogates tryptophan hydroxylase and dopa decarboxylase activities, leading to low serotonin and melatonin levels. FASEB J 26, 2457–2470 (2012). - PubMed
    1. Sravani P. V. et al.. Determination of oxidative stress in vitiligo by measuring superoxide dismutase and catalase levels in vitiliginous and non-vitiliginous skin. Indian J Dermatol Venereol Leprol 75, 268–271 (2009). - PubMed

Publication types

MeSH terms