. 2017 Feb 10:7:41902.
doi: 10.1038/srep41902.

A small subset of protected areas are a highly significant source of carbon emissions

Affiliations

A small subset of protected areas are a highly significant source of carbon emissions

Murray B Collins et al. Sci Rep. .

Abstract

Protected areas (PAs) aim to protect multiple ecosystem services. However, not all are well protected. For the first time, using published carbon and forest loss maps, we estimate carbon emissions in large forest PAs in tropical countries (N = 2018). We found 36 ± 16 Pg C stored in PA trees, representing 14.5% of all tropical forest biomass carbon. However the PAs lost forest at a mean rate of 0.18% yr-1 from 2000-2012. Lower protection status areas experienced higher forest losses (e.g. 0.39% yr-1 in IUCN cat III), yet even highest status areas lost 0.13% yr-1 (IUCN Cat I). Emissions were not evenly distributed: 80% of emissions derived from 8.3% of PAs (112 ± 49.5 Tg CO2 yr-1; n = 171). Unsurprisingly the largest emissions derived from PAs that started with the greatest total forest area; accounting for starting forest area and relating that to carbon lost using a linear model (r2 = 0.41), we found 1.1% outlying PAs (residuals >2σ; N = 23), representing 1.3% of the total PA forest area, yet causing 27.3% of all PA emissions. These results suggest PAs have been a successful means of protecting biomass carbon, yet a subset causing a disproportionately high share of emissions should be an urgent priority for management interventions.


Conflict of interest statement

The authors declare no competing financial interests.

Figures

Figure 1
Figure 1. Map of the 2018 PAs assessed in Non-Annex I countries, colour coded by IUCN categories I-VI.
IUCN Shapefiles downloaded from www.protectedplanet.net. Map created by the authors using QGIS 2.10.1 Pisa. http://www.qgis.org/and GIMP 2.8.14 https://www.gimp.org/.
Figure 2
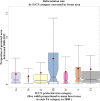
Figure 2. Forest loss rates in IUCN category protected areas 2000–2012.
Each box shows the middle half of the data, bounded by the 1st and 3rd quartiles with the median the central notched line in between, and the whiskers 1.5 times the inter-quartile range. The heavy skew in the data is indicated by the mean values (red diamond) being far higher than the median values in each class.
Figure 3
Figure 3. Gross deforestation rates and mean carbon stocks ha−1 in 2,018 PAs, with each bubble representing an individual protected area scaled by its original forest area in 2000; thereby characterising 21st century status and trends in PAs in UNFCCC Non-Annex I countries.
The vertical axis is the Log10 of deforestation rates 2000–2012 per site, corrected for original forest cover, and the horizontal axis indicating the mean forest carbon stocks. The image is bisected vertically by the mean forest carbon in the sample (115.6 Mg C ha−1), and horizontally by the mean of forest loss rates 2000–12 (Log102.6% = 0.41), producing four quadrants. PAs in Q1 have high gross forest loss rates, but low carbon stocks, hence large impacts for biodiversity and other ecosystem services, but low carbon emissions. PAs in Q2 have both low forest loss rates and carbon stocks, hence emissions are low. The majority of the low-emission outliers are found here, highlighted in green (n = 69). PAs in Q3 have high carbon stocks, but high loss rates, hence are large sources of emissions. The majority of the high-emission outliers are found here, highlighted in red (n = 23). PAs in Q4 have high carbon stocks but low forest loss rates. These are the world’s intact high-biomass forests serving as carbon stores and sinks.
Figure 4
Figure 4. The top five emitting IUCN PAs between 2000 and 2012: 1.
Triunfo do Xingu, Brazil (IUCN V), 2. Floresta Nacional do Jamanxim, Brazil (IUCN VI); 3. Maya biosphere buffer zone, Guatemala (IUCN VI); 4. Patuca National Park, Honduras (IUCN II); 5. Sebangau, Indonesia (IUCN II). For each of these numbered PAs we show below from left to right the first (from 2000) and last (from 2012) images from the global forest loss dataset, followed by an image of the forest loss estimated between these periods. We aggregated the change image to 300 m, with each pixel value indicating the proportion of forest lost 2000–2012. Image created using GIMP 2.8, https://www.gimp.org/. Source: Hansen/UMD/Google/USGS/NASA. Licence details: http://earthenginepartners.appspot.com/science-2013-global-forest/download_v1.2.html.
Figure 5
Figure 5. Regression model used in the estimation of outliers.
Log10 forest area explains almost half of the variation in Log10 of carbon emissions. This model allowed us to identify those sites which are disproportionately producing carbon emissions, given their original forest cover in the year 2000.

References

    1. Naidoo R. et al.. Global mapping of ecosystem services and conservation priorities. P. Natl. Acad. Sci. 105, 9495–9500 (2008). - PMC - PubMed
    1. MacDicken K. et al.. Forest Resource Assessment 2015. How are the world’s forests changing? Second edition. (Food and Agriculture Organisation of the United Nations, 2016). Available at: http://www.fao.org/3/a-i4793e.pdf. (Date of access: 1/11/2016).
    1. Gaveau D. L. A. et al.. Rapid conversions and avoided deforestation: examining four decades of industrial plantation expansion in Borneo. Sci. Reps. 6, 32017 (2016). - PMC - PubMed
    1. Koh L. & Sodhi N. Conserving Southeast Asia’s imperiled biodiversity: scientific, management, and policy challenges. Biodivers. Conserv. 19, 913–917 (2010).
    1. Grace J., Mitchard E. & Gloor E. Perturbations in the carbon budget of the tropics. Glob. Change Biol. 20, 3238–3255 (2014). - PMC - PubMed

Publication types