. 2017 Feb 10:8:14436.
doi: 10.1038/ncomms14436.

Selective molecular impairment of spontaneous neurotransmission modulates synaptic efficacy

Affiliations

Selective molecular impairment of spontaneous neurotransmission modulates synaptic efficacy

Devon C Crawford et al. Nat Commun. .

Abstract

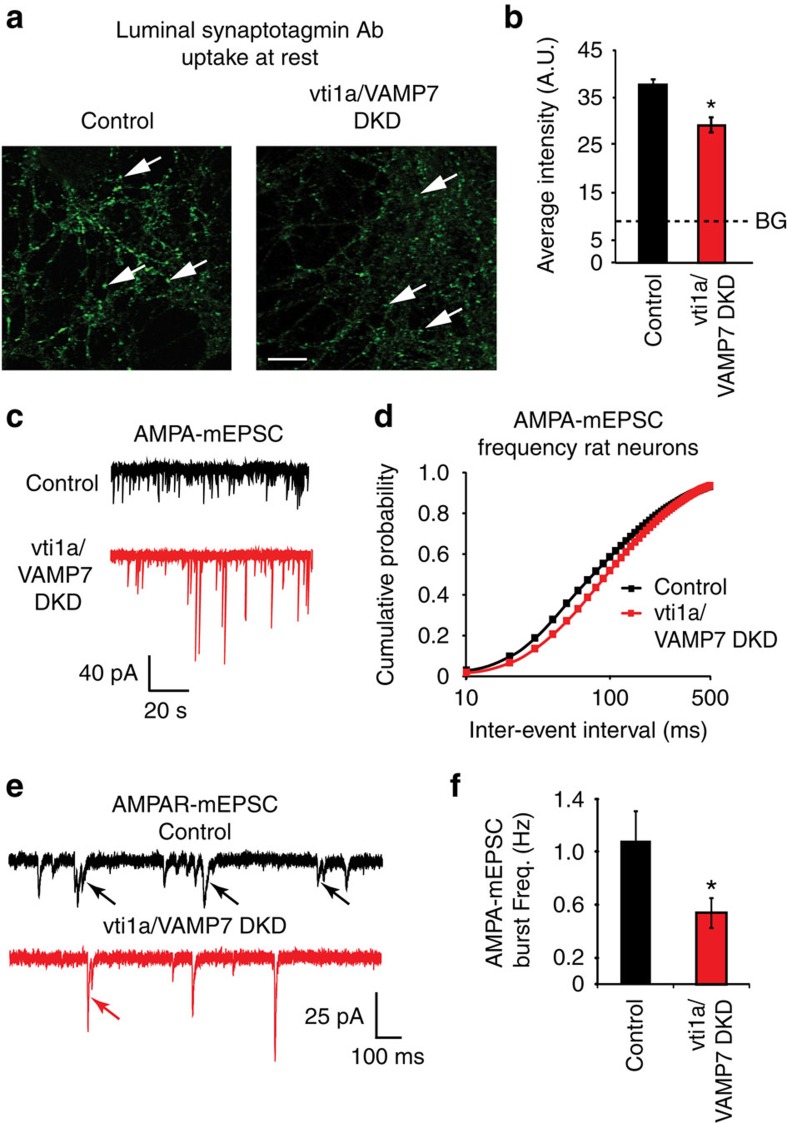
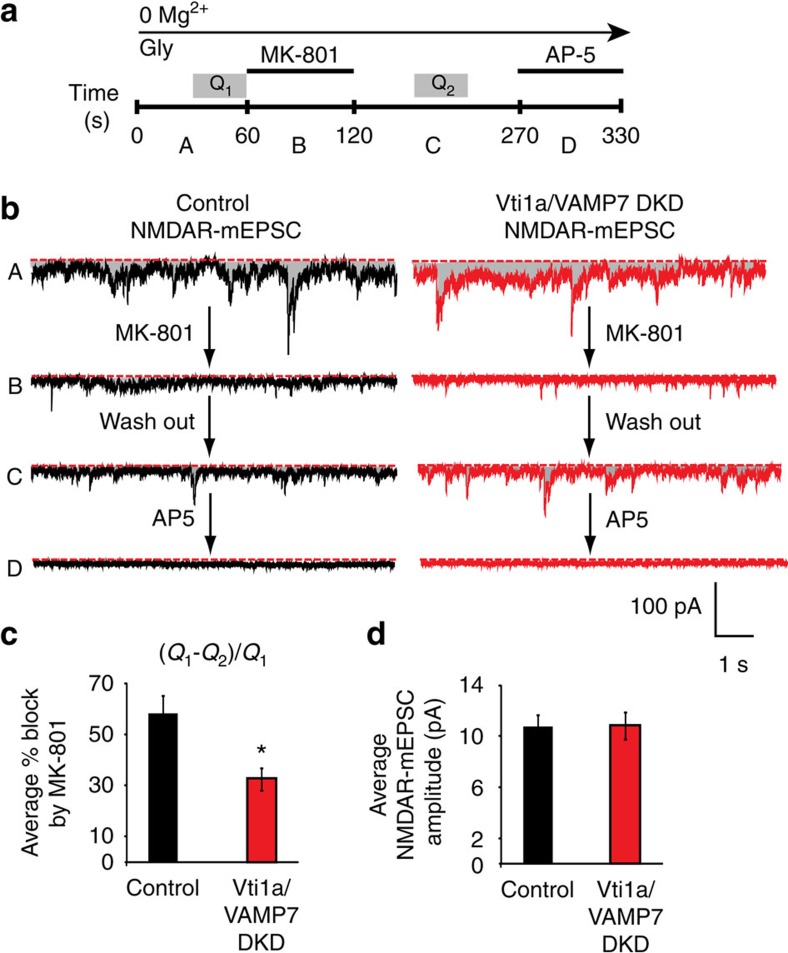
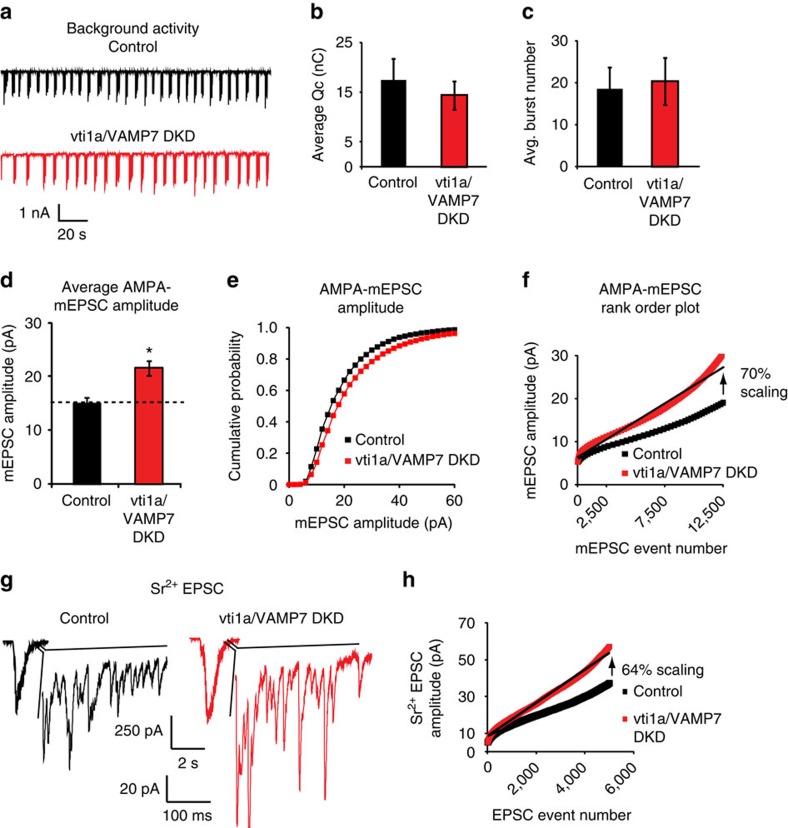
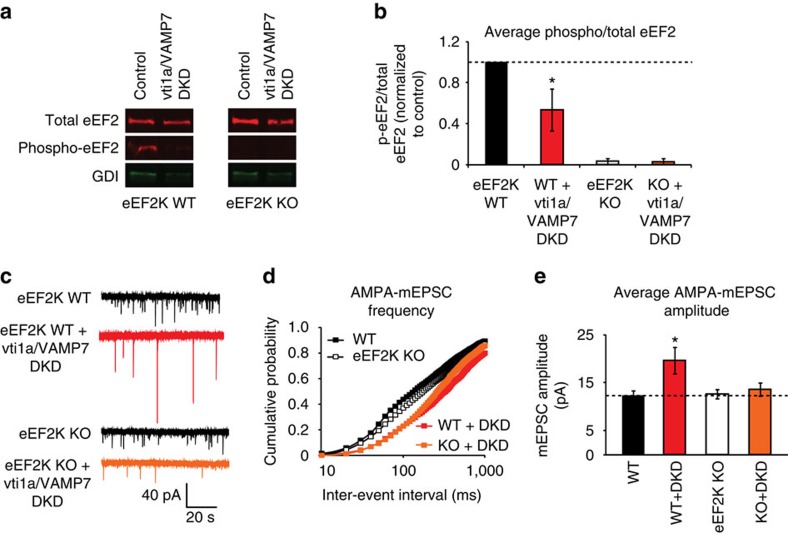
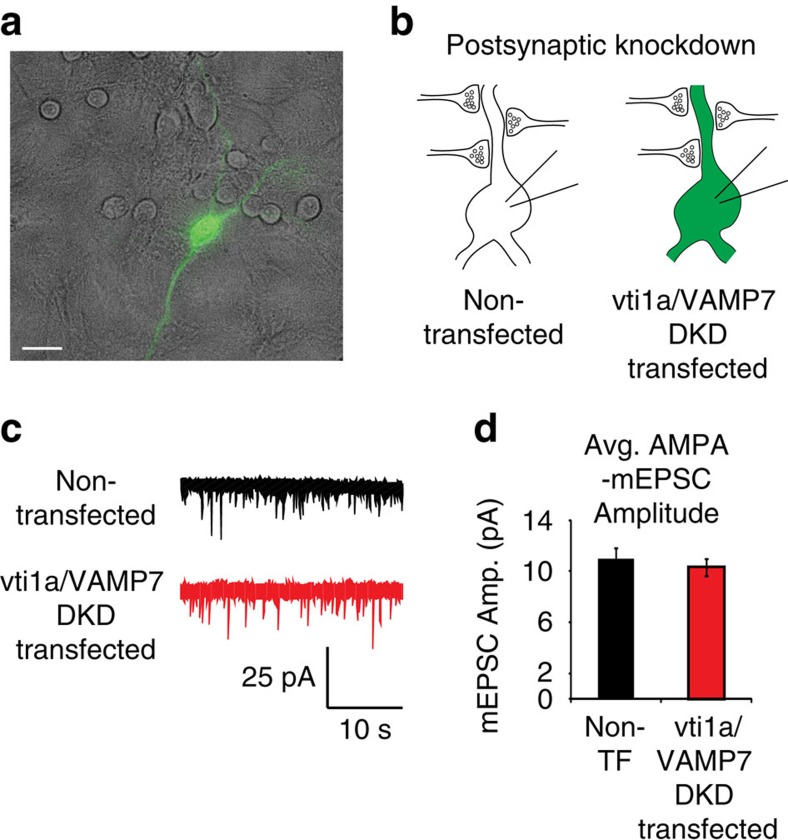
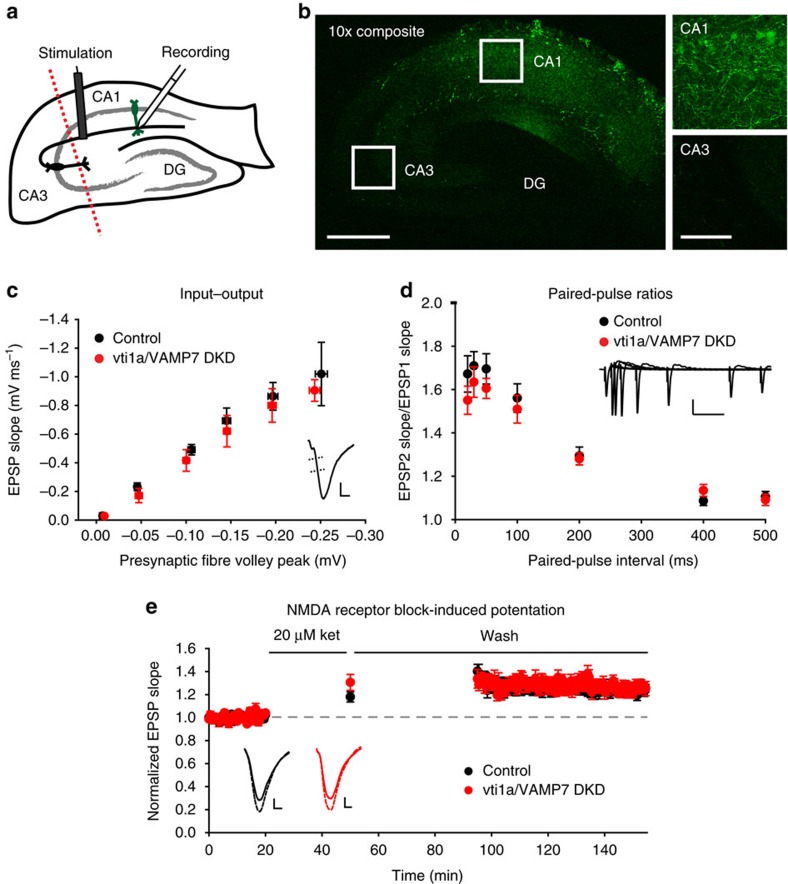
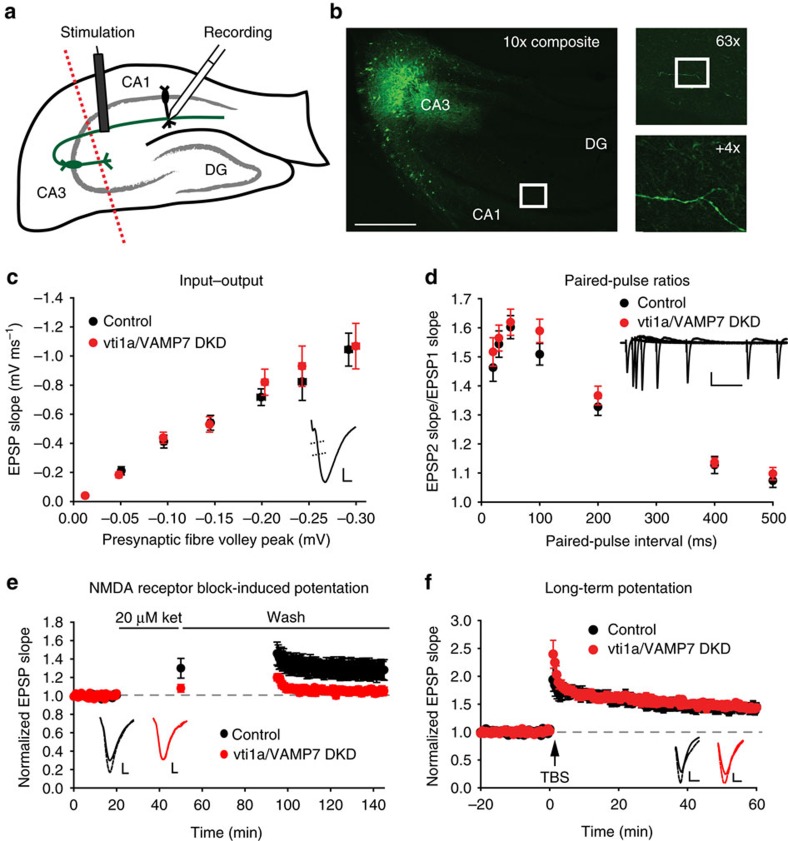
Recent studies suggest that stimulus-evoked and spontaneous neurotransmitter release processes are mechanistically distinct. Here we targeted the non-canonical synaptic vesicle SNAREs Vps10p-tail-interactor-1a (vti1a) and vesicle-associated membrane protein 7 (VAMP7) to specifically inhibit spontaneous release events and probe whether these events signal independently of evoked release to the postsynaptic neuron. We found that loss of vti1a and VAMP7 impairs spontaneous high-frequency glutamate release and augments unitary event amplitudes by reducing postsynaptic eukaryotic elongation factor 2 kinase (eEF2K) activity subsequent to the reduction in N-methyl-D-aspartate receptor (NMDAR) activity. Presynaptic, but not postsynaptic, loss of vti1a and VAMP7 occludes NMDAR antagonist-induced synaptic potentiation in an intact circuit, confirming the role of these vesicular SNAREs in setting synaptic strength. Collectively, these results demonstrate that spontaneous neurotransmission signals independently of stimulus-evoked release and highlight its role as a key regulator of postsynaptic efficacy.


Conflict of interest statement

The authors declare no competing financial interests.

Figures

Figure 1
Figure 1. Vti1a and VAMP7 loss in cultured rat hippocampal neurons decreases synaptic vesicle trafficking at rest.
(a) Representative images of anti-luminal domain of synaptotagmin 1 antibody uptake at rest in control and vti1a/VAMP7 DKD (DKD) neurons. White arrows indicate representative areas selected for intensity analysis typical of presynaptic boutons. Scale bar, 10 μm. (b) Quantification of anti-luminal domain of synaptotagmin 1 antibody intensity at rest in control and vti1a/VAMP7 DKD neurons (control: n=167 puncta from 10 images from two independent cultures; vti1a/VAMP7 DKD: n=221 puncta from 11 images from two independent cultures; P=0.002). Background (BG; dashed line) fluorescence levels were obtained from similar experiments in which the primary antibody was omitted. (c) Representative traces of spontaneous AMPA event (AMPA-mEPSC) recordings in control and vti1a/VAMP7 DKD neurons. (d) Cumulative probability histograms of AMPA-mEPSC inter-event intervals (control: n=29 recordings from seven independent cultures; vti1a/VAMP7 DKD: n=31 recordings from seven independent cultures; Kolmogorov–Smirnov test; P=0.0001). (e) Representative traces of AMPA-mEPSC recordings containing mini-bursts (indicated by arrows) in control and vti1a/VAMP7 DKD neurons. (f) Average AMPA-mEPSC burst frequency was significantly decreased in vti1a/VAMP7 DKD neurons compared with control in the same recordings analysed in d (P=0.036).
Figure 2
Figure 2. Vti1a- and VAMP7-contaning synaptic vesicles regulate tonic NMDA receptor (NMDAR) activation.
(a) Diagram showing the experimental strategy. Basal NMDAR-mEPSCs were recorded from cultured rat hippocampal neurons in the absence of extracellular Mg2+ and the presence of the co-agonist, glycine (10 μM). Neurons were then incubated with the use-dependent and slowly reversible NMDAR antagonist MK-801 (10 μM) for 1 min and subsequently washed for 1.5 min. AP-5 (50 μM) was added at the end of the experiment to confirm that the mEPSCs originated from NMDARs. Q1 and Q2 indicate regions where total charge transfer was measured and used for analysis of percent NMDAR blockade by MK801. A-D corresponds to regions containing the sample traces shown in b. (b) Sample NMDAR-mEPSC traces from control and vti1a/VAMP7 DKD neurons subjected to the indicated treatments shown in panel a. (c) Quantification of percent block of the NMDAR by MK-801 in control and vti1a/VAMP7 DKD neurons. MK-801 was significantly less effective in blocking NMDAR activity in vti1a/VAMP7 DKD neurons compared with control (control: n=11 recordings from three independent cultures; vti1a/VAMP7 DKD: n=9 recordings from three independent cultures; P=0.01). (d) Average basal NMDAR-mEPSC event amplitudes were unchanged in vti1a/VAMP7 DKD neurons compared with control neurons from data analysed in c (P=0.97).
Figure 3
Figure 3. Vti1a and VAMP7 loss elicits scaling of unitary event amplitudes without changes in excitatory network activity.
(a) Representative traces showing background network activity recordings from control and vti1a/VAMP7 DKD neurons cultured from rat hippocampus. (b) No differences were seen in average total charge transfer between control and vti1a/VAMP7 DKD neurons from 3 min of recording (control: n=9 neurons from three independent cultures; vti1a/VAMP7 DKD: n=10 neurons from three independent cultures; P=0.55). (c) No differences were seen in average burst number between control and vti1a/VAMP7 DKD neurons during background network activity analysed in b (P=0.82). (d) Average AMPA-mEPSC amplitudes from vti1a/VAMP7 DKD neurons were significantly increased compared with control neurons from recordings analysed in Fig. 1d (P=0.0005). (e) Cumulative probability histograms of AMPA-mEPSC amplitudes from recordings analysed in Fig. 1d (Kolmogorov–Smirnov test; P=0.0001). (f) Rank-order plot of AMPA-mEPSC amplitudes from recordings analysed in Fig. 1d. The slopes of the linear fits indicate a multiplicative increase (70% scaling) in vti1a/VAMP7 DKD neurons. (g) Representative traces showing evoked asynchronous unitary EPSC recordings in the presence of Sr2+ and absence of Ca2+ in control and vti1a/VAMP7 DKD neurons. The top scale refers to the evoked bulk events and the bottom scale refers to the enlarged insets showing asynchronous unitary EPSCs. (h) Rank-order plot of asynchronous evoked unitary AMPA-EPSC amplitudes from control and vti1a/VAMP7 DKD neurons (control: n=5 recordings from three independent cultures; vti1a/VAMP7 DKD: n=4 recordings from two independent cultures). The slopes of the linear fits of the two curves indicate a multiplicative increase (64% scaling) of unitary event amplitudes in vti1a/VAMP7 DKD neurons compared with control neurons.
Figure 4
Figure 4. Synaptic scaling of AMPA-mEPSC amplitudes requires eEF2 kinase.
(a) Representative immunoblots showing total eEF2, phospho-eEF2 and loading control (GDI) levels in neuronal protein samples collected from WT and eEF2K KO sibling littermate neurons with or without vti1a/VAMP7 DKD. The break between genotypes represents the removal of irrelevant lanes from the full western blot image. (b) Quantitation of phospho-eEF2 levels compared with total eEF2 levels after normalization to the loading control (n=4 independent cultures). Vti1a/VAMP7 DKD decreased phospho-eEF2 levels in WT neurons (corrected P<0.05) while no phospho-eEF2 is observed in eEF2K KO neurons, as expected. (c) Representative traces of AMPA-mEPSC recordings in control or vti1a/VAMP7 DKD neurons from WT littermate or eEF2K KO mouse cultures. (d) Cumulative probability histograms of AMPA-mEPSC inter-event intervals (WT: n=12 neurons from three independent cultures; WT+vti1a/VAMP7 DKD: n=6 neurons from three independent cultures; eEF2K KO: n=13 neurons from three independent cultures; eEF2K KO+vti1a/VAMP7 DKD: n=14 neurons from four independent cultures). Vti1a/VAMP7 DKD significantly decreased the number of high-frequency AMPA-mEPSC events in both eEF2K WT and eEF2K KO neurons (Kolmogorov–Smirnov test; corrected P<0.001, WT versus WT+vti1a/VAMP7 DKD; corrected P<0.001, eEF2K KO versus eEF2K KO+vti1a/VAMP7 DKD). (e) Average AMPA-mEPSC amplitudes from data analysed in d. A significant increase in AMPA-mEPSC amplitude was seen in WT neurons with vti1a/VAMP7 DKD but not in eEF2K KO neurons (WT versus WT+vti1a/VAMP7 DKD, corrected P<0.05; eEF2K KO versus eEF2K KO+vti1a/VAMP7 DKD, corrected P>0.05).
Figure 5
Figure 5. Postsynaptic loss of vti1a and VAMP7 is insufficient to elicit synaptic scaling of excitatory unitary event amplitudes.
(a) Representative image of a GFP-positive neuron expressing shRNA constructs against vti1a and VAMP7 overlaid by a brightfield image showing many neighbouring GFP-negative (non-transfected control) neurons. Scale bar, 30 μm. (b) Diagram of experimental design to test the potential postsynaptic effects of vti1a/VAMP7 DKD in rat hippocampal cultures. AMPA-mEPSC recordings were made from both GFP-negative, control neurons and GFP-positive, vti1a/VAMP7 DKD-transfected neurons that receive predominantly control presynaptic inputs due to very low transfection efficiency. (c) Representative AMPA-mEPSC recordings from non-transfected (control) and vti1a/VAMP7 DKD-transfected neurons. (d) AMPA-mEPSC amplitudes did not differ between non-transfected and vti1a/VAMP7 DKD-transfected postsynaptic neurons (non-transfected: n=10 recordings from three independent cultures; vti1a/VAMP7 DKD-transfected: n=11 recordings from three independent cultures; P=0.56).
Figure 6
Figure 6. Vti1a and VAMP7 loss in hippocampal area CA1 is insufficient to alter neurotransmission in Schaffer collateral synapses.
(a) Diagram of the experimental design to test the effects of vti1a/VAMP7 DKD in area CA1 of mouse hippocampus. In vivo viral delivery to area CA1 of shRNA constructs against vti1a and VAMP7 with a GFP marker was followed by acute slice preparation and field potential electrophysiology of the Schaffer collateral synaptic pathway. Dotted line represents removal of area CA3 before recording. DG, dentate gyrus. (b) Left: composite image at 10 × magnification of GFP expression in a hippocampal slice made 3 weeks after injection of vti1a/VAMP7 DKD virus into area CA1. Scale bar, 500 μm. Right: 40 × magnification of areas indicated by the white boxes. Scale bar, 100 μm. (c) Input–output responses were not altered by vti1a/VAMP7 DKD (control: n=10 slices from 7 mice; vti1a/VAMP7 DKD: n=12 slices from 10 mice; control slope versus vti1a/VAMP7 DKD slope, P=0.99). Inset: representative trace showing that the initial slope of the excitatory postsynaptic potential (EPSP) is measured against the amplitude of the presynaptic fibre volley. Scale is 0.3 mV by 2 ms. (d) Paired-pulse facilitation was not significantly different at 20, 30, 50, 100, 200, 400 or 500 ms inter-stimulus intervals after vti1a/VAMP7 DKD (control: n=14 slices from 7 mice; vti1a/VAMP7 DKD: n=18 slices from 11 mice; corrected P>0.05 for all inter-stimulus intervals). Inset: representative traces showing responses at the various inter-stimulus intervals. Scale is 0.5 mV by 100 ms. (e) Ketamine-induced synaptic potentiation was not altered by vti1a/VAMP7 DKD (control: n=10 slices from 7 mice; vti1a/VAMP7 DKD: n=6 slices from 6 mice; P=0.77). Field potential responses are normalized to the average baseline slope. Solid horizontal lines indicate application of 20 μM ketamine and then ACSF wash. Inset: representative traces from before (solid line) and after (dashed line) ketamine treatment. Scales are 0.2 mV (control) and 0.3 mV (vti1a/VAMP7 DKD) by 2 ms.
Figure 7
Figure 7. Presynaptic loss of vti1a and VAMP7 impairs NMDA receptor block-induced synaptic plasticity in Schaffer collateral synapses.
(a) Diagram of the experimental design to test the effects of vti1a/VAMP7 DKD in axons of mouse hippocampus. In vivo viral delivery to area CA3 of shRNA constructs against vti1a and VAMP7 with a GFP marker was followed by acute slice preparation and field potential electrophysiology of the Schaffer collateral synaptic pathway in CA1. Dotted line represents removal of area CA3 before recording. DG, dentate gyrus. (b) Composite image at 10 × magnification of GFP expression in a hippocampal slice made 3 weeks after injection of vti1a/VAMP7 DKD virus into area CA3. Scale bar, 500 μm. Top inset: 63 × magnification of the boxed region in the left image. GFP-positive Schaffer collateral axons can be observed. Bottom inset: 4 × optical zoom of the boxed region in the top inset. (c) Input–output responses were not altered by presynaptic vti1a/VAMP7 DKD (control: n=25 slices from 17 mice; vti1a/VAMP7 DKD: n=27 slices from 18 mice; control slope versus vti1a/VAMP7 DKD slope, P=0.76). Inset: representative trace showing that the initial response slope is measured against the amplitude of the presynaptic fibre volley. Scale is 0.4 mV by 2 ms. (d) Paired-pulse facilitation was not significantly different at 20, 30, 50, 100, 200, 400 or 500 ms inter-stimulus intervals after vti1a/VAMP7 DKD (control: n=37 slices from 21 mice; vti1a/VAMP7 DKD: n=36 slices from 20 mice; corrected P>0.05 for all inter-stimulus intervals). Inset: representative traces showing responses at the various inter-stimulus intervals. Scale is 0.5 mV by 100 ms. (e) Ketamine-induced synaptic potentiation was reduced by presynaptic vti1a/VAMP7 DKD (control: n=25 slices from 17 mice; vti1a/VAMP7 DKD: n=21 slices from 14 mice; P=0.019). Solid horizontal lines indicate application of 20 μM ketamine and then ACSF wash. Inset: representative traces from before (solid line) and after (dashed line) ketamine treatment. Scales are 0.3 mV (control) and 0.2 mV (vti1a/VAMP7 DKD) by 2 ms. (f) Long-term potentiation (LTP) was not altered by presynaptic vti1a/VAMP7 DKD (control: n=11 slices from seven mice; vti1a/VAMP7 DKD: n=12 slices from eight mice; P=0.69). Arrow indicates when theta burst stimulation (TBS) was applied to Schaffer collateral axons. Inset: representative traces showing increased response (dashed line) after LTP induction. Scales are 0.3 mV (control) and 0.2 mV (vti1a/VAMP7 DKD) by 4 ms.

References

    1. Cannon W. B. & Rosenblueth A. The Supersensitivity of Denervated Structures: A Law of Denervation The Macmillan Company (1949).
    1. Turrigiano G. G., Leslie K. R., Desai N. S., Rutherford L. C. & Nelson S. B. Activity-dependent scaling of quantal amplitude in neocortical neurons. Nature 391, 892–896 (1998). - PubMed
    1. Nosyreva E. et al.. Acute suppression of spontaneous neurotransmission drives synaptic potentiation. J. Neurosci. 33, 6990–7002 (2013). - PMC - PubMed
    1. Sutton M. A. et al.. Miniature neurotransmission stabilizes synaptic function via tonic suppression of local dendritic protein synthesis. Cell 125, 785–799 (2006). - PubMed
    1. Aoto J., Nam C. I., Poon M. M., Ting P. & Chen L. Synaptic signaling by all-trans retinoic acid in homeostatic synaptic plasticity. Neuron 60, 308–320 (2008). - PMC - PubMed

Publication types

LinkOut - more resources