. 2017 Feb 10:7:42258.
doi: 10.1038/srep42258.

Functionalized Graphene Oxide with Chitosan for Protein Nanocarriers to Protect against Enzymatic Cleavage and Retain Collagenase Activity

Affiliations

Functionalized Graphene Oxide with Chitosan for Protein Nanocarriers to Protect against Enzymatic Cleavage and Retain Collagenase Activity

Fatemeh Emadi et al. Sci Rep. .

Abstract

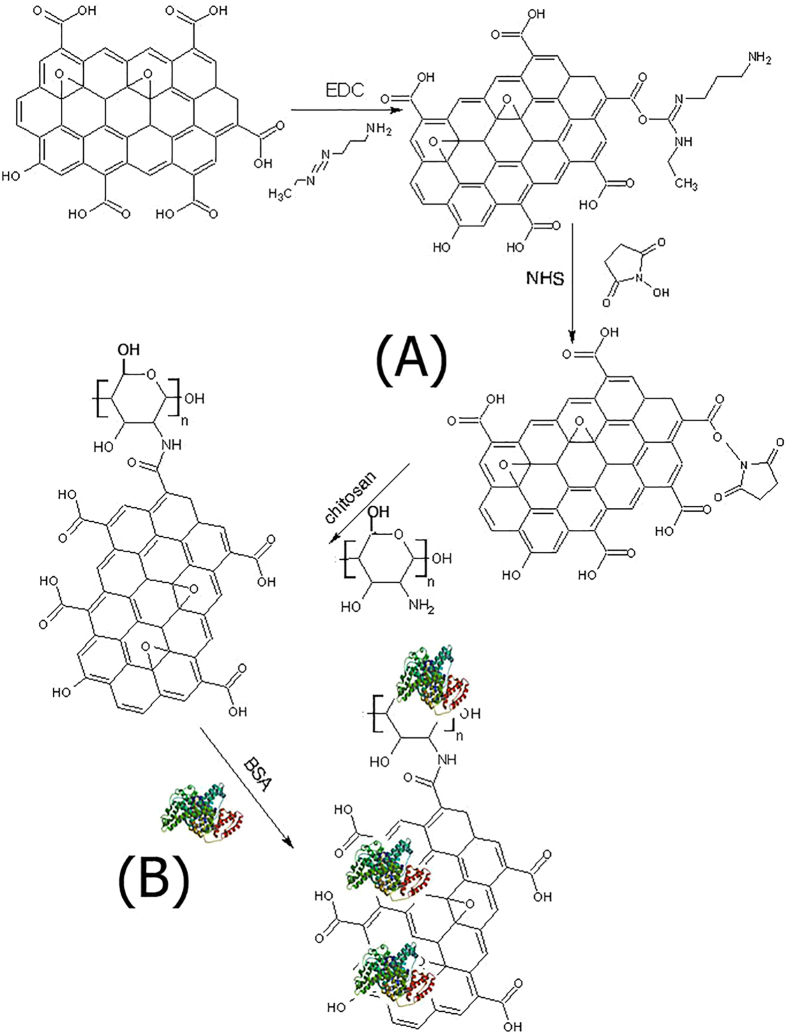
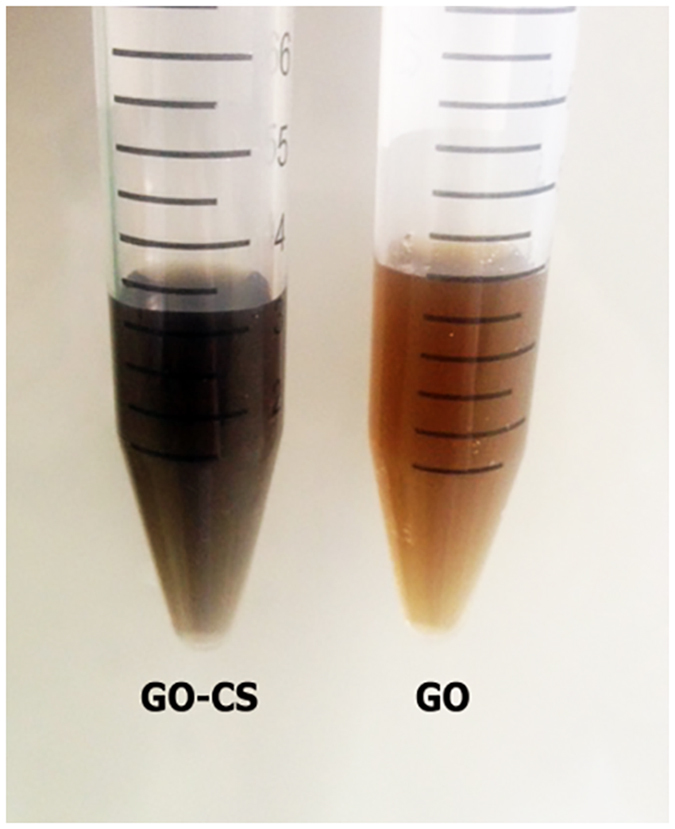
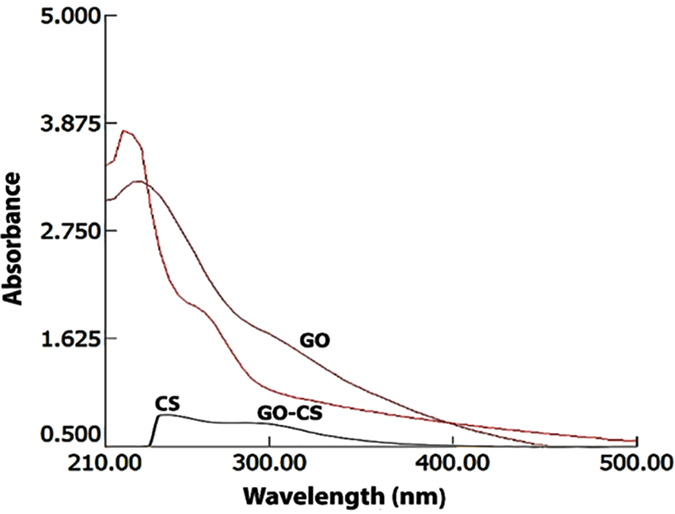
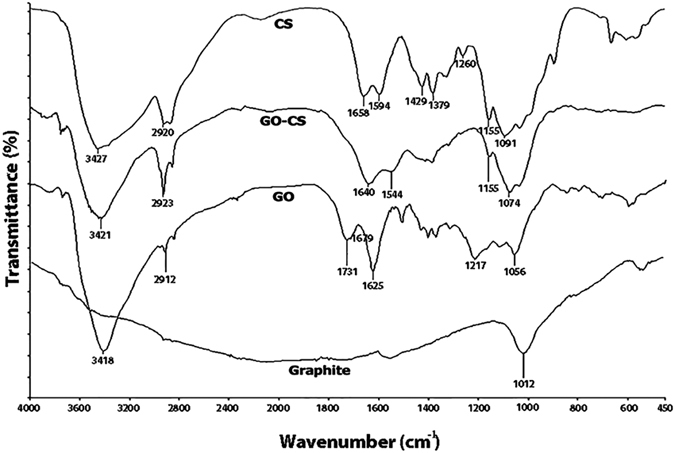
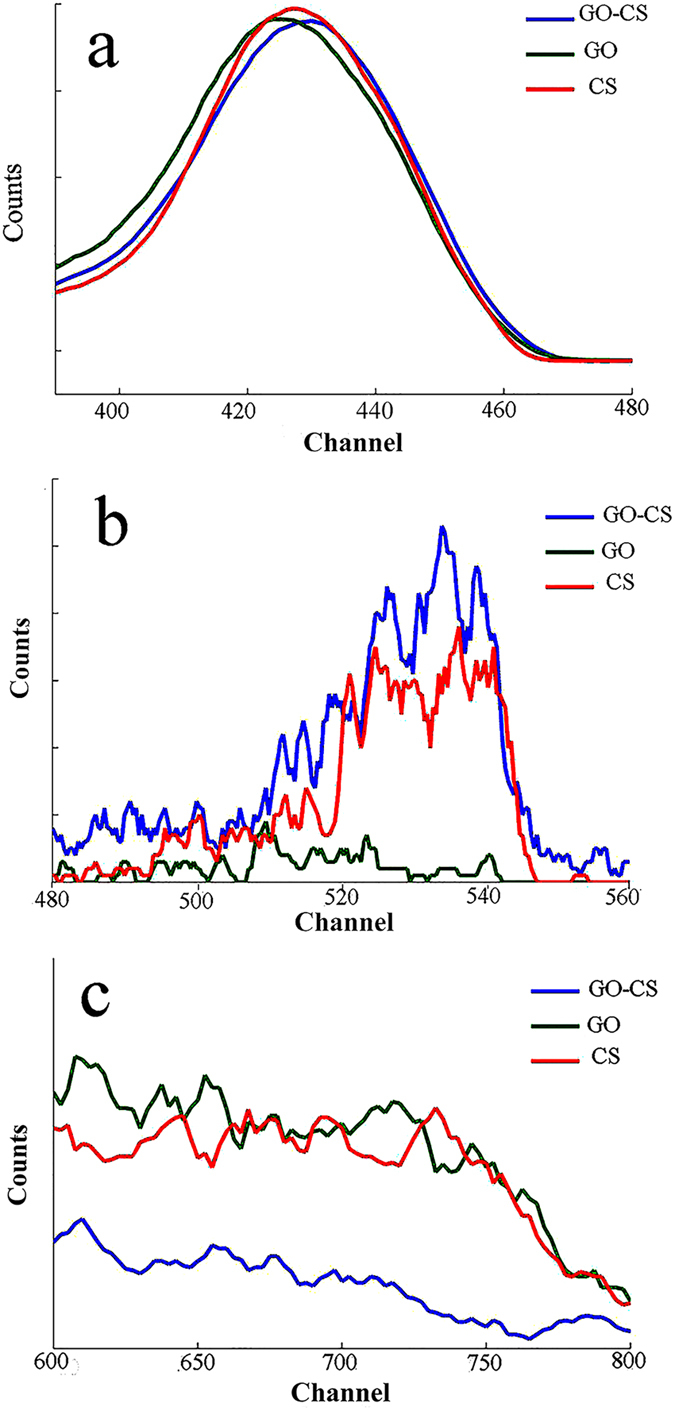
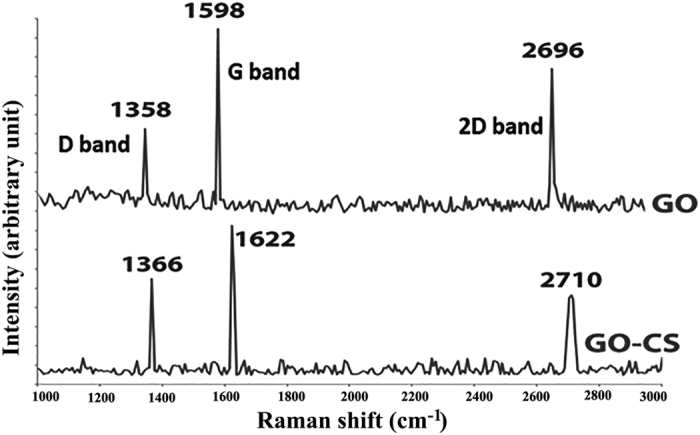
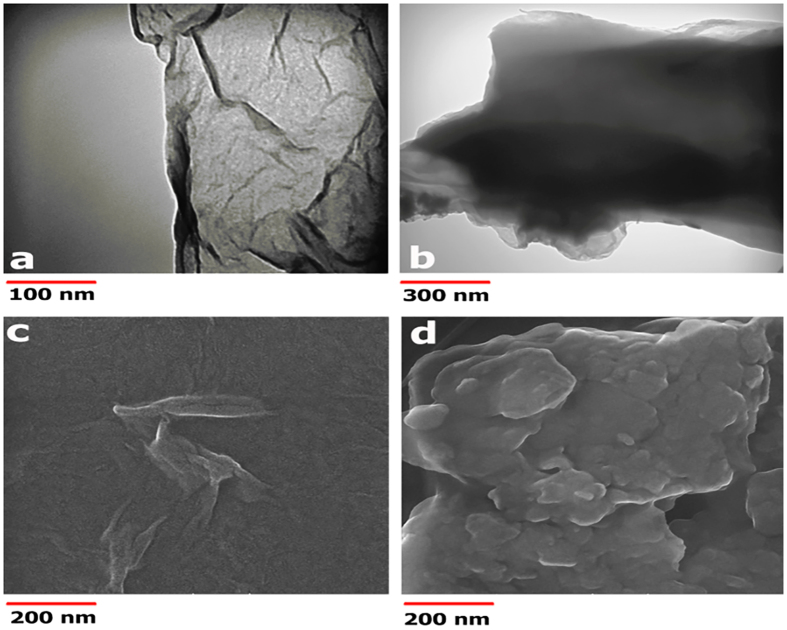
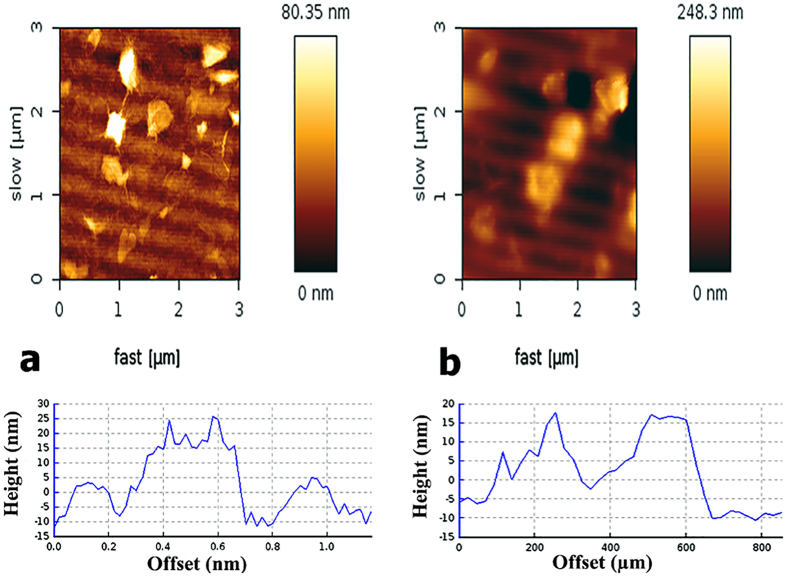
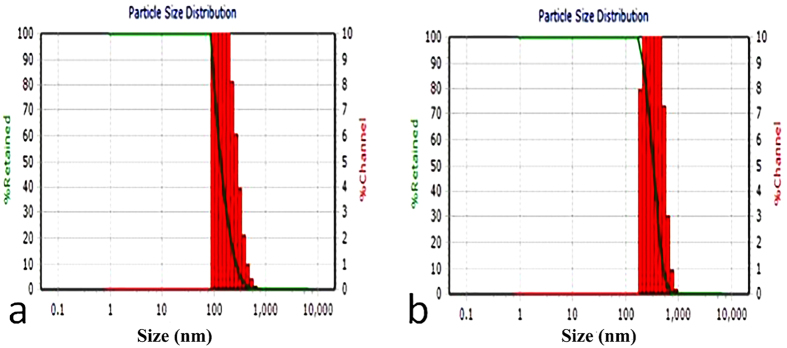
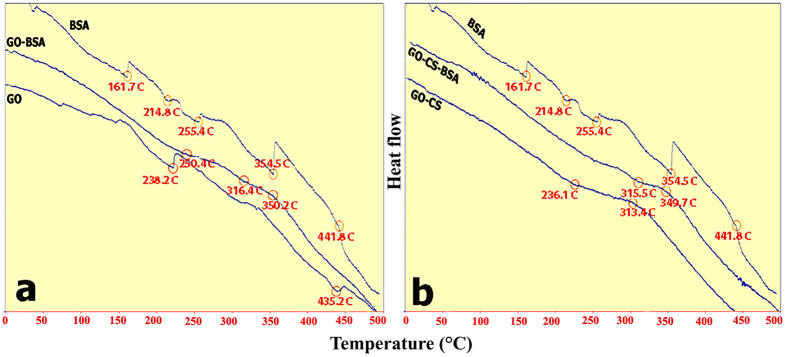
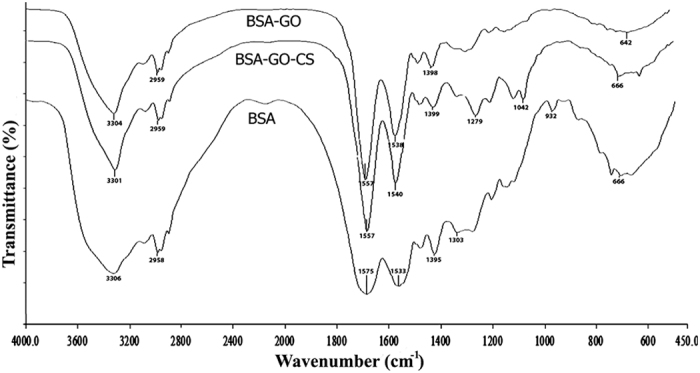
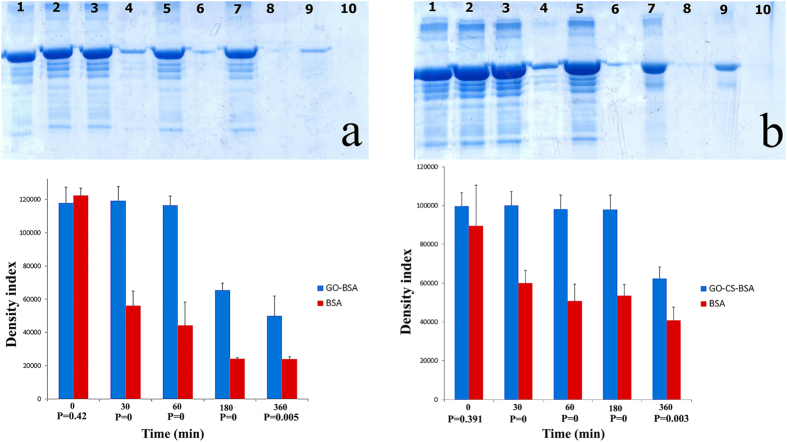
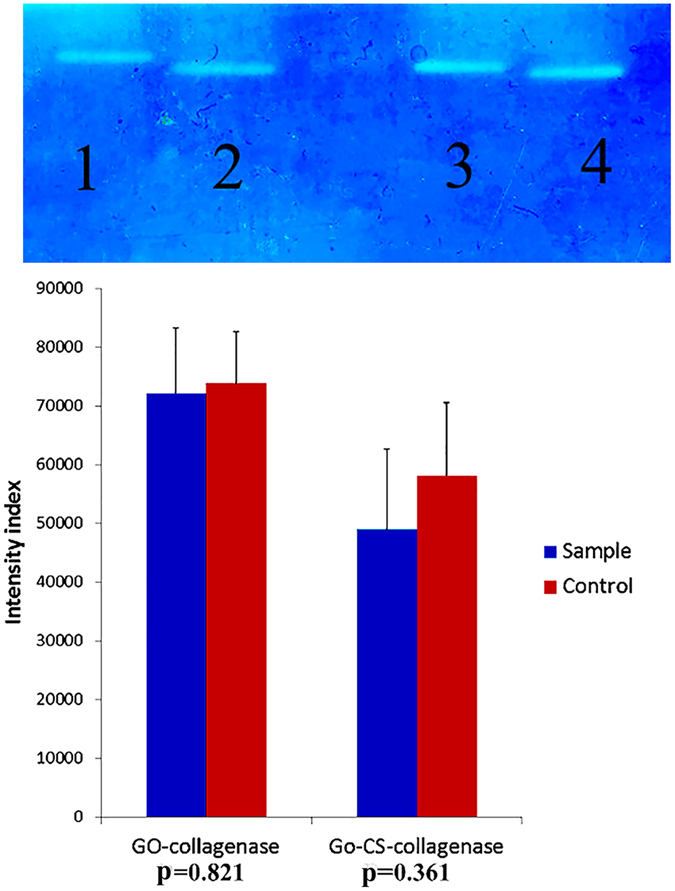
Proteins have short half-life because of enzymatic cleavage. Here, a new protein nanocarrier made of graphene oxide (GO) + Chitosan (CS) is proposed to successfully prevent proteolysis in protein and simultaneously retain its activity. Bovine serum albumin (BSA) and collagenase were loaded on GO and GO-CS to explore the stability and activity of proteins. SEM, AFM, TEM, DSC, UV-Vis, FT-IR, RBS, Raman, SDS-PAGE and zymography were utilized as characterization techniques. The protecting role of GO and GO-CS against enzymatic cleavage was probed by protease digestion analysis on BSA, where the protease solution was introduced to GO-BSA and GO-CS-BSA at 37 °C for 0.5-1-3-6 hours. Characterizations showed the successful synthesis of few layers of GO and the coverage by CS. According to gelatin zymographic analysis, the loaded collagenase on GO and GO-CS lysed the gelatin and created non-staining bands which confirmed the activity of loaded collagenase. SDS-PAGE analysis revealed no significant change in the intact protein in the GO-BSA and GO-CS-BSA solution after 30-minute and 1-hour exposure to protease; however, free BSA was completely digested after 1 hour. After 6 hours, intact proteins were detected in GO-BSA and GO-CS-BSA solutions, while no intact protein was detected in the free BSA solution.


Conflict of interest statement

The authors declare no competing financial interests.

Figures

Figure 1
Figure 1. Schematic diagram of GO-CS formation through BSA loading on GO-CS.
Figure 2
Figure 2. The appearance of GO before and after binding with CS at a concentration of 5 mg/ml.
Figure 3
Figure 3. UV-visible spectra of GO, GO-CS and CS.
The spectral range is 210–500 nm with the GO peak at 230 nm.
Figure 4
Figure 4. FTIR spectra of GO, GO-CS, graphite and chitosan for the wavelength range of 450–4000 cm−1.
The disappearance wavelength at 1731 cm−1 and new wavelength appearance at 1640 cm−1 in the GO-CS spectrum prove the attachment of GO with CS.
Figure 5
Figure 5. RBS analysis for detecting the elemental composition of GO, CS and GO-CS.
Carbon region from channel 400 to 460 (a), nitrogen region from channel 500 to 540 (b), and oxygen region from channel 600 to 750 (c).
Figure 6
Figure 6. Raman spectrum of GO and GO-CS.
2D peak in GO-CS spectrum is broadened and shifted to upper 2700 that shows changes in the GO layers by the attachment to CS. The shifts in D, G and 2D bands and the change in intensity ratio of D/G revealed that GO was successfully functionalized by CS.
Figure 7
Figure 7
TEM images, on formvar-carbon coated copper grids of: (a) GO with a wrinkled surface and thin sheet-like structure, and (b) denser and thicker GO-CS. The scale bars are 100 nm for GO and 300 nm for GO-CS. SEM images of: (c) GO with a smooth surface, and (d) GO-CS with a rough surface. The scale bar represents 200 nm for the view field of 1.38 μm.
Figure 8
Figure 8
Contact mode AFM images and height profile of: (a) GO with sharp edges and flat surfaces; the thickness range is 0.6–10 nm, and (b) GO-CS with coarse edges and protrusions on its surface; the thickness range is 10–25 nm.
Figure 9
Figure 9
DLS analysis of (a) GO with an average size 150 nm, and (b) GO-CS with an average size of 350 nm.
Figure 10
Figure 10. DCS spectra of GO, GO-CS, BSA, GO-BSA, and GO-CS-BSA at a heating rate of 10 °C min−1 from 40 to 500 °C.
Figure 11
Figure 11. FTIR analysis of BSA before and after loading on GO and GO-CS.
The peak of oxygen-containing groups of GO was disappeared after loading of BSA on GO.
Figure 12
Figure 12
Statistical data and p-values of: (a) SDS analysis of GO-BSA, free BSA (as control) before adding trypsin (bands 1, 2), GO-BSA and free BSA 30 minutes after adding trypsin (bands 3, 4), 1 hour (bands 5, 6), 3 hours (bands 7, 8), and 6 hours (bands 9, 10); (b) SDS analysis of GO-CS-BSA, free BSA (as control) before adding trypsin (bands 1, 2), GO-CS-BSA and free BSA 30 minutes after adding trypsin (bands 3, 4), 1 hour (bands 5, 6), 3 hours (bands 7, 8), and 6 hours (bands 9, 10).
Figure 13
Figure 13. Statistical data and p-values of zymographic analysis: (bands 1, 2) for GO-collagenase, free collagenase (as control); (bands 3, 4) for GO-CS-collagenase and free collagenase (as control).

References

    1. Alonso-Sande M., Csaba N. S. & Alonso M. J. New perspectives in oral peptide and protein delivery: from nanocarrier design to in vivo effectiveness. New perspectives, 46–64 (2016).
    1. Mitragotri S., Burke P. A. & Langer R. Overcoming the challenges in administering biopharmaceuticals: formulation and delivery strategies. Nature reviews Drug discovery 13, 655–672 (2014). - PMC - PubMed
    1. Gupta S. et al. Oral delivery of therapeutic proteins and peptides: a review on recent developments. Drug delivery 20, 237–246 (2013). - PubMed
    1. Moroz E., Matoori S. & Leroux J.-C. Oral delivery of macromolecular drugs: Where we are after almost 100 years of attempts. Advanced drug delivery reviews 101, 108–121 (2016). - PubMed
    1. Leader B., Baca Q. J. & Golan D. E. Protein therapeutics: a summary and pharmacological classification. Nature Reviews Drug Discovery 7, 21–39 (2008). - PubMed

Publication types