. 2017 Feb 10:7:42201.
doi: 10.1038/srep42201.

Detailed Vascular Anatomy of the Human Retina by Projection-Resolved Optical Coherence Tomography Angiography

Affiliations

Detailed Vascular Anatomy of the Human Retina by Projection-Resolved Optical Coherence Tomography Angiography

J P Campbell et al. Sci Rep. .

Abstract

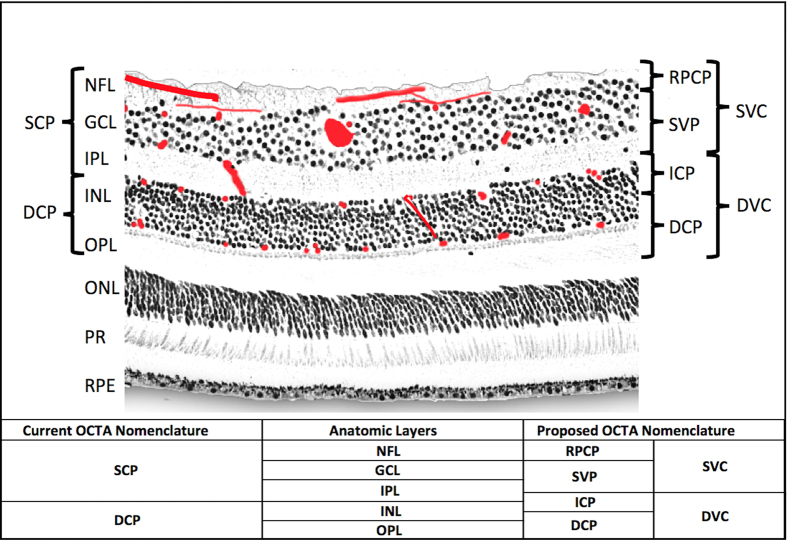
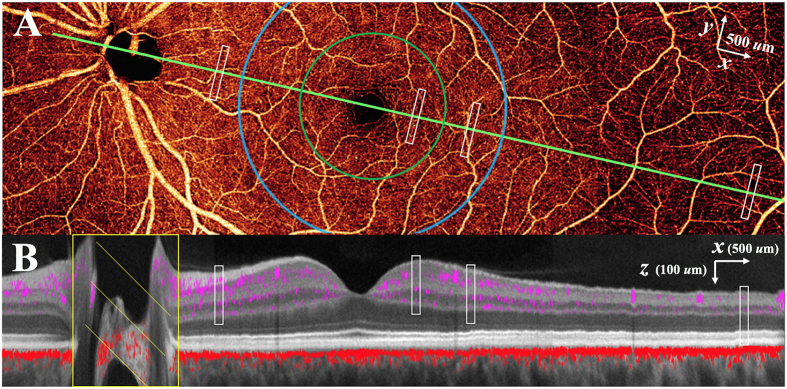
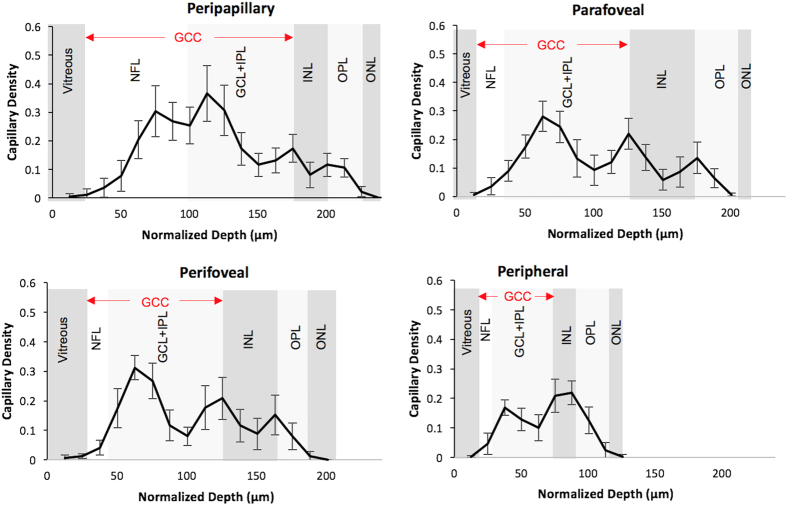
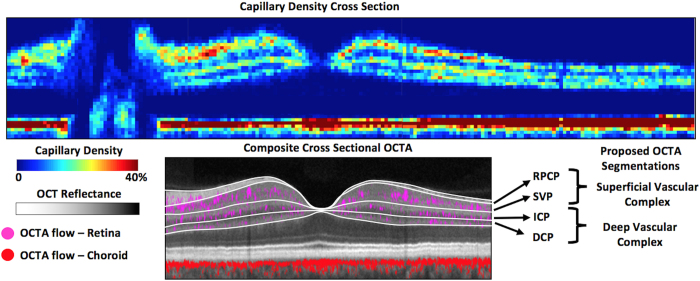
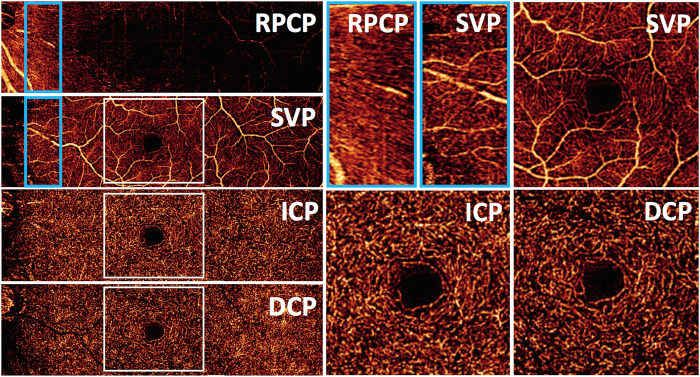
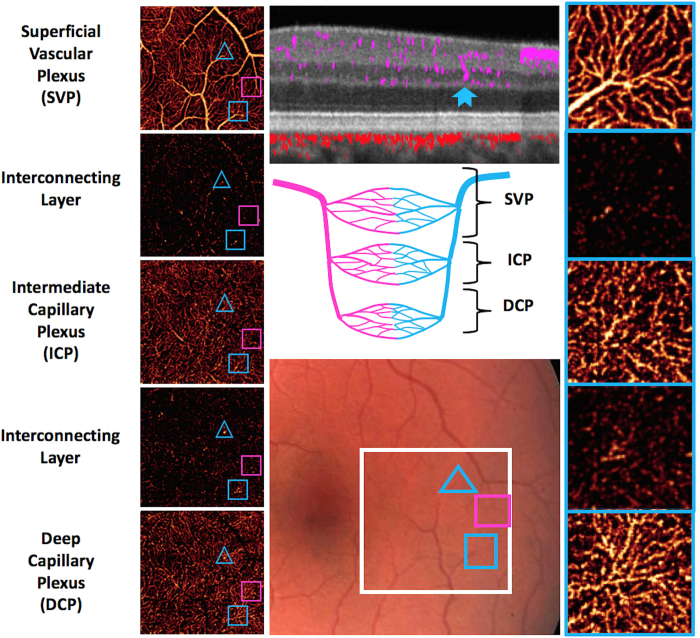
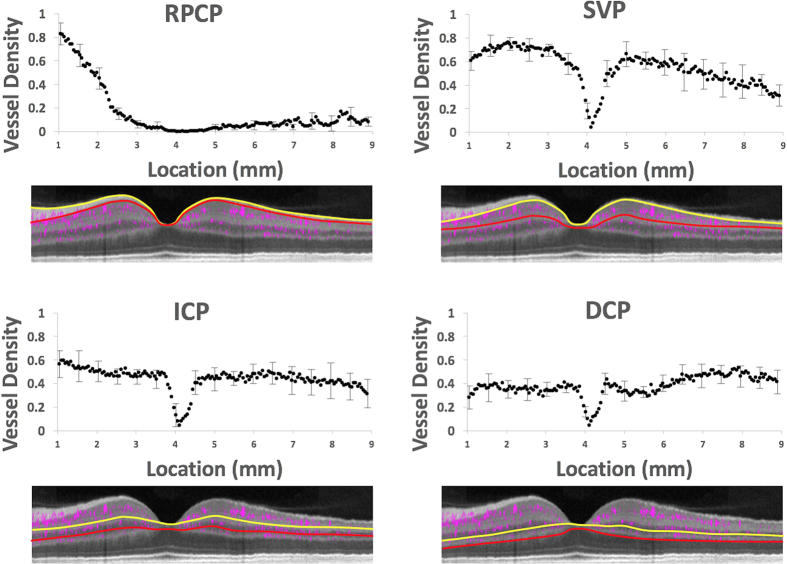
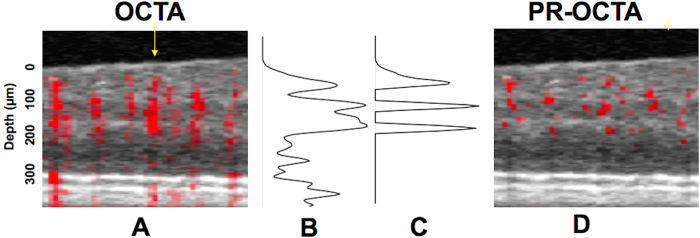
Optical coherence tomography angiography (OCTA) is a noninvasive method of 3D imaging of the retinal and choroidal circulations. However, vascular depth discrimination is limited by superficial vessels projecting flow signal artifact onto deeper layers. The projection-resolved (PR) OCTA algorithm improves depth resolution by removing projection artifact while retaining in-situ flow signal from real blood vessels in deeper layers. This novel technology allowed us to study the normal retinal vasculature in vivo with better depth resolution than previously possible. Our investigation in normal human volunteers revealed the presence of 2 to 4 distinct vascular plexuses in the retina, depending on location relative to the optic disc and fovea. The vascular pattern in these retinal plexuses and interconnecting layers are consistent with previous histologic studies. Based on these data, we propose an improved system of nomenclature and segmentation boundaries for detailed 3-dimensional retinal vascular anatomy by OCTA. This could serve as a basis for future investigation of both normal retinal anatomy, as well as vascular malformations, nonperfusion, and neovascularization.


Conflict of interest statement

Oregon Health & Science University (OHSU), Yali Jia, and David Huang have a significant financial interest in Optovue, Inc., a company that may have a commercial interest in the results of this research and technology. These potential conflicts of interest have been reviewed and managed by OHSU. David Huang receives patent royalties from Carl Zeiss Meditec, Inc. Other authors do not have financial interest in the subject of this article.

Figures

Figure 1
Figure 1. Anatomic localization of vascular plexuses in the human retina in the macula, and current and proposed optical coherence tomography angiography segmentation boundaries.
An illustration of the retinal vascular plexuses in red (labeled on right) hand drawn on top of a histological section of the human retina showing anatomic layers (labeled on left) from spectral domain optical coherence tomography. The four vascular plexuses can be grouped into superficial and deep vascular complexes (SVC and DVC, as shown on right) for routine segmentation, but ought to reflect the anatomic location of the ICP at the IPL/INL interface, which the current OCTA segmentations use as a border between superficial and deep plexuses (labeled on left as SCP and DCP). Current and proposed vascular nomenclature and OCTA segmentations are shown at the bottom. (NFL = nerve fiber layer, GCL = ganglion cell layer, IPL = inner plexiform layer, INL = inner nuclear layer, OPL = outer plexiform layer plus Henle’s fiber layer, ONL = outer nuclear layer, PR = photoreceptor layers, RPE = retinal pigment epithelium, OCTA = optical coherence tomography angiography, RPCP = radial peripapillary capillary plexus, SVP = superficial vascular plexus, ICP = intermediate capillary plexus, DCP = deep capillary plexus).
Figure 2
Figure 2. Projection-resolved optical coherence tomography angiography (PR-OCTA) in the left eye of a normal study participant.
Four 4.5 × 4.5 mm OCTA volumes were montaged. (A) 14.2 × 4.5 mm en face OCTA of the inner retina. The cross-sectional image (B) is taken along the maculopapillary axis (green line joining the centers of the fovea and optic disc). (B) Color-composite cross-sectional OCTA (14.2 × 0.7 mm) showing retinal (purple) and choroidal (red) blood flow superimposed on gray scale reflectance image of static structures. The white rectangles in (A) and (B) represent the 0.1 × 0.8 × 0.25 mm (x × y × z) sampling regions at locations in the peripapillary, parafoveal (green circle), perifoveal (blue circle), and peripheral (7 mm temporal to fovea) retina for capillary density measurements.
Figure 3
Figure 3. Retinal capillary density as a function of normalized depth and structural optical coherence tomography layers.
Depth-resolved capillary density profiles are measured in representative areas (Fig. 2) in 4 anatomic regions. Population average and standard deviation capillary density measurements from the 9 normal human participants are shown. In all regions, a capillary density peak in GCL corresponds to superficial vascular plexus. In the peripapillary region, a peak within NFL corresponds to the radial peripapillary capillary plexus. In all regions except peripherally, a peak at inner border of INL corresponds to the intermediate capillary plexus (ICP) and a peak at outer border of INL corresponds to the deep capillary plexus (DCP). Peripherally, the ICP and DCP coalesce into one peak. The x dimension depth scale (corresponding to the z scale in Fig. 2) represents normalized depth with each labeled OCT structural layer normalized to the reference subject (shown in Fig. 2), minimizing the variability in this dimension but maintaining the anatomic relationship with structural OCT layers. (OCT = optical coherence tomography, NFL = nerve fiber layer, GCL = ganglion cell layer, IPL = inner plexiform layer, GCC = ganglion cell complex, INL = inner nuclear layer, OPL = outer plexiform layer plus Henle’s fiber layer, ONL = outer nuclear layer).
Figure 4
Figure 4. Cross-sectional capillary density map in the retina of a normal human participant, and proposed segmentation boundaries.
The top 14.2 mm (x) by 0.7 mm (z) image was obtained by montaging four 4.5 × 4.5 mm PR-OCTA volumes and selecting a cross-sectional slab along the maculopapillary axis (Fig. 2). The capillary density is measured within super-voxels of 0.1 × 0.8 × 0.01 mm (x × y × z). Three layers of concentrated capillary density could be seen in the retina (top layers of upper image): superior vascular complex, intermediate capillary plexus, and deep capillary plexus. One layer of high capillary density is seen in the choriocapillaris (bottom layer). Proposed segmentation boundaries are showen in lower image (white lines) with corresponding structural OCT layers. (OCT = optical coherence tomography, RPCP = radial peripapillary capillary plexus, SVP = superficial vascular plexus, ICP = intermediate capillary plexus, DCP = deep capillary plexus, GCC = ganglion cell complex, OPL = outer plexiform layer, RPE = retinal pigment epithelium).
Figure 5
Figure 5. En face projection-resolved optical coherence tomography angiograms of four retinal vascular plexuses in the left eye of a normal human participant.
The angiograms are formed by the montage of four 2 × 2 mm scans. The radial peripapillary capillary plexus (RPCP) is found in the nerve fiber layer (NFL) slab. The superficial vascular plexus (SVP) slab was predominantly located in the ganglion cell layer (GCL), and was segmented as the inner 80% of the ganglion cell complex (GCC, defined as the NFL + GCL + inner plexiform layer [IPL]), excluding the NFL. The intermediate capillary plexus (ICP) was segmented between the outer 20% of the GCC to the inner 50% of the inner nuclear layer (INL). The deep capillary plexus was segmented between the outer 50% of the INL and the outer plexiform layer (OPL). High magnification images of the peripapillary RPCP, and parafoveal vascular networks of the SVP, ICP, and DCP are presented at the right, from corresponding sections indicated with white squares.
Figure 6
Figure 6. Retinal vascular plexuses and interconnecting layers in the macula.
Color fundus photograph (middle bottom panel) demonstrates the 2 × 2 mm region of scan (white square). The en face PR-OCTA (left panels) are arrayed from the most superficial on top to the deepest at the bottom. The blue hollow triangles enclose a diving venule (identified on color fundus photograph) that can be seen in the cross-sectional PR-OCT (middle top panel) traversing from the SVP to the DCP (solid blue notched arrow). The hollow pink squares enclose a diving arteriole that can be seen in the SVP, ICP, DCP, and the interconnecting layer between the ICP and the DCP. The hollow blue squares enclose a diving venule that is clearly seen in all magnified en face PR-OCTA slabs (right panels). This venule gives rise to a radiating network of capillaries in all 3 plexuses. The cartoon (center panel) depicts the anatomical relationships between arterial and venous systems in the three vascular plexuses and the interconnecting layers.
Figure 7
Figure 7. Transverse vessel density profiles in the 4 retinal vascular plexuses.
Vessel density was calculated in en face projections of the plexuses along a 0.7 mm wide (y, perpendicular to image plane) swath, sampled every 0.05 mm (x) along the maculopapillary axis (Fig. 2). The locations are measured by distance from the edge of the optic disc. The yellow and red lines represent the superficial (yellow) and deep (red) segmentation boundaries for vessel density measurements for each plexus, which were averaged from 9 normal human participants and error bars representing standard deviation is shown every 10th point. The x axis scale was normalized to a reference image for all participants at the disc and fovea. The transverse vessel density profile includes large vessels and is based on maximum flow projection across the full thickness of the plexuses (1–24 voxel thick slabs) and therefore have higher values than the depth-resolve capillary density profile (single-voxel thick slabs) shown before. (RPCP = radial peripapillary capillary plexus, SVP = superficial vascular plexus, ICP = intermediate capillary plexus, DCP = deep capillary plexus).
Figure 8
Figure 8. Illustration of the projection-resolved (PR) optical coherence tomography angiography (OCTA) algorithm.
(A) and (D) Composite cross-sectional (B-scan) images before (A) and after (D) projection resolution. In these two images, suprathreshold decorrelation signal (red) is overlaid on the structural OCT (gray scale). The threshold distinguishes flow from background noise and is based on noise statistics. (B) Original axial profile of reflectance-normalized decorrelation signal (C) The projection resolution algorithm retains suprathreshold reflectance-normalized decorrelation signal that are higher than all voxels above (voxels classified as in situ flow in real vessels) and sets the remaining signal to zero (classified as flow projection artifacts).

References

    1. Provis J. M. Development of the primate retinal vasculature. Progress in Retinal and Eye Research 20, 799–821 (2001). - PubMed
    1. Snodderly D. M., Weinhaus R. S. & Choi J. C. Neural-vascular relationships in central retina of macaque monkeys (Macaca fascicularis). J. Neurosci. 12, 1169–1193 (1992). - PMC - PubMed
    1. Stone J., van Driel D., Valter K., Rees S. & Provis J. The locations of mitochondria in mammalian photoreceptors: relation to retinal vasculature. Brain Res. 1189, 58–69 (2008). - PubMed
    1. Henkind P. Radial peripapillary capillaries of the retina. I. Anatomy: human and comparative. British Journal of Ophthalmology 51, 115–123 (1967). - PMC - PubMed
    1. Alterman M. & Henkind P. Radial peripapillary capillaries of the retina. II. Possible role in Bjerrum scotoma. British Journal of Ophthalmology 52, 26–31 (1968). - PMC - PubMed

Publication types

MeSH terms