. 2018 Jan;38(1):136-150.
doi: 10.1177/0271678X17691986. Epub 2017 Feb 10.

Cerebral blood flow, frontal lobe oxygenation and intra-arterial blood pressure during sprint exercise in normoxia and severe acute hypoxia in humans

Affiliations

Cerebral blood flow, frontal lobe oxygenation and intra-arterial blood pressure during sprint exercise in normoxia and severe acute hypoxia in humans

David Curtelin et al. J Cereb Blood Flow Metab. 2018 Jan.

Abstract

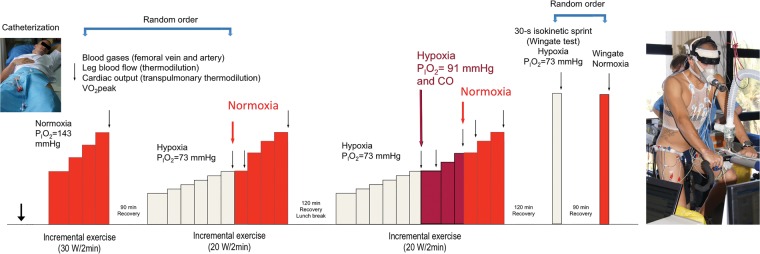
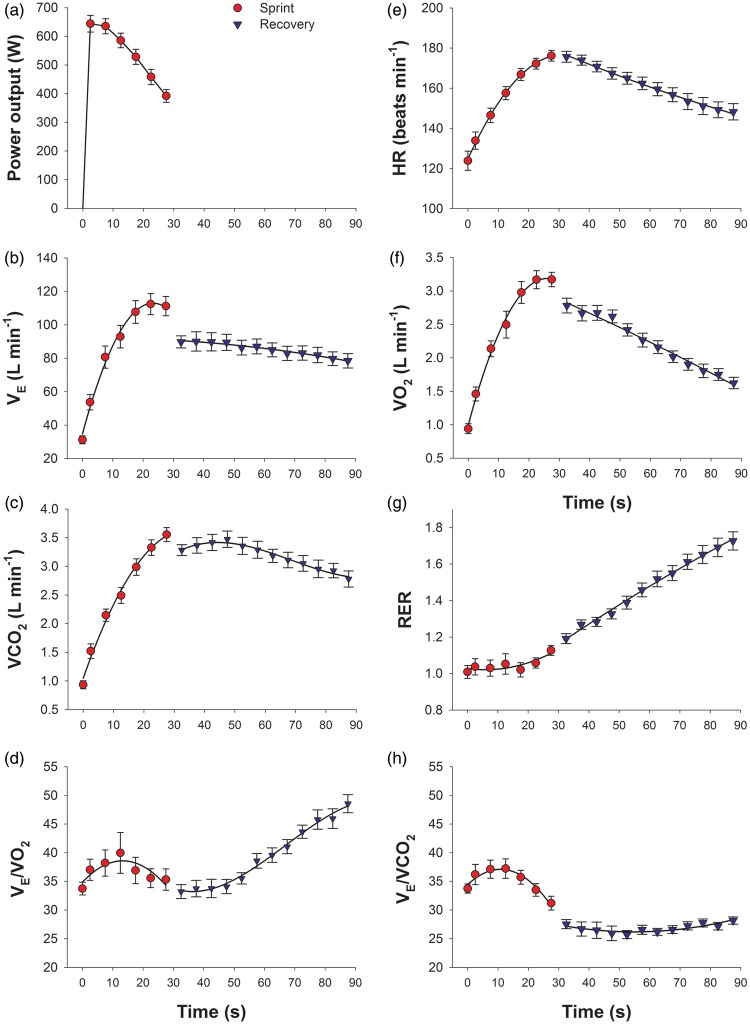
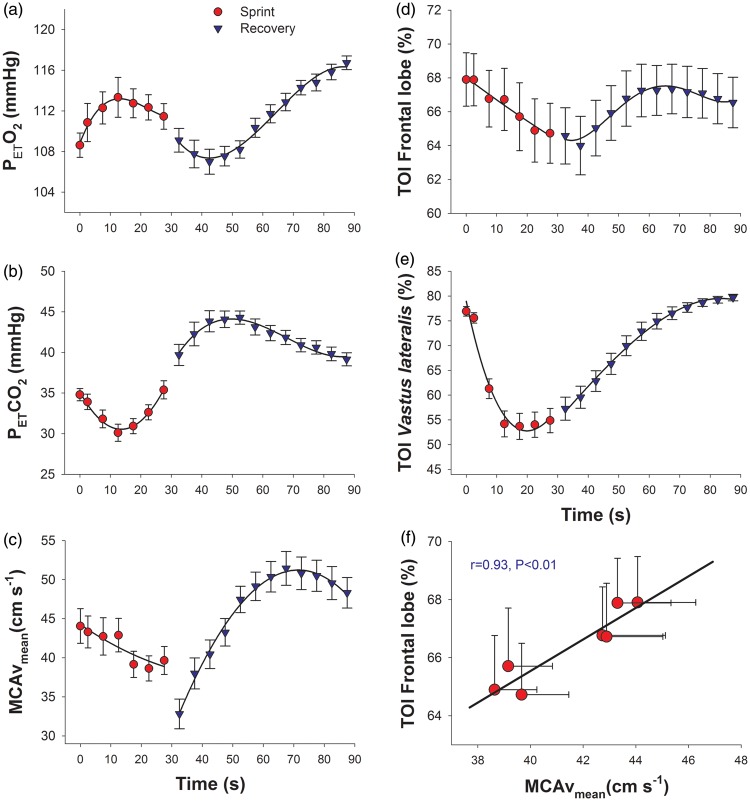
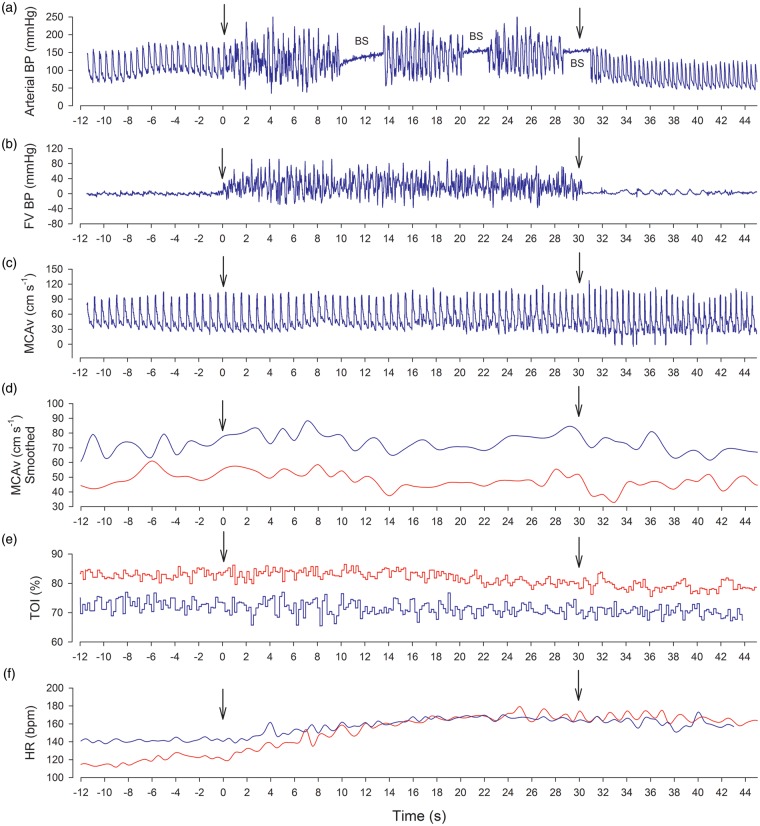
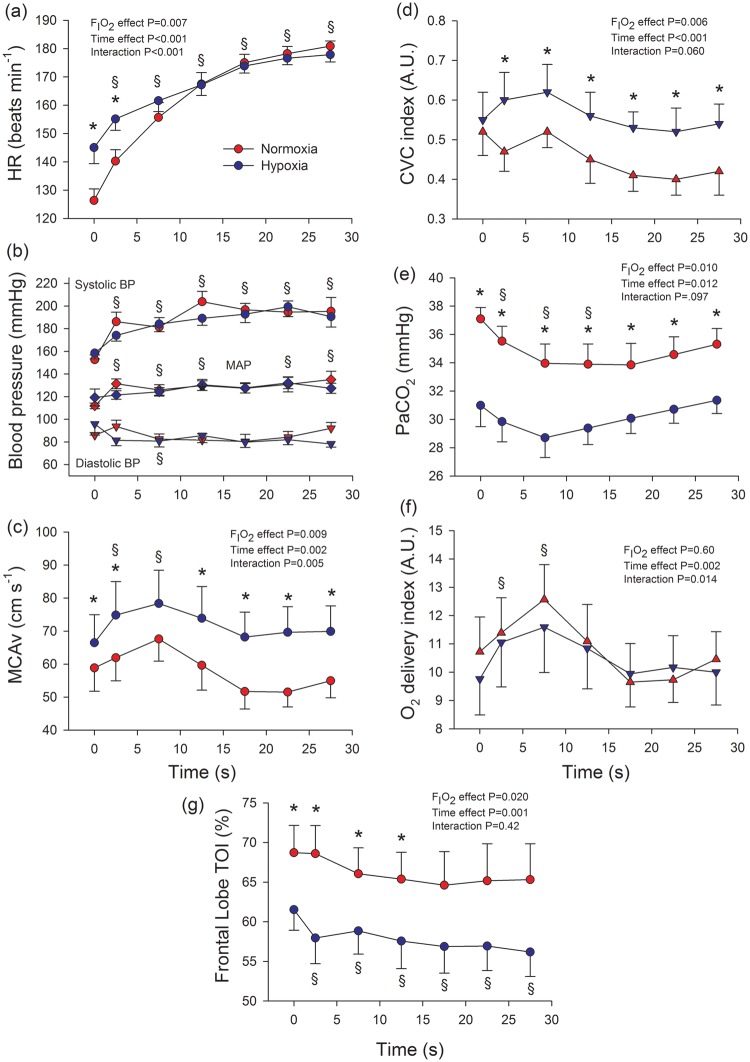
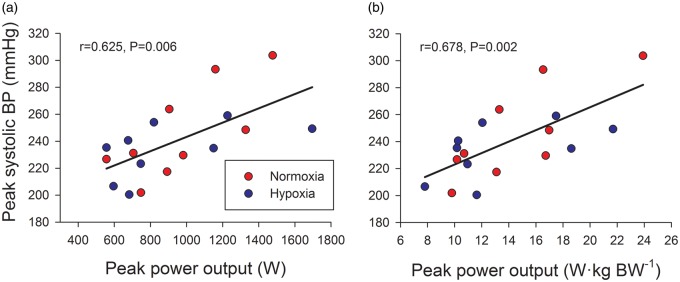
Cerebral blood flow (CBF) is regulated to secure brain O2 delivery while simultaneously avoiding hyperperfusion; however, both requisites may conflict during sprint exercise. To determine whether brain O2 delivery or CBF is prioritized, young men performed sprint exercise in normoxia and hypoxia (PIO2 = 73 mmHg). During the sprints, cardiac output increased to ∼22 L min-1, mean arterial pressure to ∼131 mmHg and peak systolic blood pressure ranged between 200 and 304 mmHg. Middle-cerebral artery velocity (MCAv) increased to peak values (∼16%) after 7.5 s and decreased to pre-exercise values towards the end of the sprint. When the sprints in normoxia were preceded by a reduced PETCO2, CBF and frontal lobe oxygenation decreased in parallel ( r = 0.93, P < 0.01). In hypoxia, MCAv was increased by 25%, due to a 26% greater vascular conductance, despite 4-6 mmHg lower PaCO2 in hypoxia than normoxia. This vasodilation fully accounted for the 22 % lower CaO2 in hypoxia, leading to a similar brain O2 delivery during the sprints regardless of PIO2. In conclusion, when a conflict exists between preserving brain O2 delivery or restraining CBF to avoid potential damage by an elevated perfusion pressure, the priority is given to brain O2 delivery.

Keywords: Exercise; cerebral blood flow; cerebral haemodynamics; high altitude; hypertension.


Figures

Figure 1.
Figure 1.
Study II experimental protocol. After femoral artery and vein catheterization, subjects performed three incremental exercise tests. The first two were applied in random order. After the third incremental exercise test, they rest for two hours: Thereafter they performed 30-s all-out isokinetic sprints in normoxia or hypoxia, followed after 90 min recovery, by another sprint in hypoxia or normoxia, depending on the assignment by randomization. On the right, a picture of one of the volunteers fully instrumented for the experiments. Subjects were instructed to maintain a vertical position during the test and to minimize the movements of the head. PIO2: inspiratory oxygen pressure; CO: carbon monoxide.
Figure 2.
Figure 2.
Ergospirometric variables during the 30 s sprint in normoxia (red circles) and the first minute of the recovery period (blue triangles) (Study I). (a) Power output; (b) pulmonary ventilation (VE); (c) carbon dioxide production (VCO2); (d) ventilatory equivalent for O2 (VE/VO2); (e) heart rate (HR); (f) oxygen consumption (VO2); (g) respiratory exchange ratio (RER); and (h) ventilatory equivalent for CO2 (VE/VCO2); the error bars represent the standard error of the mean, n = 20.
Figure 3.
Figure 3.
Respiratory variables brain blood flow and tissue oxygenation during the 30 s sprint in normoxia (red circles) and the first minute of the recovery period (blue triangles) (Study I). (a) End-tidal O2 pressure (PETO2); (b) end-tidal CO2 pressure (PETCO2); (c) middle-cerebral artery mean velocity (MCAvmean); (d) power output; (b) pulmonary ventilation (VE); (c) carbon dioxide production (VCO2); (d) frontal lobe tissue oxygenation index (TOI); and (e) Vastus lateralis tissue oxygenation index; (f) relationship between frontal lobe tissue oxygenation index (TOI) and middle-cerebral artery mean velocity (MCAvmean), each value corresponds to the mean of 20 subjects for the 0, 2.5, 7.5, 12.5, 17.5, and 22.5, 27.5 s time points, and the errors bars represent the standard error of the mean.
Figure 4.
Figure 4.
Raw data obtained from one of the volunteers during 30 s sprints in normoxia (red lines) and severe acute hypoxia (PIO2 = 73 mmHg, blue lines). (a) Intra-arterial blood pressure (FA); (b) blood pressure in the femoral vein (FV); (c) middle-cerebral artery velocity (MCAv); (d) smoothed MCAv (1 s averages); (e) frontal lobe tissue oxygenation index (TOI); (f) heart rate (HR). The first vertical arrow indicates the start of the sprint, and the second the end of the sprint, i.e., the start of the recovery. BP: blood pressure; BS: blood sample; FV: femoral vein; FA: femoral artery.
Figure 5.
Figure 5.
Haemodynamic and cerebral blood flow responses to sprint exercise in normoxia (red circles) and severe acute hypoxia (blue circles; PIO2 = 73 mmHg; study II). (a) heart rate (HR), n = 9; (b) blood pressures, n = 9; (c) middle-cerebral artery mean velocity (MCAvmean), n = 8; (d) cerebrovascular conductance (CVC) index, calculated as the quotient MCAv/MAP, n = 8; (e) arterial partial pressure of carbon dioxide (PaCO2), n = 9; (f) Oxygen delivery index, calculated as the product of arterial oxygen content (CaO2) × MCAv, n = 8; (g) frontal lobe tissue oxygenation index (TOI), n = 9. BP: blood pressure; MAP: mean arterial pressure. During exercise the Doppler signal was lost in three subjects. *P < 0.05 normoxia versus hypoxia, at the same time point; §P < 0.05 time effect compared to immediately before the start of the sprint; the error bars represent the standard error of the mean.
Figure 6.
Figure 6.
Relationships between systolic blood pressure and peak power output during sprint exercise in normoxia (red circles) and severe acute hypoxia (blue circles; PIO2 = 73 mmHg; Study II). The highest blood pressure recorded during the sprints plotted against the peak power output (the highest 1 s average) in absolute values (a) and relative values (b), n = 9.

References

    1. Willie CK, Tzeng YC, Fisher JA, et al. Integrative regulation of human brain blood flow. J Physiol 2014; 592: 841–859. - PMC - PubMed
    1. Lassen NA. Cerebral blood flow and oxygen consumption in man. Physiol Rev 1959; 39: 183–238. - PubMed
    1. Calbet JA, Gonzalez-Alonso J, Helge JW, et al. Central and peripheral hemodynamics in exercising humans: leg vs arm exercise. Scand J Med Sci Sports 2015; 25(Suppl 4): 144–157. - PubMed
    1. MacDougall JD, Tuxen D, Sale DG, et al. Arterial blood pressure response to heavy resistance exercise. J Appl Physiol 1985; 58: 785–790. - PubMed
    1. van Mook WN, Rennenberg RJ, Schurink GW, et al. Cerebral hyperperfusion syndrome. Lancet Neurol 2005; 4: 877–888. - PubMed

Publication types