. 2017 Feb 1;32(2):287-298.
doi: 10.1093/ndt/gfw206.

Monocytic angiotensin-converting enzyme 2 relates to atherosclerosis in patients with chronic kidney disease

Affiliations

Monocytic angiotensin-converting enzyme 2 relates to atherosclerosis in patients with chronic kidney disease

Bogusz Trojanowicz et al. Nephrol Dial Transplant. .

Abstract

Background: Increased levels of monocytic angiotensin-converting enzyme (ACE) found in haemodialysis (HD) patients may directly participate in the pathogenesis of atherosclerosis. We demonstrated recently that uremia triggers the development of highly pro-atherogenic monocytes via an angiotensin II (AngII)–dependent mechanism. Opposing actions of the AngII-degrading ACE2 remain largely unknown. We examined the status of both ACEs and related receptors in circulating leukocytes of HD, not-dialyzed CKD and healthy individuals. Furthermore, we tested the possible impact of monocytic ACEs on atherogenesis and behaviour of the cells under conditions mimicking chronic renal failure.

Methods: Expression of ACE, ACE2, AT1R, AT2R and MASR was investigated on circulating leukocytes from 71 HD (62 ± 14 years), 24 CKD stage 3–5 (74 ± 10 years) patients and 37 healthy control subjects (53 ± 6 years) and isolated healthy monocytes treated with normal and uremic serum. Analyses of ACE, ACE2, ICAM-1, VCAM-1, MCSF and endothelial adhesion were tested on ACE-overexpressing THP-1 monocytes treated with captopril or losartan. ACE2-overexpressing monocytes were subjected to transmigration and adhesion assays and investigated for MCP-1, ICAM-1, VCAM-1, MCSF, AT1R and AT2R expression.

Results: The ACE mRNA level was significantly increased in HD and CKD stage 3–5 leukocytes. Correspondingly, ACE2 was downregulated and AngII as well as MAS receptor expression was upregulated in these cells. Healthy monocytes preconditioned with uremic serum reflected the same expressional regulation of ACE/ACE2, MAS and AngII receptors as those observed in HD and CKD stage 3–5 leukocytes. Overexpression of monocytic ACE dramatically decreased levels of ACE2 and induced a pro-atherogenic phenotype, partly reversed by AngII-modifying treatments, leading to an increase in ACE2. Overexpression of ACE2 in monocytes led to reduced endothelial adhesion, transmigration and downregulation of adhesion-related molecules.

Conclusions: HD and not-dialyzed CKD stage 3–5 patients show enhanced ACE and decreased ACE2 expression on monocytes. This constellation renders the cells endothelial adhesive and likely supports the development of atherosclerosis.

Keywords: ACE2; atherosclerosis; CKD; monocytes; THP-1; uremia.


Figures

FIGURE 1
FIGURE 1
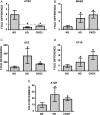
Expression of (A) ACE2, (B) MASR, (C) ACE, (D) AT1R and (E) AT2R in leukocytes obtained from healthy controls (NP) and HD patients on ARB/ACEi and without angiotensin-modifying medication. (F) Expression ratio of ACE/ACE2 obtained by dividing the fold difference values of ACE and ACE2 in NP and all HD patients. Dotted line represents expression of the target transcript in the reference sample and for evaluation purposes was set as 1; medians with IRQs. P-values *<0.01, **<0.001 and ***<0.0001 indicate statistical significance (Bonferroni correction was applied).
FIGURE 2
FIGURE 2
Expression of (A) ACE2, (B) MASR, (C) ACE, (D) AT1R and (E) AT2R in primary human monocytes conditioned with normal (NS), hemodialysis (HD) and uremic (CKD5) serum obtained from nondialysis patients. Primary human monocytes obtained from three healthy volunteers were treated with 10% NS or HD or CKD5 for 72 h and investigated for mRNA expression. Mean ± SD of three independent experiments. Dotted line represents expression of the target transcript in the reference sample and for evaluation purposes was set as 1. *P < 0.05 as compared with NS.
FIGURE 3
FIGURE 3
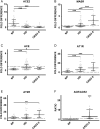
Expression of (A) ACE2, (B) MASR, (C) ACE, (D) AT1R and (E) AT2R in leukocytes obtained from healthy controls (NP), HD and CKD3–5 patients not on dialysis. (F) Expression ratio of ACE/ACE2 obtained by dividing the fold difference values of ACE and ACE2 in NP and all CKD3–5 patients. Dotted line represents expression of the target transcript in the reference sample and for evaluation purposes was set as 1; medians with IRQs. P-values *<0.01, **<0.001 and ***<0.0001 indicate statistical significance (Bonferroni correction was applied).
FIGURE 4
FIGURE 4
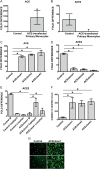
Expression of ACE and ACE2 in (A and B) ACE-transfected primary human monocytes and (C and D) THP-1 cells. Human primary monocytes were transiently transfected with empty or pcDNA3.1 plasmid carrying full coding sequence of ACE. Investigations of (A) ACE-and (B) ACE2 expression were performed 24 h after transfection. (C, D) Empty plasmid (control) and ACE-overexpressing cells (ACEclone1, ACEclone2 and ACEclone3) were investigated for (C) ACE and (D) ACE2 transcripts with specific TaqMan probes. (E) Control and pro-atherogenic ACE-overexpressing cells were treated with 500 nM captopril or 1 µM losartan for 4 h and analyzed for ACE2 expression. Untreated cells are labelled as ø. *P < 0.05 indicates statistical significance. Mean ± SD of three independent experiments. (F and G) Adhesion of THP-1 monocytes overexpressing ACE. Calcein-labelled cells were incubated for 30 min in the presence of endothelial monolayers at the chamber bottom. Adhered cells were visualized with fluorescence microscopy (G) and counted (F). Mean ± SD of cell numbers in 10 microscopic fields in three independent experiments. Representative images of control and ACE-overexpressing cells (ACEclone1) are shown (G). Dotted line within the graphs represents expression of the target transcript in the reference sample and for evaluation purposes was set as 1. *P < 0.05 indicates statistical significance.
FIGURE 5
FIGURE 5
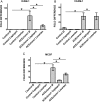
Analysis of adhesion-related transcripts in THP-1 monocytes under ACEi and ARB. Control and pro-atherogenic ACE-overexpressing cells were treated with 500 nM captopril or 1 µM losartan for 4 h and subjected for RT-PCR analysis with primers specific for (A) ICAM-1, (B) VCAM-1 and (C) MCSF. Untreated cells are labelled as ø. *P < 0.05 indicates statistical significance. Mean ± SD of three independent experiments. Dotted line represents expression of the target transcript in the reference sample and for evaluation purposes was set as 1.
FIGURE 6
FIGURE 6
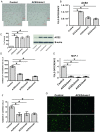
Morphology and behaviour of THP-1 monocytes overexpressing ACE2. THP-1 monocytes were stably transfected with empty or pcDNA3.1+ plasmid carrying full coding sequence of ACE2. ACE2-overexpressing cells were designated as ACE2clone1, ACE2clone2 and ACE2clone3, and empty plasmid cells as control. (A) Morphology of the cells investigated in contrast phase by conventional light microscopy. Note that ACE2-overexpressing cells (ACE2clone1) are smaller than corresponding controls. (B) Investigations of ACE2-expression performed with TaqMan probes specific for ACE2. (C) Protein expression of ACE2 as demonstrated by Western blot and densitometric analysis. Investigations were performed with specific ACE2 and B-actin antisera, and AlphaView software, respectively. (D) Transmigration of the cells through endothelial monolayers. The cells were transmigrated for 60 min and counted flow cytometrically. (E) Analysis of MCP-1 expression in control and ACE2-overexpressing cells. (F and G) Adhesion of the cells to endothelial monolayers. Calcein-labelled control and ACE2-overexpressing monocytes were incubated for 30 min in the presence of endothelial monolayers at the chamber bottom. Adhered cells were visualized with fluorescence microscopy (G) and counted (F). Mean ± SD of cell numbers in 10 microscopic fields in three independent experiments. Representative images of control and ACE2-overexpressing cells (ACE2clone1) are shown (G). Dotted line within the graphs represents expression of the target transcript in the reference sample and for evaluation purposes was set as 1. *P < 0.05 indicates statistical significance.
FIGURE 7
FIGURE 7
RT-PCR analysis of THP-1 monocytes overexpressing ACE2. Empty plasmid (control) and ACE2-overexpressing cells (ACEclone1, ACE2clone2, ACE2clone3) were analyzed for (A) MCSF, (B) ICAM-1, (C) VCAM-1, (D) AT1R and (E) AT2R. Dotted line represents expression of the target transcript in the reference sample and for evaluation purposes was set as 1. *P < 0.05 indicates statistical significance. Mean ± SD of three independent experiments.

Similar articles

Cited by

References

    1. Cheung AK, Sarnak MJ, Yan G et al. . Atherosclerotic cardiovascular disease risks in chronic hemodialysis patients. Kidney Int 2000; 58: 353–362 - PubMed
    1. Vanholder R, Massy Z, Argiles A et al. . Chronic kidney disease as cause of cardiovascular morbidity and mortality. Nephrol Dial Transplant 2005; 20: 1048–1056 - PubMed
    1. Matsushita K, van der Velde M, Astor B et al. . Association of estimated glomerular filtration rate and albuminuria with all-cause and cardiovascular mortality in general population cohorts: a collaborative meta-analysis. Lancet 2010; 12: 2073–2081 - PMC - PubMed
    1. Guerin AP, Blacher J, Pannier B et al. . Impact of aortic stiffness attenuation on survival of patients in end-stage renal failure. Circulation 2001; 103: 987–992 - PubMed
    1. Ulrich C, Seibert E, Heine GH et al. . Monocyte angiotensin converting enzyme expression may be associated with atherosclerosis rather than arteriosclerosis in hemodialysis patients. Clin J Am Soc Nephrol 2011; 6: 505–511 - PMC - PubMed