. 2017 Aug;83(8):1758-1772.
doi: 10.1111/bcp.13262. Epub 2017 Mar 31.

Population pharmacokinetics and pharmacodynamics of linezolid-induced thrombocytopenia in hospitalized patients

Affiliations

Population pharmacokinetics and pharmacodynamics of linezolid-induced thrombocytopenia in hospitalized patients

Yasuhiro Tsuji et al. Br J Clin Pharmacol. 2017 Aug.

Abstract

Aims: Thrombocytopenia is among the most important adverse effects of linezolid treatment. Linezolid-induced thrombocytopenia incidence varies considerably but has been associated with impaired renal function. We investigated the pharmacodynamic mechanism (myelosuppression or enhanced platelet destruction) and the role of impaired renal function (RF) in the development of thrombocytopenia.

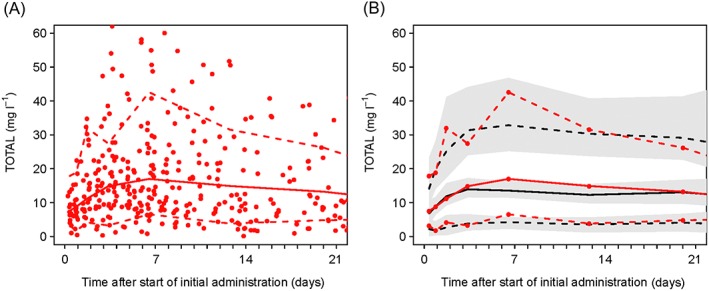
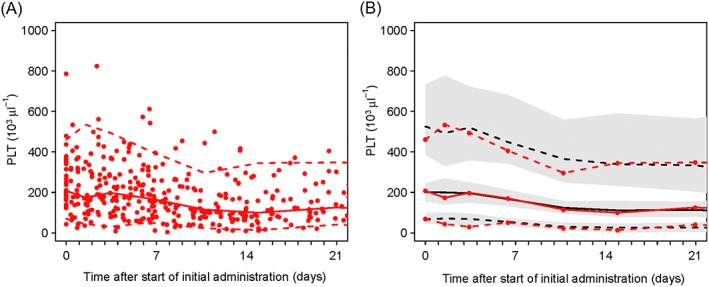
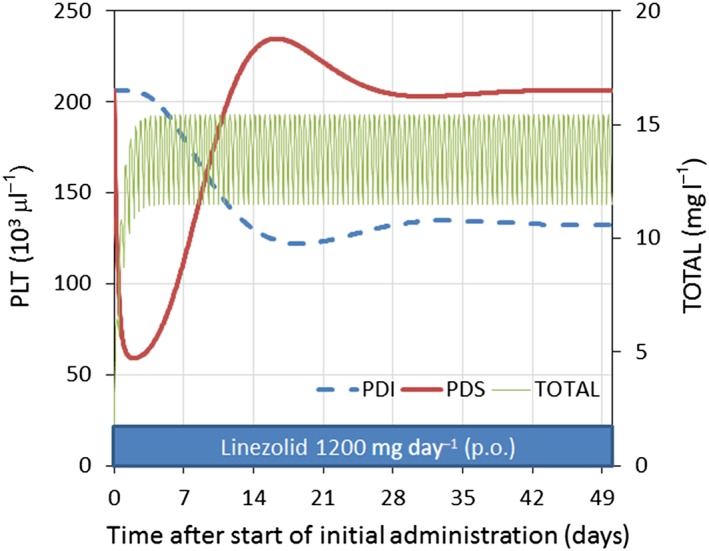
Methods: The pharmacokinetics of linezolid were described with a two-compartment distribution model with first-order absorption and elimination. RF was calculated using the expected creatinine clearance. The decrease platelets by linezolid exposure was assumed to occur by one of two mechanisms: inhibition of the formation of platelets (PDI) or stimulation of the elimination (PDS) of platelets.

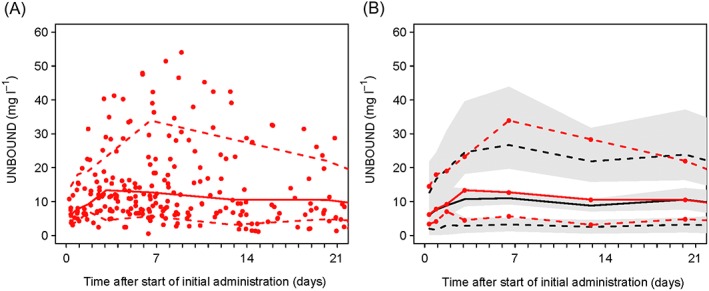
Results: About 50% of elimination was found to be explained by renal clearance (normal RF). The population mean estimated plasma protein binding of linezolid was 18% [95% confidence interval (CI) 16%, 20%] and was independent of the observed concentrations. The estimated mixture model fraction of patients with a platelet count decreased due to PDI was 0.97 (95% CI 0.87, 1.00), so the fraction due to PDS was 0.03. RF had no influence on linezolid pharmacodynamics.

Conclusion: We have described the influence of weight, renal function, age and plasma protein binding on the pharmacokinetics of linezolid. This combined pharmacokinetic, pharmacodynamic and turnover model identified that the most common mechanism of thrombocytopenia associated with linezolid is PDI. Impaired RF increases thrombocytopenia by a pharmacokinetic mechanism. The linezolid dose should be reduced in RF.

Keywords: linezolid; methicillin-resistant Staphylococcus aureus; mixture model; pharmacometrics; thrombocytopenia; turnover model.


Figures

Figure 1
Figure 1
Schematic representation of the structural pharmacokinetic model for linezolid and pharmacodynamic model for platelet time course. CL, clearance; FBACK, empirical feedback model; Ka, absorption rate constant; Kcirc, rate constant of PLTCIRC; Ktr, intercompartment transit rate constant; MTT, mean transit time; PDI, inhibition effect; PDS, stimulation effect; PLTCIRC, circulating platelets; PLTFORM, initial rate of formation of platelets; PLTZERO, baseline platelet count; Q, intercompartment clearance; VC, volume of the central compartment; VP, volume of the peripheral compartment. The final model uses Ktr = Kcirc
Figure 2
Figure 2
Model qualification using prediction‐corrected visual predictive checks (pcVPC) for total linezolid concentration. (A) Prediction‐corrected scatterplot of the measurements with 5th, 50th and 95th percentiles. (B) pcVPC showing the 5th, 50th and 95th percentiles for observed and predicted values. Black dashed lines, 5th to 95th percentiles of the predicted linezolid concentrations; black solid line, median predicted linezolid concentration in 100 simulated subsets of total dataset; grey‐shaded areas, 95% confidence intervals of the prediction percentiles; red dashed lines, 5th and 95th percentiles of the observed linezolid concentrations; red circles, observed linezolid concentration; red solid line, median observed concentration; TOTAL, total linezolid concentration
Figure 3
Figure 3
Model qualification using prediction‐corrected visual predictive checks (pcVPC) for the unbound plasma linezolid concentration. (A) Prediction‐corrected scatterplot of the measurements with 5th, 50th and 95th percentiles. (B) pcVPC showing the 5th, 50th and 95th percentiles for observed and predicted values. Black dashed lines, 5th to 95th percentiles of the predicted linezolid concentrations; black solid line, median predicted linezolid concentration in 100 simulated subsets of total dataset; grey‐shaded areas, 95% confidence intervals of the prediction percentiles; red circles, observed linezolid concentration; red dashed lines, 5th and 95th percentiles of the observed linezolid concentrations; red solid line, median observed concentration; UNBOUND, unbound linezolid concentration
Figure 4
Figure 4
Model qualification using prediction‐corrected visual predictive checks (pc‐VPC) for platelet counts (mixture group 1 – inhibition of proliferation). (A) Prediction‐corrected scatterplot of the measurements with 5th, 50th and 95th percentiles. (B) pcVPC showing the 5th, 50th and 95th percentiles for observed and predicted values. PLT, platelet count (mixture group 1). Grey‐shaded areas, 95% confidence intervals of the prediction percentiles; red circles, observed platelet counts; red dashed lines, 5th and 95th percentiles the observed platelets count; red solid line, median observed platelet count; black dashed lines, 5th to 95th percentiles of the predicted platelets count; black solid line, median predicted platelet count in 100 simulated subsets of total dataset
Figure 5
Figure 5
Predicted time course of total linezolid plasma concentration and platelet count with inhibition of proliferation (PDI) or stimulation of destruction (PDS) produced by linezolid 1200 mg day–1 orally. Simulation using mean values for parameters based on the final model (total body weight 70 kg, creatinine clearance 6 l h–1 70 kg–1, age 69 years, linezolid oral dosage 600 mg every 12 h). TOTAL, total linezolid concentration
Figure 6
Figure 6
Time course of platelet count and unbound plasma linezolid concentration in representative patients having different dosages and durations of linezolid administration. Patients 1, 58 and 64 (A–C) are best described as showing inhibition of the synthesis of platelets. Patients 37 and 55 (D and E) are patients that are best described as showing stimulation of the elimination of platelets. Boxed areas show linezolid duration and dosage per day. closed circle and solid line, observed unbound plasma linezolid concentration; dashed line, predicted unbound plasma linezolid concentration using the final model; closed square and long‐dashed line, observed platelet count; dotted line, predicted platelet count; PLT, platelet count; UNBOUND, unbound plasma linezolid concentration

References

    1. Zurenko GE, Yagi BH, Schaadt RD, Allison JW, Kilburn JO, Glickman SE, et al. In vitro activities of U‐100592 and U‐100766, novel oxazolidinone antibacterial agents. Antimicrob Agents Chemother 1996; 40: 839–845. - PMC - PubMed
    1. Dryden MS. Linezolid pharmacokinetics and pharmacodynamics in clinical treatment. J Antimicrob Chemother 2011; 66 (Suppl. 4)): iv7–iv15. - PubMed
    1. Lovering AM, Zhang J, Bannister GC, Lankester BJA, Brown JHM, Narendra G, et al. Penetration of linezolid into bone, fat, muscle and haematoma of patients undergoing routine hip replacement. J Antimicrob Chemother 2002; 50: 73–77. - PubMed
    1. Tsuji Y, Hashimoto W, Taniguchi S, Hiraki Y, Mizoguchi A, Yukawa E, et al. Pharmacokinetics of linezolid in the mediastinum and pleural space. Int J Infect Dis 2013; 17: E1060–E1061. - PubMed
    1. Tsuji Y, Hiraki Y, Matsumoto K, Mizoguchi A, Sadoh S, Kobayashi T, et al. Pharmacokinetics and protein binding of linezolid in cerebrospinal fluid and serum in a case of post‐neurosurgical bacterial meningitis. Scand J Infect Dis 2011; 43: 982–985. - PubMed

MeSH terms