. 2017 Feb 10;13(2):e1005382.
doi: 10.1371/journal.pcbi.1005382. eCollection 2017 Feb.

Human mobility and the spatial transmission of influenza in the United States

Affiliations

Human mobility and the spatial transmission of influenza in the United States

Vivek Charu et al. PLoS Comput Biol. .

Abstract

Seasonal influenza epidemics offer unique opportunities to study the invasion and re-invasion waves of a pathogen in a partially immune population. Detailed patterns of spread remain elusive, however, due to lack of granular disease data. Here we model high-volume city-level medical claims data and human mobility proxies to explore the drivers of influenza spread in the US during 2002-2010. Although the speed and pathways of spread varied across seasons, seven of eight epidemics likely originated in the Southern US. Each epidemic was associated with 1-5 early long-range transmission events, half of which sparked onward transmission. Gravity model estimates indicate a sharp decay in influenza transmission with the distance between infectious and susceptible cities, consistent with spread dominated by work commutes rather than air traffic. Two early-onset seasons associated with antigenic novelty had particularly localized modes of spread, suggesting that novel strains may spread in a more localized fashion than previously anticipated.


Conflict of interest statement

The authors have declared that no competing interests exist.

Figures

Fig 1
Fig 1. Standardized influenza-like-illness time series from four locations (Denver, CO; Roanoke, VA; Bryan, TX; Spencer, IA).
Onset times for each season are depicted as red dashed lines. The 2003/2004 epidemic and 2009/2010 pandemic are highlighted in pink as these are major influenza seasons associated with antigenic novelty, where more than 99% of viruses in circulation were of the same subtype (A/H3N2 in 2003/2004 and A/H1N1 in 2009/2010). These major seasons had the most distinct influenza signals, while few locations experienced an increase in ILI during the mild 2008/2009 epidemic dominated by the A/H1N1 virus.
Fig 2
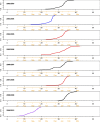
Fig 2. Cumulative epidemic curves display the proportion of locations infected over time in each season.
In each panel, the x-axis represents weeks since June 1st, with the corresponding calendar months labeled in orange. Each graph represents 100 possible epidemic curves generated by varying local onset times within estimated bounds of uncertainty. The tightness of the curves indicates that uncertainty in local onset times has little effect on the epidemic’s overall trajectory. Epidemic curves are colored according to the dominant subtype in circulation (black corresponds to A/H1N1 + B, blue to A/H3N2, red to A/H3N2 + B, and purple to A/H1N1pdm).
Fig 3
Fig 3. Influenza epidemic onset times across eight seasons, 2002/2003-2009/2010 (as estimated based on outpatient influenza-like-illness time series).
Each circle represents a distinct location, and the size of the circle is proportional to the population size of the location. The relative ordering of influenza onsets is depicted in color, magenta indicating locations with earliest onsets and purple indicating locations with latest onsets.
Fig 4
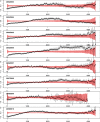
Fig 4. Pairwise synchrony as a function of pairwise distance in each influenza season (2002/2003–2009/2010).
The y-axis in each panel is a normalized measure of pairwise synchrony in onset times between locations (values near -1 indicate that epidemics start close together in time, while values near +1 indicate a substantial lag in onset times). The x-axis is distance (kilometers). Each circle represents the mean pairwise synchrony for pairs of locations falling in 50-km distance bins. The black line segments are 95% confidence intervals for the mean in each bin. The red band is the expected pairwise synchrony under the null hypothesis of complete spatial randomness obtained by permutation of the onset times.
Fig 5
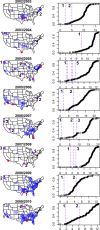
Fig 5. Long range transmission events and potential origins of each epidemic.
For each season, the purple circles indicate long-range transmission events (i.e. locations far from the set of infectious locations that obtain influenza regardless). Blue circles are locations infected within a two-week window from the last long-range event. Red circles depict the potential outbreak origin in each epidemic. Grey circles are infected locations before the first long-range event occurred in each season. Panels on the right indicate when in the epidemic long-range events occurred. Note that the methods used to identify long-range transmission events and estimate the origin of each epidemic are agnostic of one another; in 2008/2009 an early “long-range transmission event” appears near the estimated origin of the epidemic.
Fig 6
Fig 6. Spatial transmission kernels and demographic effects summarized across seasons.
Left panel. Work commutes scale with geographic distance according to a power law of 3.3 (95% CI: 2.66 to 3.95); this relationship is depicted in blue (See also supporting S1 Text, Figure A6). Based on our distance-based transmission model, the force of infection between an infectious and susceptible city, λij, scales with geographic distance according to a median estimated power law of 2.2 (range: 2.08 to 2.65), depicted in red. This indicates that for a 10-fold decrease in distance between an infectious and susceptible pair of cities, the hazard of infection on the susceptible city increases by a factor of ~158 (range: 120–467). Right panel. The force of infection on a susceptible city, λj, scales with its population size according to a median estimated power law of 0.28 (range: 0.15 to 0.35). This indicates that for a 10-fold increase in population size, the hazard of infection on the susceptible city increases by a factor of 1.9 (range: 1.4–2.2).

References

    1. Viboud C, Bjørnstad ON, Smith DL, Simonsen L, Miller MA, Grenfell BT. Synchrony, waves, and spatial hierarchies in the spread of influenza. Science. 2006;312: 447–451. 10.1126/science.1125237 - DOI - PubMed
    1. Nelson MI, Simonsen L, Viboud C, Miller MA, Taylor J, George KS, et al. Stochastic Processes Are Key Determinants of Short-Term Evolution in Influenza A Virus. PLOS Pathog. 2006;2: e125 10.1371/journal.ppat.0020125 - DOI - PMC - PubMed
    1. Russell CA, Jones TC, Barr IG, Cox NJ, Garten RJ, Gregory V, et al. The global circulation of seasonal influenza A (H3N2) viruses. Science. 2008;320: 340–346. 10.1126/science.1154137 - DOI - PubMed
    1. Bedford T, Riley S, Barr IG, Broor S, Chadha M, Cox NJ, et al. Global circulation patterns of seasonal influenza viruses vary with antigenic drift. Nature. 2015;523: 217–220. 10.1038/nature14460 - DOI - PMC - PubMed
    1. Viboud C, Nelson MI, Tan Y, Holmes EC. Contrasting the epidemiological and evolutionary dynamics of influenza spatial transmission. Philos Trans R Soc Lond B Biol Sci. 2013;368: 20120199 10.1098/rstb.2012.0199 - DOI - PMC - PubMed

Publication types

MeSH terms