. 2017 Feb 10;15(2):e2001665.
doi: 10.1371/journal.pbio.2001665. eCollection 2017 Feb.

Neural mechanisms of rhythm-based temporal prediction: Delta phase-locking reflects temporal predictability but not rhythmic entrainment

Affiliations

Neural mechanisms of rhythm-based temporal prediction: Delta phase-locking reflects temporal predictability but not rhythmic entrainment

Assaf Breska et al. PLoS Biol. .

Abstract

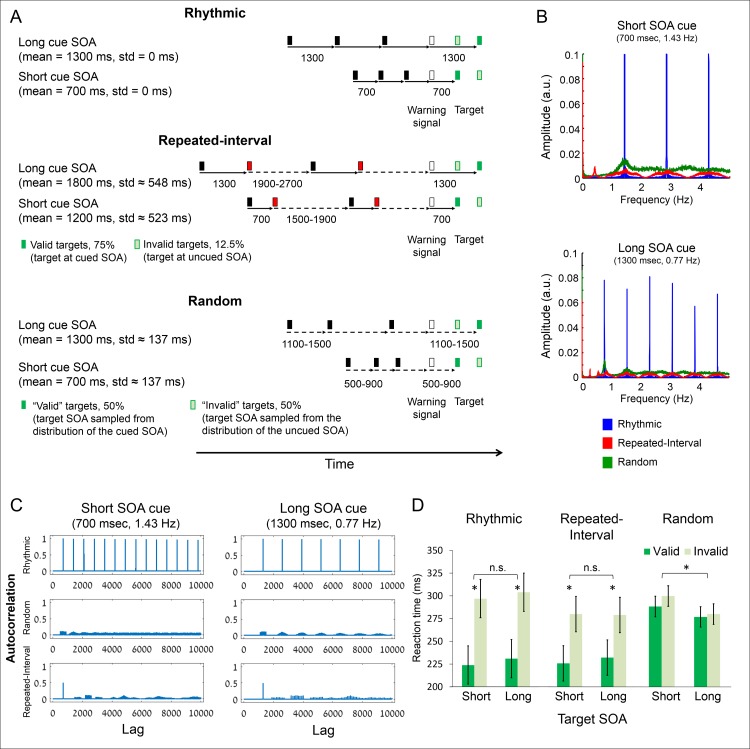
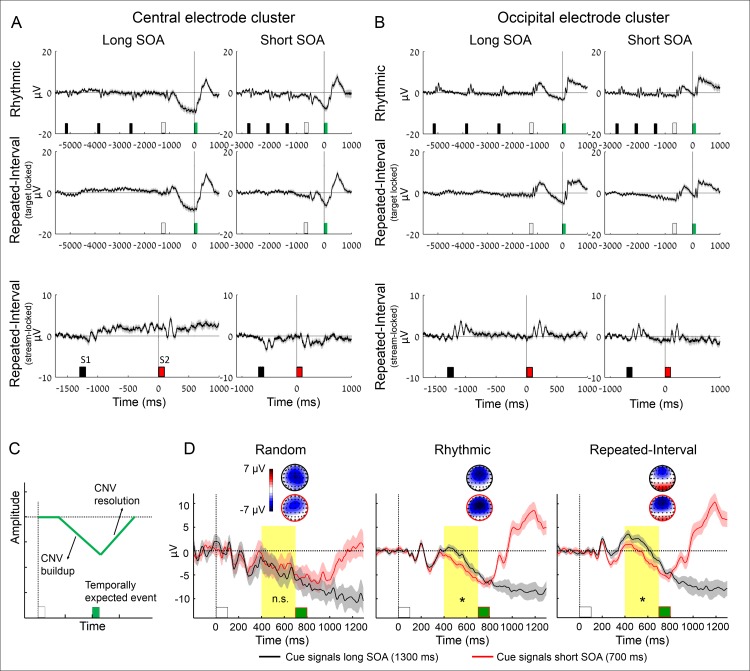
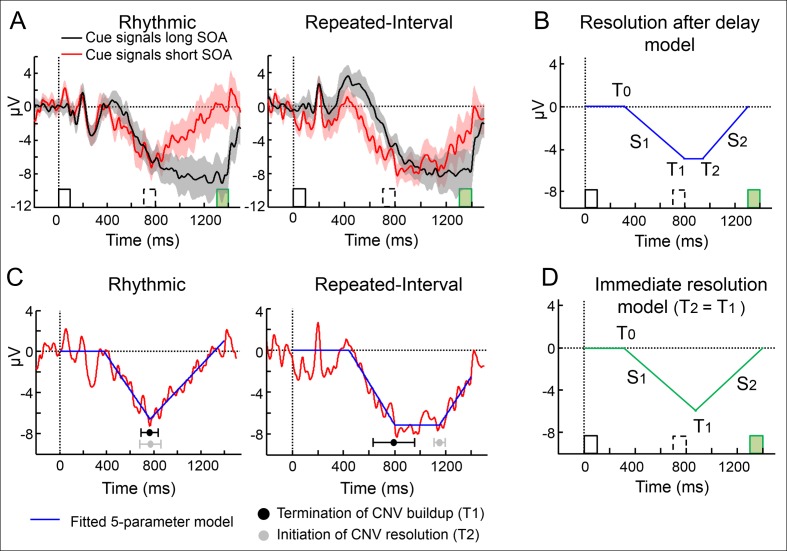
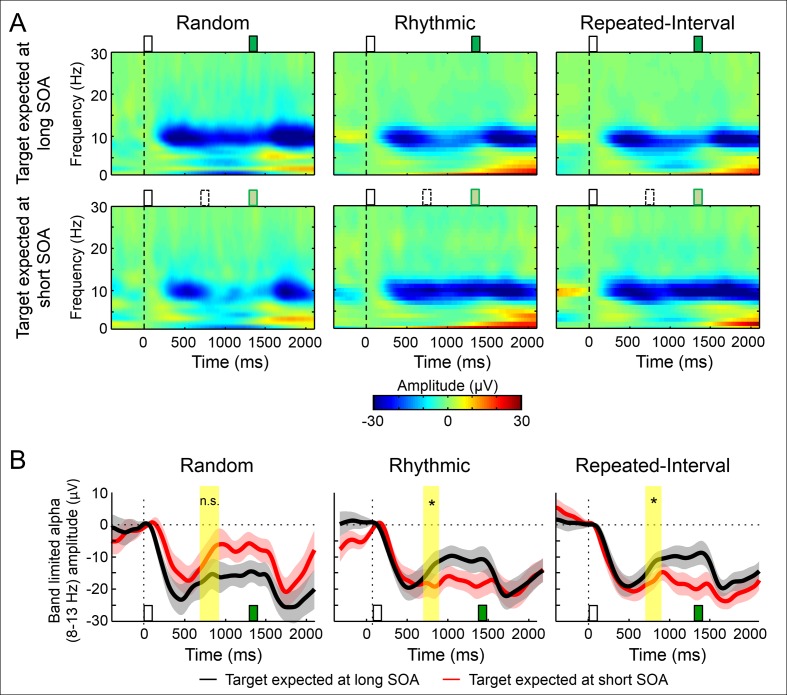
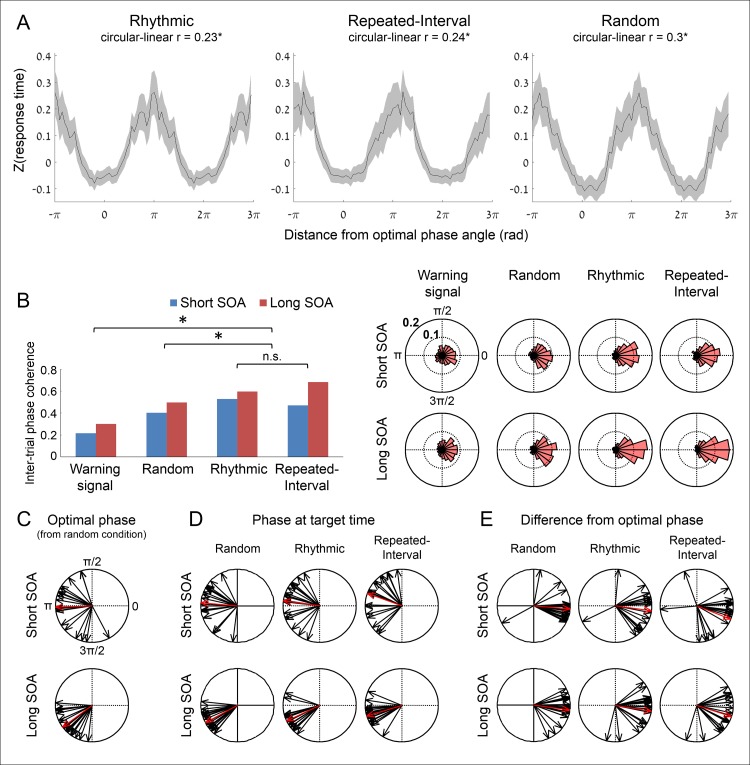
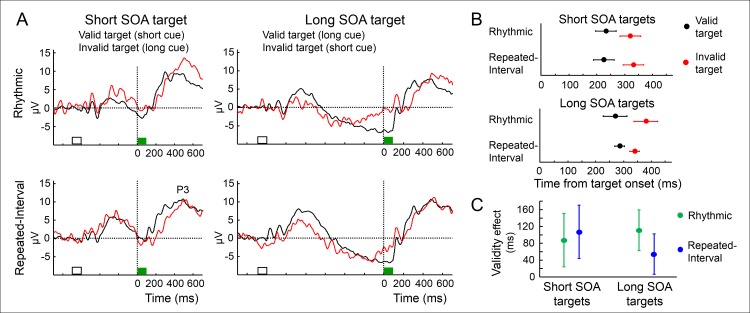
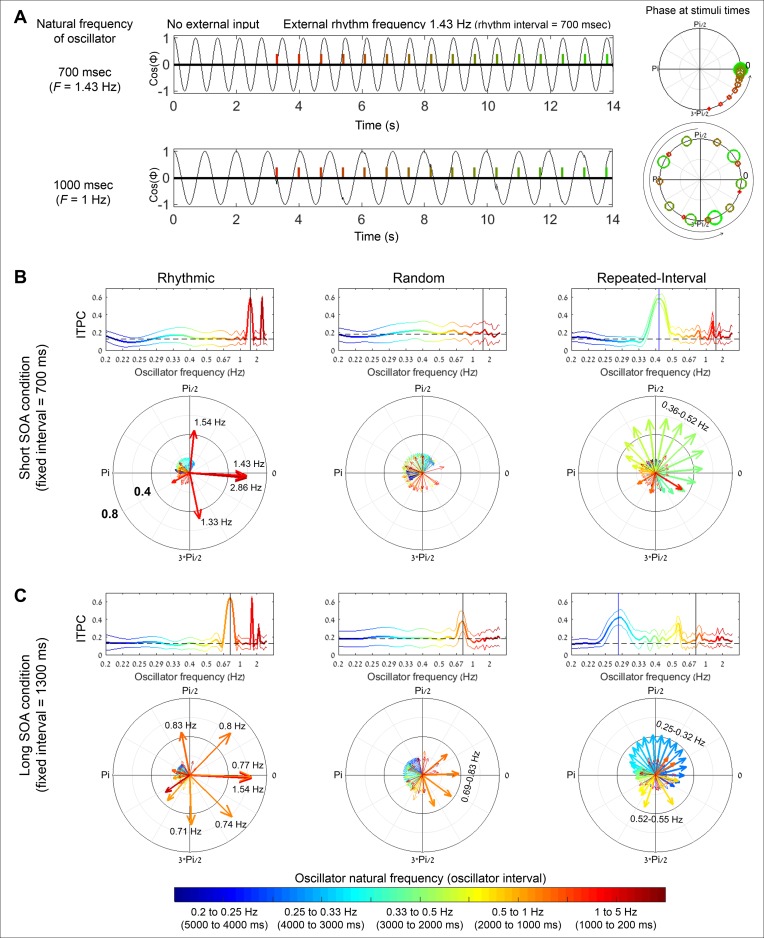
Predicting the timing of upcoming events enables efficient resource allocation and action preparation. Rhythmic streams, such as music, speech, and biological motion, constitute a pervasive source for temporal predictions. Widely accepted entrainment theories postulate that rhythm-based predictions are mediated by synchronizing low-frequency neural oscillations to the rhythm, as indicated by increased phase concentration (PC) of low-frequency neural activity for rhythmic compared to random streams. However, we show here that PC enhancement in scalp recordings is not specific to rhythms but is observed to the same extent in less periodic streams if they enable memory-based prediction. This is inconsistent with the predictions of a computational entrainment model of stronger PC for rhythmic streams. Anticipatory change in alpha activity and facilitation of electroencephalogram (EEG) manifestations of response selection are also comparable between rhythm- and memory-based predictions. However, rhythmic sequences uniquely result in obligatory depression of preparation-related premotor brain activity when an on-beat event is omitted, even when it is strategically beneficial to maintain preparation, leading to larger behavioral costs for violation of prediction. Thus, while our findings undermine the validity of PC as a sign of rhythmic entrainment, they constitute the first electrophysiological dissociation, to our knowledge, between mechanisms of rhythmic predictions and of memory-based predictions: the former obligatorily lead to resonance-like preparation patterns (that are in line with entrainment), while the latter allow flexible resource allocation in time regardless of periodicity in the input. Taken together, they delineate the neural mechanisms of three distinct modes of preparation: continuous vigilance, interval-timing-based prediction and rhythm-based prediction.


Conflict of interest statement

The authors have declared that no competing interests exist.

Figures

Fig 1
Fig 1. Experimental paradigm and behavioral results demonstrating larger cost but not benefit for rhythm-based temporal predictions.
(A) Subjects detected targets embedded in a stream of visual stimuli. In the Rhythmic condition, the stream intervals were fixed. In the Repeated-Interval condition, every black-to-red interval was fixed and red-to-black jittered. In the Random condition, all intervals were jittered around the fixed interval. In the first two conditions, the target (dark green) appeared at the fixed SOA relative to a WS (white) in 75% and in the other SOA in 12.5% of the trials (light green with dark green edge). The remaining 12.5% were catch trials in which no target appeared, to prevent anticipatory responses to long SOA targets. In the Random condition, the target SOA was drawn from the same distribution as the stream SOA in 43.75% of the trials and from the other distribution in the other 43.75%, and 12.5% of the trials were catch trials. (B) Spectral representations of the stimulus sequence in the three experimental conditions. The stimulus sequence in each experimental condition was modeled as a time series that contains one at stimulus onset and zero otherwise (all trials were concatenated). The amplitude at the cued frequency as well as in delta frequencies (0.5–3 Hz) is strongest in the Rhythmic condition, weaker in the Random condition, and weakest in the Repeated-Interval condition. (C) Autocorrelation functions of the stimulus sequence in the three experimental conditions, calculated on the same modeled stimulus sequences that were used to create the spectral representations in B. The Rhythmic condition has high autocorrelation in fixed lags because of the perfect periodicity; the other conditions have relatively low autocorrelation at varying lags. (D) Mean reaction times in each combination of SOA and cue validity in the three experimental conditions. Error bars represent standard errors of the validity effect within each SOA and condition. *p < 0.05.
Fig 2
Fig 2. The CNV buildup is similarly modulated by rhythm- and memory-based temporal predictions.
(A, B) Group-averaged ERPs elicited by the stimulus sequence in the different conditions in central (A) and occipital (B) electrode clusters. Black/red bars: sequence stimuli (prior to the WS), white bars: WS, green bars: targets. Top row: Rhythmic condition, locked to the WS, in an interval extending from the third stimulus prior to the WS up to the target (all trials had at least three stimuli prior to the WS). Middle row: Repeated-Interval condition, locked to the WS (interval identical to the Rhythmic condition). Bottom row: response to the last pair preceding the WS-target pair in the Repeated-Interval condition, locked to the first stimulus of the pair (S1). These pairs are not presented in the middle row, as their timing was jittered relative to the WS-target pair. (C) Schematic illustration of the CNV stages. (D) Group averaged responses (average across a 9-electrode central cluster) locked to the WS (white bar) onset. Note more negative CNV waveforms when expecting a target at the short (red) compared to the long SOA (black) in the two predictive conditions. Error margins reflect the standard error for the difference between SOAs; scalp topographies are averaged across 650–700 ms post-WS, just before the short SOA target (green bar). Yellow background marks the predefined interval for analysis (*p < 0.05).
Fig 3
Fig 3. Immediate CNV resolution after omission of an expected event for rhythm-based temporal predictions.
(A) Group averaged waveforms (central cluster electrodes) in the two predictive conditions exclusively for trials with long SOA targets (green bar). Black line—expecting the target in the long SOA; Red line—expecting it in the short SOA, but it is omitted (invalid short cue trials). Error margins—standard error for the difference between SOAs. (B) A five-parameter model that allowed a delay between buildup and resolution was fitted to the CNV waveform. (C) Waveforms of the Rhythmic and Repeated-Interval when an expected short SOA target is omitted (red) fitted with the five-parameter model (blue), with estimated latencies of termination of the CNV buildup and initiation of the CNV resolution. (D) A four-parameter model that coerced immediate resolution after buildup termination was used as a null model for model comparison.
Fig 4
Fig 4. Similar amplitude modulation of occipital alpha-band activity by rhythm- and memory-based temporal predictions.
(A) Time–frequency representations (group average, across six occipital electrodes) of the WS-target interval in the three experimental conditions for long SOA targets (green rectangle) when expecting the target in the short SOA, but it is omitted (bottom row, expected target in dashed) versus expecting it in the long SOA (top row). (B) Band-limited alpha amplitude (8–13 Hz). Error margins reflect the standard error for the difference between SOAs; Yellow shading—the predefined interval for analysis (*p < 0.05).
Fig 5
Fig 5. Similar phase modulation of occipital delta-band activity (0.5–3 Hz) by rhythm- and memory-based temporal predictions.
(A) Association between delta phase and performance in the three experimental conditions. Standardized RT as a function of distance from optimal delta phase at target time, pooled across all trials and smoothed with a moving π/2 wide window (two identical waveforms concatenated for visualization). To accumulate across subjects, we standardized RTs within subject and normalized phases to have an optimal phase of zero. *p < 0.05. (B) Inter-trial phase coherence (ITPC) values and polar histograms of delta phase in the two predictive conditions at target time, and in the two control conditions, at target time in the Random condition and at WS time in the Rhythmic condition. *p < 0.05. (C) Optimal delta phase angles in short and long target SOAs for each participant (black) and across participants (red). (D) Delta phase angles at target time in the three experimental conditions in short and long target SOAs, averaged across trials for single participants (black) and across participants (red). (E) Differences between average delta phase angles at target time and the optimal angles for single participants (black) and group (red). A difference of zero implies that the phase at target time was identical to the optimal phase.
Fig 6
Fig 6. Similar modulation of P3 latency by rhythm- and memory-based temporal predictions.
(A) Averaged waveforms in the two predictive conditions for validly (black) and invalidly (red) cued targets (green bar). Waveforms are averaged across a three-electrode parietal cluster and across participants locked to the target (green bar). Time zero is target onset. (B) Latency estimates of the P3, defined as the time point in which it reaches 50% of its amplitude. Error margins reflect one standard error of the difference between valid and invalid. (C) The effect of target validity on the P3 latency in each target SOA in the two predictive conditions. Error margins reflect one standard error of the difference between the predictive conditions in each SOA.
Fig 7
Fig 7. Predictions of an oscillatory entrainment model for the ITPC and angles in the experimental conditions.
(A) Angle dynamics of two modelled individual oscillators (top row: with natural frequency of 1.43 Hz, and bottom row: with natural frequency of 1 Hz) entrained by the same rhythmic stimulus stream with frequency of 1.43Hz. Left: cos(ϕ) values as a function of time, first without an external entraining stream, then when exposed to the external entraining stream. Right: ϕ values at rhythmic stimuli times, color coded from red to green and from small to large with the progression of the stream along time. The stimuli entrain (phase-align) the oscillator with the matching natural frequency but not the one with a diverging frequency. (B) Modelled phase pattern of an array of oscillators with frequencies ranging from 0.2 to 5 Hz with exposure to the stimuli streams of the Rhythmic, Random, and Repeated-Interval conditions (left, middle, and right columns, respectively) with short SOA (700 ms, equivalent to 1.43 Hz). Different colors indicate the natural frequency of the oscillators. Top row: modelled ITPC values at target times (thick line) with 95% CIs (thin lines, Bonferroni corrected for multiple comparisons for the number of frequencies). Dashed horizontal line indicates the ITPC expected by chance, based on a surrogate distribution of ITPC with matching trial numbers. Black vertical line indicates the oscillator whose frequency matches the stream frequency (here 1.43 Hz). In the Repeated-Interval condition, a blue vertical line indicates the oscillator whose frequency matches the slow rhythm that is generated by every second stimulus (0.42 Hz). Bottom row: mean angles at target times across trials predicted by the model for oscillators with different natural frequencies. The length of the arrows represents the ITPC. The color of the arrows represents the natural frequency, corresponding to the colors in the top row. Frequencies with relatively high ITPC are annotated with numbers. (C) Same as B for the long SOA (1,300 ms, equivalent to 0.77 Hz). In the top row, black and blue vertical lines indicate oscillators with frequencies of 0.77 and 0.28 Hz, respectively.

Comment in

References

    1. Coull JT, Nobre AC. Where and when to pay attention: the neural systems for directing attention to spatial locations and to time intervals as revealed by both PET and fMRI. J Neurosci. 1998;18: 7426–35. - PMC - PubMed
    1. Cui X, Stetson C, Montague PR, Eagleman DM. Ready…go: Amplitude of the fMRI signal encodes expectation of cue arrival time. PLoS Biol. 2009;7. - PMC - PubMed
    1. Henry MJ, Obleser J. Frequency modulation entrains slow neural oscillations and optimizes human listening behavior. Proc Natl Acad Sci U S A. 2012;109: 2009–100. - PMC - PubMed
    1. Henry MJ, Herrmann B, Obleser J. Entrained neural oscillations in multiple frequency bands comodulate behavior. Proc Natl Acad Sci U S A. 2014;111: 1408741111-. - PMC - PubMed
    1. Nobre AC, Coull JT, Frith CD, Mesulam MM. Orbitofrontal cortex is activated during breaches of expectation in tasks of visual attention. Nat Neurosci. 1999;2: 11–2. 10.1038/4513 - DOI - PubMed

Publication types