. 2017 Feb 10;13(2):e1005284.
doi: 10.1371/journal.pcbi.1005284. eCollection 2017 Feb.

An Atlas of Peroxiredoxins Created Using an Active Site Profile-Based Approach to Functionally Relevant Clustering of Proteins

Affiliations

An Atlas of Peroxiredoxins Created Using an Active Site Profile-Based Approach to Functionally Relevant Clustering of Proteins

Angela F Harper et al. PLoS Comput Biol. .

Abstract

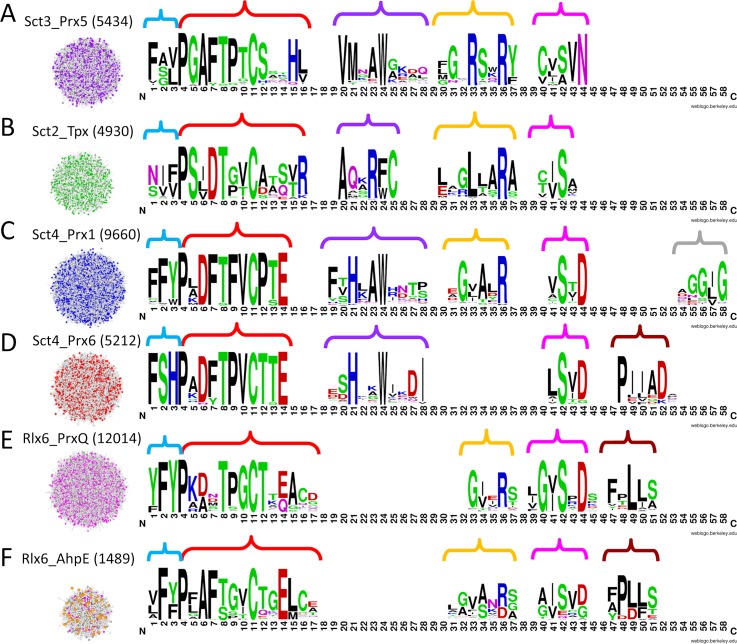
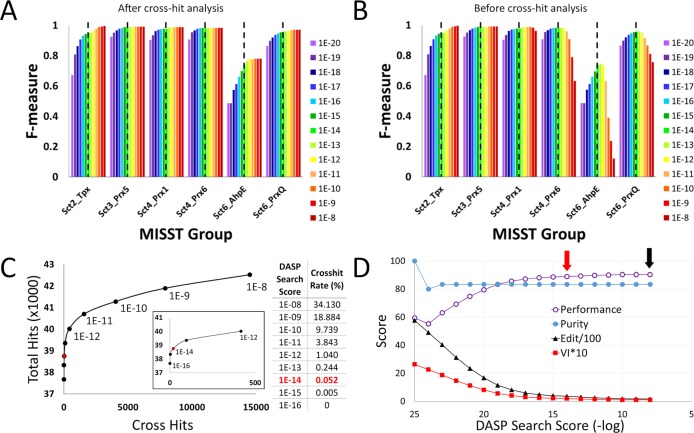
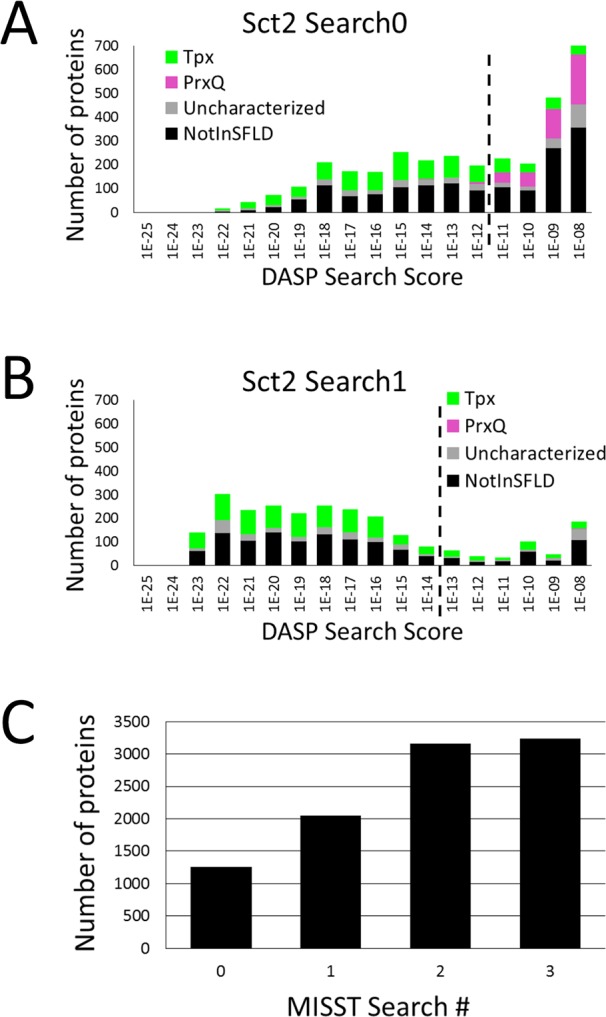
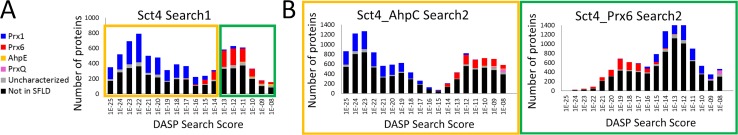
Peroxiredoxins (Prxs or Prdxs) are a large protein superfamily of antioxidant enzymes that rapidly detoxify damaging peroxides and/or affect signal transduction and, thus, have roles in proliferation, differentiation, and apoptosis. Prx superfamily members are widespread across phylogeny and multiple methods have been developed to classify them. Here we present an updated atlas of the Prx superfamily identified using a novel method called MISST (Multi-level Iterative Sequence Searching Technique). MISST is an iterative search process developed to be both agglomerative, to add sequences containing similar functional site features, and divisive, to split groups when functional site features suggest distinct functionally-relevant clusters. Superfamily members need not be identified initially-MISST begins with a minimal representative set of known structures and searches GenBank iteratively. Further, the method's novelty lies in the manner in which isofunctional groups are selected; rather than use a single or shifting threshold to identify clusters, the groups are deemed isofunctional when they pass a self-identification criterion, such that the group identifies itself and nothing else in a search of GenBank. The method was preliminarily validated on the Prxs, as the Prxs presented challenges of both agglomeration and division. For example, previous sequence analysis clustered the Prx functional families Prx1 and Prx6 into one group. Subsequent expert analysis clearly identified Prx6 as a distinct functionally relevant group. The MISST process distinguishes these two closely related, though functionally distinct, families. Through MISST search iterations, over 38,000 Prx sequences were identified, which the method divided into six isofunctional clusters, consistent with previous expert analysis. The results represent the most complete computational functional analysis of proteins comprising the Prx superfamily. The feasibility of this novel method is demonstrated by the Prx superfamily results, laying the foundation for potential functionally relevant clustering of the universe of protein sequences.


Conflict of interest statement

The authors have declared no competing interests exist.

Figures

Fig 1
Fig 1. Active Site Profiling identifies molecular features around a protein’s functional site.
(A) In an enzyme structure, key functional residues (black side chains) are identified from sequence and structural analysis. All residues within 10 Å of any key residue (gray spheres) are identified [35,36]. The visualization was created using UCSF Chimera package, version 1.10.2 (B) Residues within the 10 Å spheres are extracted and concatenated to form an active site signature (top). Signatures from a protein family are aligned to create an active site profile (ASP) (bottom). Within the profile, molecular features that are common across the superfamily (blue arrows), as well as features that seem to divide the profile into two distinct groups (red arrows), can be identified. The black line separates the two functional families with Prx5 proteins on top of the line and PrxQ proteins below the line.
Fig 2
Fig 2. Four TuLIP groups split into six functionally relevant groups after five MISST iterations.
(A) The four TuLIP groups are represented by networks in which each node represents a Prx protein of known structure. Edges are pairwise profile scores (as defined in [54]) and node colors represent expert functional annotations (see legend). (B) A dendrogram of the iterative MISST process illustrates how the initial TuLIP groups evolved into the final MISST groups. Vertical lines represent GenBank searches and dendrogram lines are colored based on the majority subgroup in each MISST cluster. Dendrogram branches represent the cluster subdivision via PSSM Analysis. The circle at each line terminus represents the iteration at which the group met self-identification criteria (see Methods). (C) The final six Prx groups are represented as networks in which nodes represent the proteins and edges represent the DASP2 search scores from the final search; the nodes are colored by expert subgroup annotation previously defined [35].
Fig 3
Fig 3. TuLIP- and MISST-identified groups correspond well with expertly-identified subgroups.
TuLIP (A) and MISST (B) groups are shown on the y-axis and compared to the six known subgroups on the x-axis. Grid fill color denotes the percent of protein structures (A) or sequences (B) in each SFLD subgroup identified by each TuLIP (A) or MISST (B) group, according to the legend. The MISST heat map contains all sequences identified with a DASP2 search score ≤1e-14.
Fig 4
Fig 4. MISST and PSSM Analysis flowcharts describe the process of agglomerative identification of sequences as members of functionally relevant groups.
(A) Flow chart of the MISST process for identifying functionally relevant groups within a protein superfamily. (B) An illustration of the agreement criterion: a scatterplot of all proteins identified by DASP2 searches using two ASPs, Group 4A and Group 4B, that were subdivided in the previous MISST iteration. Red lines indicate the significance threshold used to label proteins as “significant” or “not significant” in each group. Sequences in the yellow quadrants are those identified in both searches at similar (significant or not) DASP2 scores. Those sequences in the cyan quadrants differ in significance. This metric is used to determine if a group that is subdivided by PSSM Analysis produces truly distinct search results. (C) Flow chart of PSSM Analysis for identifying when and how to divide clusters into functionally relevant groups.
Fig 5
Fig 5. Signature conservation graphs highlight potential specificity determining positions (SDPs) in each of the six Prx subgroups.
Pseudo-signatures (see Methods) for the significantly scoring proteins (post cross hit analysis) in each MISST group were used to construct signature conservation graphs (signature logos of the active site profiles). Letter height indicates the residue conservation in that position. Colored braces indicate motifs discussed in the text. The clusters on the left show the proteins used to create the signature logos, colored by previously defined subgroup; the number in parenthesis represents the number of proteins in each cluster. The signature logos were created using WebLogo version 2.8.2 with default settings and with the y-axis not shown.
Fig 6
Fig 6. Quantitative analysis shows final MISST groups are distinct and correspond well with previously identified proteins.
F-measure, the harmonic mean of precision and recall, is calculated for each of the six MISST groups at each DASP2 search score threshold (A, B). DASP2 score thresholds are represented by different colored bars, according to the legend, from most significant (purple) to least significant (red); dashed black lines indicate the significance threshold ≤1e-14. F-measure was calculated both before executing cross hit analysis (B) and after executing cross hit analysis (A) (see Methods). The number of cross hits, or GIs identified by more than one MISST group, is plotted against the number of unique GIs identified by all six MISST groups at each DASP2 search score threshold (C). The inset is a magnified view, showing only thresholds ≤1e-12 to ≤1e-16. A table shows the cross hit rate as a percentage, which is the number of cross hits divided by the number of total unique hits, at each score threshold. In both the graph and the table, the significance threshold ≤1e-14 is highlighted in red. The graphs and table in both (B) and (C) were constructed prior to completing cross hit analysis (see Methods). Performance, edit distance, VI distance and purity values (details in S3 File) are shown for each DASP2 search score threshold from ≤1e-8 to ≤1e-25 (D). These scores were calculated after executing cross hit analysis. The black arrow highlights peak performance and the red arrow highlights the significance threshold ≤1e-14.
Fig 7
Fig 7. Agglomeration of Tpx sequences and loss of PrxQ sequences in Sct2_Tpx during MISST search iterations.
The proteins identified in Sct2_Tpx Search0 (A) and Search1 (B) are displayed as histograms with bars colored to show previously known functional groups. Dotted black lines signify the DASP search score threshold of ≤1e-12 for Search0 and ≤1e-14 for Search1. (C) The number of total proteins identified by Sct2_Tpx at significant DASP2 search scores is shown for searches 0 through 3.
Fig 8
Fig 8. PSSM Analysis subdivides Sct4 into Prx1 and Prx6 groups based on distinctive active site features.
(A) A score distribution of the Sct4 Search1 results is shown with bars colored based on known functional annotation. The yellow and green boxes identify the groups distinguished by PSSM Analysis. (B) Search2 score distributions show the results of the subsequent MISST iteration, in which profiles of sequences in each of the yellow and green boxes were created and used in separate searches.
Fig 9
Fig 9. PSSM Analysis subdivides Rlx6 into AhpE and PrxQ groups.
(A) The DASP2 score distribution of the Rlx6 Search1 results is shown with bars colored by known functional annotations (see legend). The blue and green boxes represent the two groups identified by PSSM Analysis. (B) The DASP2 score distributions that result from Search2, which uses as input the ASPs composed of the proteins in the blue and green boxes from (A). Search2 results illustrate the separation of the AhpE (orange) and PrxQ (pink) subgroups. An inset shows more detail for scoring bins 1e-25 to 1e-12 for the Rlx6_AhpE Search2 histogram.
Fig 10
Fig 10. Comparison of AhpE and PrxQ signatures suggests why 54 previously annotated PrxQ proteins are identified in the Rlx6_AhpE MISST group.
Signature conservation graphs were made for all proteins previously annotated as PrxQ in the Rlx6_PrxQ group and all proteins previously annotated as PrxQ or AhpE in the Rlx6_AhpE MISST group. Gray highlights represent the key residues used to initiate TuLIP. Orange highlights represent positions in which Rlx6_AhpE proteins annotated as PrxQ share more similarity with the AhpE subgroup than the PrxQ subgroup. Signature conservation graphs were made using Weblogo version 2.8.2 [61] with default settings, including small sample correction.
Fig 11
Fig 11. Representative network highlights sequential similarity between Sct4_Prx1 and Sct4_Prx6 MISST groups.
A representative network shows all proteins identified by the six MISST groups, with one representative per 55% sequentially identical cluster. The nodes in the representative network are colored by MISST group (see legend), and the edges represent pairwise BLAST scores between the representative proteins. The network is shown with no edge value threshold (A), and e-value thresholds of 1e-20 (B), 1e-30 (C), and 1e-40 (D), where all edges with scores greater than the threshold are removed prior to applying the force-directed layout. Network visualizations were created with Cytoscape.

References

    1. Dubuisson M, Vander Stricht D, Clippe A, Etienne F, Nauser T, Kissner R, et al. Human peroxiredoxin 5 is a peroxynitrite reductase. FEBS Lett. 2004;571: 161–165. 10.1016/j.febslet.2004.06.080 - DOI - PubMed
    1. Flohé L, Toppo S, Cozza G, Ursini F. A comparison of thiol peroxidase mechanisms. Antioxid Redox Signal. 2011;15: 763–780. 10.1089/ars.2010.3397 - DOI - PubMed
    1. Poole LB. The catalytic mechanism of peroxiredoxins In: Flohé L, Harris JR, editors. Peroxiredoxin systems. New York: Springer; 2007. pp. 61–81.
    1. Fisher AB. Peroxiredoxin 6: a bifunctional enzyme with glutathione peroxidase and phospholipase A₂ activities. Antioxid Redox Signal. 2011;15: 831–844. 10.1089/ars.2010.3412 - DOI - PMC - PubMed
    1. Knoops B, Goemaere J, Van der Eecken V, Declercq J-P. Peroxiredoxin 5: structure, mechanism, and function of the mammalian atypical 2-Cys peroxiredoxin. Antioxid Redox Signal. 2011;15: 817–829. 10.1089/ars.2010.3584 - DOI - PubMed

Publication types

LinkOut - more resources