

Assessing the short term impact of air pollution on mortality: a matching approach
- PMID: 28187788
- PMCID: PMC5303266
- DOI: 10.1186/s12940-017-0215-7
Assessing the short term impact of air pollution on mortality: a matching approach
Abstract
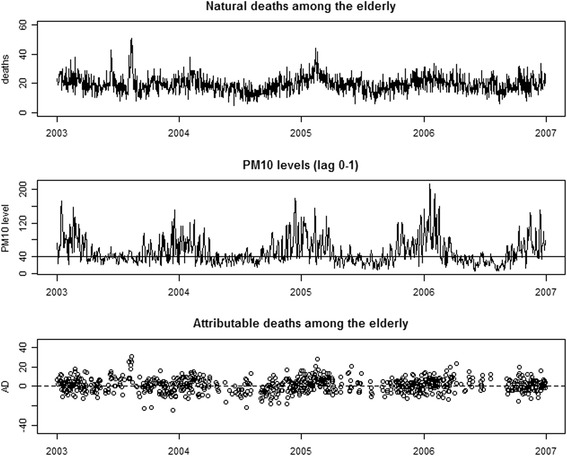
Background: The opportunity to assess short term impact of air pollution relies on the causal interpretation of the exposure-response association. However, up to now few studies explicitly faced this issue within a causal inference framework. In this paper, we reformulated the problem of assessing the short term impact of air pollution on health using the potential outcome approach to causal inference. We considered the impact of high daily levels of particulate matter ≤10 μm in diameter (PM10) on mortality within two days from the exposure in the metropolitan area of Milan (Italy), during the period 2003-2006. Our research focus was the causal impact of a hypothetical intervention setting daily air pollution levels under a pre-fixed threshold.
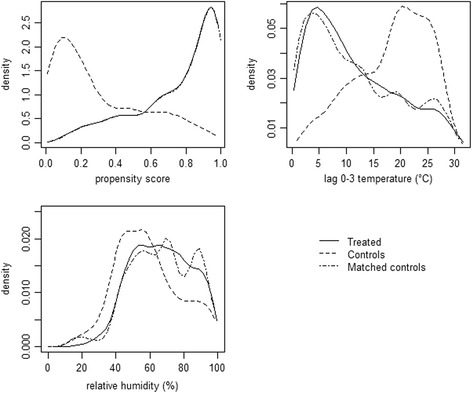
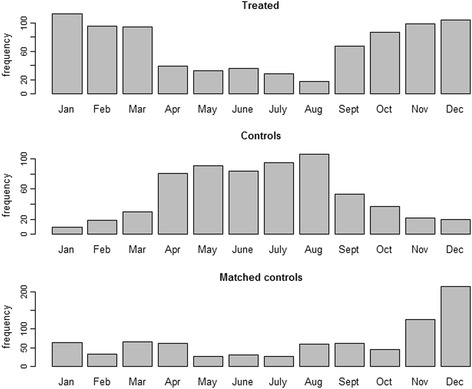
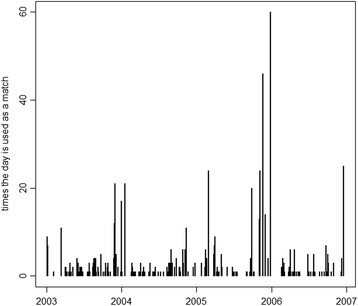
Methods: We applied a matching procedure based on propensity score to estimate the total number of attributable deaths (AD) during the study period. After defining the number of attributable deaths in terms of difference between potential outcomes, we used the estimated propensity score to match each high exposure day, namely each day with a level of exposure higher than 40 μg/m3, with a day with similar background characteristics but a level of exposure lower than 40 μg/m3. Then, we estimated the impact by comparing mortality between matched days.
Results: During the study period daily exposures larger than 40 μg/m3 were responsible for 1079 deaths (90% CI: 116; 2042). The impact was more evident among the elderly than in the younger age classes. Exposures ≥ 40 μg/m3 were responsible, among the elderly, for 1102 deaths (90% CI: 388, 1816), of which 797 from cardiovascular causes and 243 from respiratory causes. Clear evidence of an impact on respiratory mortality was found also in the age class 65-74, with 87 AD (90% CI: 11, 163).
Conclusions: The propensity score matching turned out to be an appealing method to assess historical impacts in this field, which guarantees that the estimated total number of AD can be derived directly as sum of either age-specific or cause-specific AD, unlike the standard model-based procedure. For this reason, it is a promising approach to perform surveillance focusing on very specific causes of death or diseases, or on susceptible subpopulations. Finally, the propensity score matching is free from issues concerning the exposure-confounders-mortality modeling and does not involve extrapolation. On the one hand this enhances the internal validity of our results; on the other, it makes the approach scarcely appropriate for estimating future impacts.
Keywords: Air pollution; Attributable deaths; Causal inference; Health impact assessment; Matching; Mortality; Potential outcomes; Propensity score; Short term effect; Unconfoundedness.
Figures
References
-
- Martuzzi M, Mitis F, Iavarone I, Serinelli M. Health Impact of PM10 and Ozone in 13 Italian Cities. Copenhagen: World Health Organization Regional Office for Europe; 2006.
-
- Ballester F, Medina S, Boldo E, Goodman P, Neuberger M, Iñiguez C, et al. Reducing ambient levels of fine particulates could substantially improve health: a mortality impact assessment for 26 European cities. J Epidemiol Community Health. 2008;62(2):98–105. doi: 10.1136/jech.2007.059857. - DOI - PubMed
MeSH terms
Substances
LinkOut - more resources
Full Text Sources
Other Literature Sources
Medical
