. 2017 Apr;7(4):410-423.
doi: 10.1158/2159-8290.CD-16-1045. Epub 2017 Feb 10.

Interaction Landscape of Inherited Polymorphisms with Somatic Events in Cancer

Affiliations

Interaction Landscape of Inherited Polymorphisms with Somatic Events in Cancer

Hannah Carter et al. Cancer Discov. 2017 Apr.

Abstract

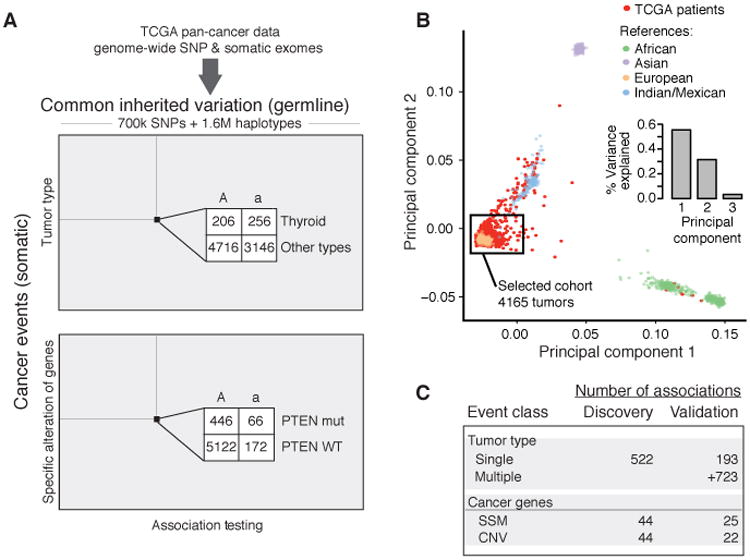
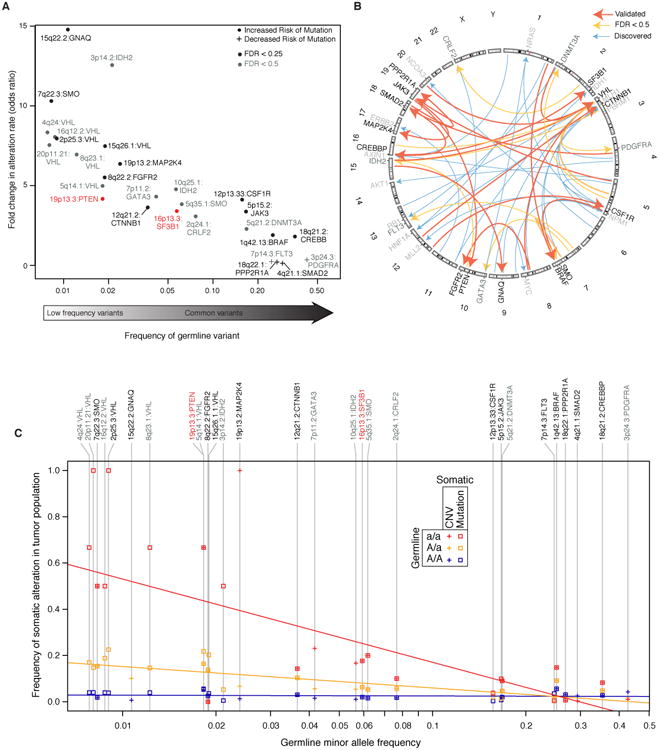
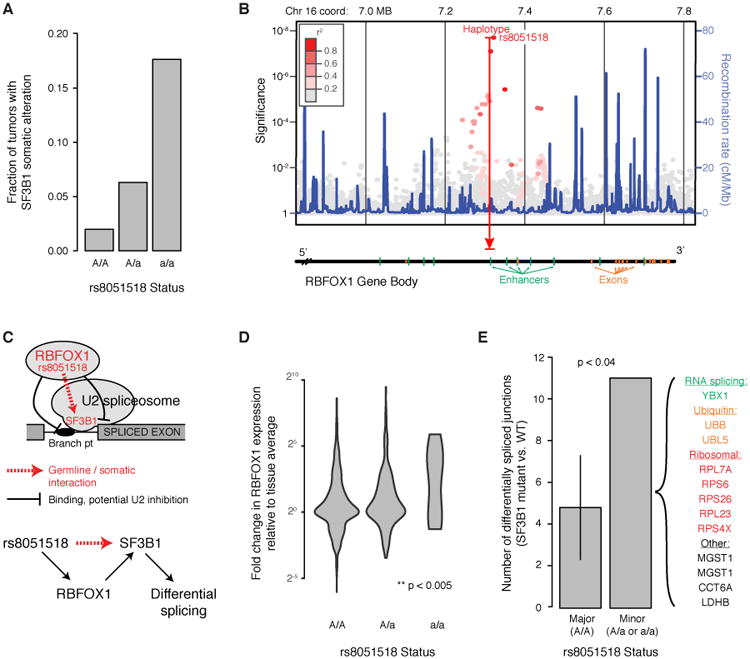
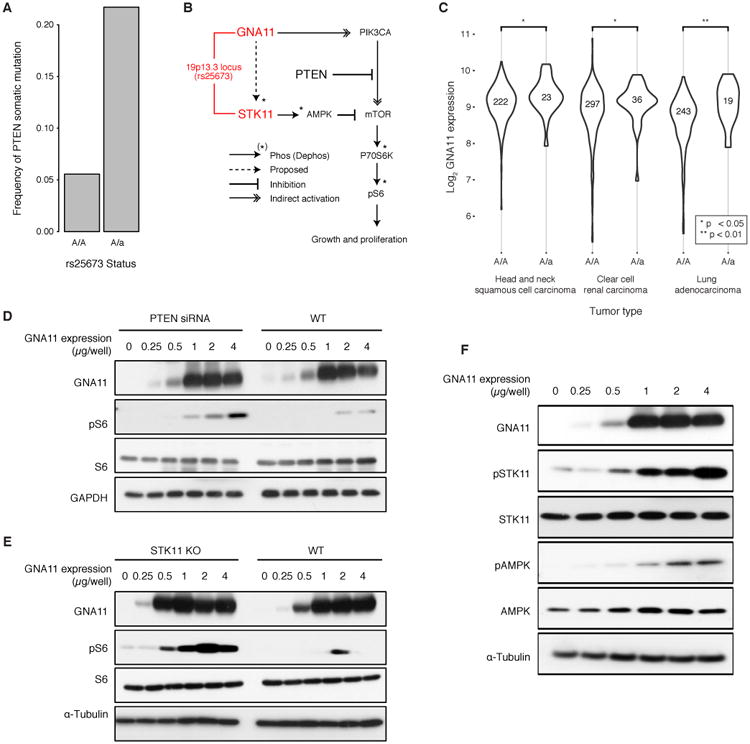
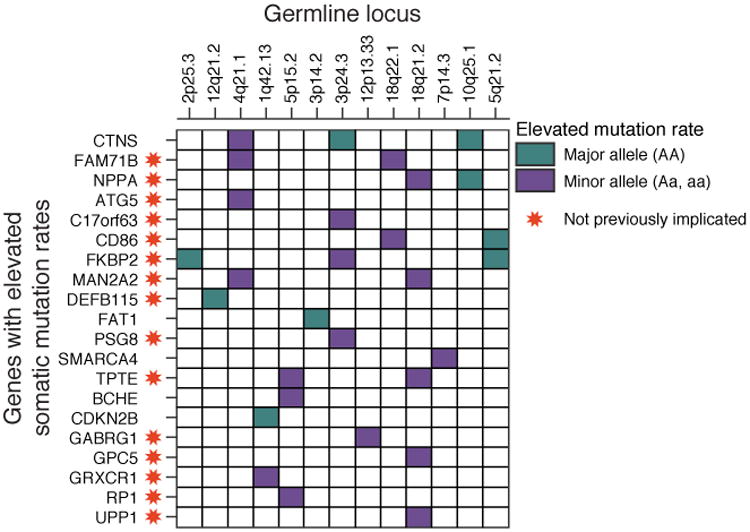
Recent studies have characterized the extensive somatic alterations that arise during cancer. However, the somatic evolution of a tumor may be significantly affected by inherited polymorphisms carried in the germline. Here, we analyze genomic data for 5,954 tumors to reveal and systematically validate 412 genetic interactions between germline polymorphisms and major somatic events, including tumor formation in specific tissues and alteration of specific cancer genes. Among germline-somatic interactions, we found germline variants in RBFOX1 that increased incidence of SF3B1 somatic mutation by 8-fold via functional alterations in RNA splicing. Similarly, 19p13.3 variants were associated with a 4-fold increased likelihood of somatic mutations in PTEN. In support of this association, we found that PTEN knockdown sensitizes the MTOR pathway to high expression of the 19p13.3 gene GNA11 Finally, we observed that stratifying patients by germline polymorphisms exposed distinct somatic mutation landscapes, implicating new cancer genes. This study creates a validated resource of inherited variants that govern where and how cancer develops, opening avenues for prevention research.Significance: This study systematically identifies germline variants that directly affect tumor evolution, either by dramatically increasing alteration frequency of specific cancer genes or by influencing the site where a tumor develops. Cancer Discovery; 7(4); 410-23. ©2017 AACR.See related commentary by Geeleher and Huang, p. 354This article is highlighted in the In This Issue feature, p. 339.


Conflict of interest statement

COI Disclosure Statement: The authors declare no potential conflicts of interest.

Figures

Fig. 1
Fig. 1
Study design and data. A) 2.3 million germline markers comprising 700K SNPs and 1.6 million multi-SNP haplotypes were tested for association with primary tumor type and somatic mutation status of 138 known cancer genes. B) Principal Components Analysis of TCGA European ancestry samples with HapMap III was used to evaluate population substructure. The first two principal components explain 87% of the variation in genotype among samples. A black box frames the 4165 samples used for the discovery cohort. C) Summary of association results from the discovery phase (P < 10-5) along with the subset of these observed at an FDR < 0.5 in the validation phase. Counts are provided for each class of somatic event. Markers detected at and FDR < 0.50 or lower are also reported in Supplementary Tables 3 and 5. SSM – subtle somatic mutation, CNV – copy number variant.
Fig. 2
Fig. 2
Germline variants influencing primary tumor type. A) Ideogram of all loci associated with a single tumor type (blue triangles). Red triangles indicate an association with the specific somatic alteration of a cancer gene. B) Manhattan (LocusZoom) plot (78) displaying markers at 8q24.13 associated with incidence of breast cancer. Markers are colored according to linkage disequilibrium (r2 values) derived from the 1000 Genomes European samples. C) Markers at 8q24.13 also associated with age of diagnosis with breast cancer. A/A indicates individuals homozygous for the major allele and A/a, a/a indicate individuals with one or more copies of the minor allele. D) Quantile-quantile plot showing the observed p-values of association (versus random expectation) for 557 loci associated with cancer risk in previous studies. The substantial elevation above the diagonal (red) indicates support for many of these previous loci in the present TCGA analysis. E) Manhattan plot displaying markers at 9q22.23 associated with thyroid carcinoma and genes encoded within that region. Colored genes were found to have altered expression in Thyroid tumors in the presence of the minor allele. F) Mean expression of genes highlighted in panel (E) versus the number of minor alleles. Bars show standard error on mean estimates.
Fig. 3
Fig. 3
Germline interactions with somatic alteration of specific cancer genes. A) Overview of all potentially interesting (FDR < 0.5; dark grey labels) and validated (FDR < 0.25; black labels) associations of this class, displayed according to the effect size (increase in alteration rate, y-axis) versus the frequency of the germline minor allele (x-axis). We see large effects (from 2-14 fold changes in alteration rate) and an inverse relationship between the magnitude of this effect and the minor allele frequency. Validated loci associated with PTEN mutation and SF3B1 mutation (red) are highlighted in the main text and subsequent figures. B) A Circos plot (80) depicting germline-somatic interactions discovered (blue arrows) and replicated in the validation cohort (orange arrows for FDR < 0.5 and red arrows for FDR < 0.25). C) For each somatically altered gene in (A), the alteration rate is plotted separately for patients with each associated genotype (homozygous major allele, AA; heterozygous, Aa; homozygous minor allele, aa) as a function of the minor allele frequency. Regression lines show the trends for each genotype: homozygous minor allele (red), heterozygous minor allele (orange) and homozygous major allele (green).
Fig. 4
Fig. 4
Potentiating SF3B1 mutation through 16p13 germline variation. A) Increase in SF3B1 somatic mutation rate with the rs8051518 minor allele at 16p13. B) Manhattan plot of germline association with SF3B1 mutation rate across this locus, which encodes the single gene RBFOX1. C) Current model by which RBFOX1 functionally interacts with SF3B1 to regulate RNA splicing. D) RBFOX1 increases in mRNA expression in the presence of the rs8051518 minor allele. Analysis is across all TCGA tissues, normalizing for mean expression within each tissue type. E) The number of differentially spliced exon-exon junctions was compared between individuals homozygous for the rs8051518 major allele and those harboring one or more copies of the minor allele. The number of differentially spliced junctions in each group was determined by comparing tumors with WT SF3B1 to tumors with mutant SF3B1. For correct comparison, individuals with the major allele are subsampled so that this cohort is the same size as that of the minor allele (43 individuals, error bar shows ±2σ).
Fig. 5
Fig. 5
Potentiating PTEN mutation through 19p13 germline variation. A) Increase in PTEN somatic mutation rate depending on the rs25673 minor allele at 19p13. Among the genes encoded at this locus, GNA11 and STK11 function in the mTOR signaling pathway with PTEN. B) Current model in which mTOR signaling, as measured by phospho-S6 (pS6), is activated by GNA11 and repressed by PTEN and STK11. C) GNA11 increases in mRNA expression in the presence of the minor allele in lung adenocarcinoma, renal clear cell carcinoma and head and neck squamous cell carcinoma. D-E) Exogenous control of GNA11 expression regulates mTOR signaling as measured by pS6. The relationship between GNA11 and pS6 is exposed by either D) PTEN knockdown by siRNA or E) STK11 knockout by CRISPR/Cas9. F) Increased expression of GNA11 results in increased phosphorylation of STK11 with concomitant increase in phosphorylated AMPK.
Fig. 6
Fig. 6
Comprehensive screen for genes with elevated somatic alteration rates, conditioned on germline minor allele status. MutSigCV analysis identified multiple genes with an elevated mutation rate in the presence of the minor allele at 13 loci that were found to influence the somatic alteration rate of a known cancer gene. Among the genes identified, 15 had not previously been identified as frequently mutated genes in cancer (red stars).

Comment in

References

    1. Stratton MR, Campbell PJ, Futreal PA. The cancer genome. Nature. 2009;458(7239):719–24. doi: 10.1038/nature07943. - DOI - PMC - PubMed
    1. Vogelstein B, Papadopoulos N, Velculescu VE, Zhou S, Diaz LA, Jr, Kinzler KW. Cancer genome landscapes. Science. 2013;339(6127):1546–58. doi: 10.1126/science.1235122. - DOI - PMC - PubMed
    1. Collins FS, Barker AD. Mapping the cancer genome Pinpointing the genes involved in cancer will help chart a new course across the complex landscape of human malignancies. Sci Am. 2007;296(3):50–7. - PubMed
    1. Hudson TJ, Anderson W, Artez A, Barker AD, Bell C, Bernabe RR, et al. International network of cancer genome projects. Nature. 2010;464(7291):993–8. doi: 10.1038/nature08987. - DOI - PMC - PubMed
    1. Hofree M, Carter H, Kreisberg J, Bandyopadhyay S, Mischel P, Friend S et al. Challenges in identifying cancer genes by analysis of exome sequencing data. Volume In Press: Nature Communications. 2016 - PMC - PubMed