. 2017 Apr;205(4):1677-1689.
doi: 10.1534/genetics.116.196154. Epub 2017 Feb 10.

Elevated Rate of Genome Rearrangements in Radiation-Resistant Bacteria

Affiliations

Elevated Rate of Genome Rearrangements in Radiation-Resistant Bacteria

Jelena Repar et al. Genetics. 2017 Apr.

Abstract

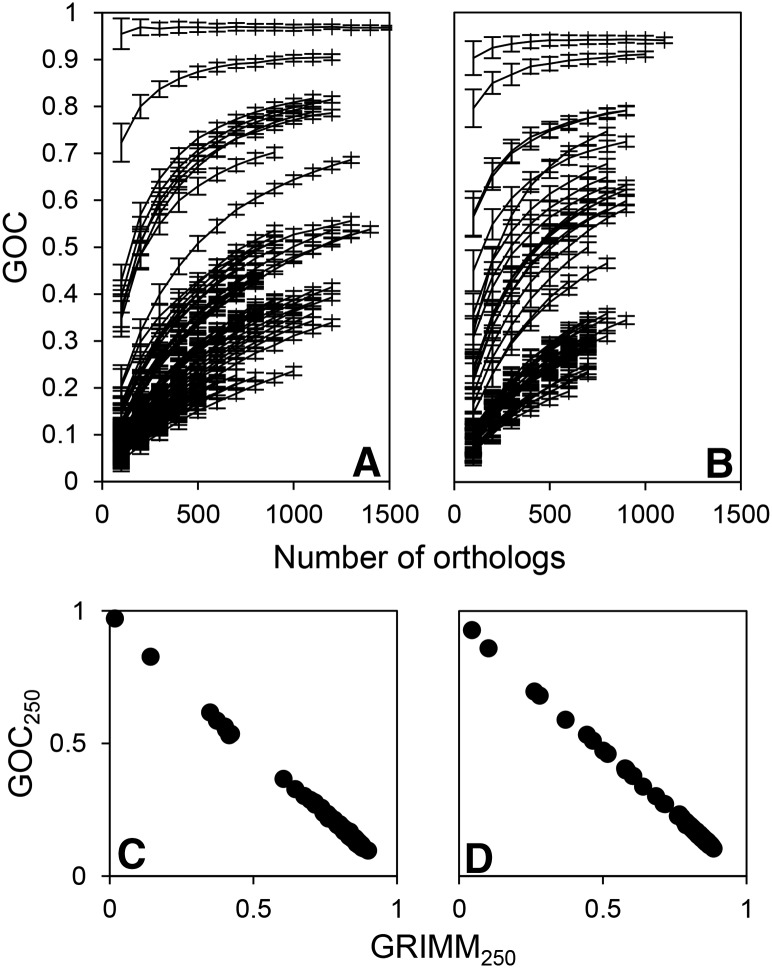
A number of bacterial, archaeal, and eukaryotic species are known for their resistance to ionizing radiation. One of the challenges these species face is a potent environmental source of DNA double-strand breaks, potential drivers of genome structure evolution. Efficient and accurate DNA double-strand break repair systems have been demonstrated in several unrelated radiation-resistant species and are putative adaptations to the DNA damaging environment. Such adaptations are expected to compensate for the genome-destabilizing effect of environmental DNA damage and may be expected to result in a more conserved gene order in radiation-resistant species. However, here we show that rates of genome rearrangements, measured as loss of gene order conservation with time, are higher in radiation-resistant species in multiple, phylogenetically independent groups of bacteria. Comparison of indicators of selection for genome organization between radiation-resistant and phylogenetically matched, nonresistant species argues against tolerance to disruption of genome structure as a strategy for radiation resistance. Interestingly, an important mechanism affecting genome rearrangements in prokaryotes, the symmetrical inversions around the origin of DNA replication, shapes genome structure of both radiation-resistant and nonresistant species. In conclusion, the opposing effects of environmental DNA damage and DNA repair result in elevated rates of genome rearrangements in radiation-resistant bacteria.

Keywords: Deinococcus radiodurans; gamma radiation; gene order; genome stability; synteny.


Figures

Figure 1
Figure 1
We used two different estimates of rearrangement distance between genomes: GOC (based on the portion of ortholog neighbors between which no breakpoint has been introduced) and GRIMM (based on the number of steps needed to transform gene order of one genome into another by inversions). A pair of genomes with an identical sequence of orthologs have GOC of 1 and GRIMM of 0. Shown is the dependence of GOC on the number of (randomly subsampled) orthologs for genome pairs in (A) D_radiodurans and (B) T_gammatolerans data sets. Each data point is based on 100 resamplings from the detected ortholog pool shared by two genomes. Error bars represent SD of GOC. Also shown is the relationship of the two estimates of rearrangement distance calculated from random ortholog subsets (GOC250 and GRIMM250, see main text) for (C) D_radiodurans and (D) T_gammatolerans data sets.
Figure 2
Figure 2
(A) Loss of gene order conservation (GOC250) with time (time is estimated through 16S rRNA distance, in nucleotide substitutions per site). Different data sets are shown in different colors and have different rates of GOC250 change, implying different rates of genome rearrangements. GOC250 quantifies rearrangements between pairs of genomes through the change of gene order; two genomes with an identical sequence of orthologs have GOC250 of 1. As the order of orthologs between two species diverges through time, GOC250 decreases toward 0, because it represents the gene order conservation, i.e., the portion of ortholog neighbors between which no breakpoint has been introduced. (B) To further investigate differences in genome rearrangement rates between data sets, we calculated stability indices for each species. Each species participates in multiple GOC250-16S rRNA distance points. Genome-stability index for a species shows average deviation of these points from the typical group rearrangement dynamics, represented here by “modelAll” in (A). Therefore, stability indices represent deviation of observed GOC250 from the expected GOC250 at a given divergence time point (if there was no deviation, stability index would be 0, whereas the genome stability index of 0.1 means that 10% of the ortholog neighbors that would be expected to have a breakpoint between them are, instead, preserved). Genome stability indices in plot (B) are grouped by data set. The vertical lines in (B) show significantly different means of genome-stability indices as compared by Tukey–Kramer HSD test (at α = 0.05). (C) Independent model fits for different data sets further characterize the different dynamics of accumulation of genome rearrangements for each of the data sets. Parameters of all the fits of the model in Equation 1 to different (sub-) sets of data and their confidence intervals are given in Table S3 in File S1. For comparison of rearrangement dynamics, at each 16S rRNA distance between two species one can read out the GOC250 values to estimate the portion of still-contiguous orthologs. For example, at the 16S rRNA distance of 0.075, the typical GOC250 predicted by the model for slow rearranging E_faecium data set and fast rearranging C_thermalis data set is 0.383 and 0.108, respectively. Therefore, at this divergence time point the portion of nonrearranged ortholog neighbors is 3.5 times lower in a typical E_faecium genome than in a typical C_thermalis genome.
Figure 3
Figure 3
Loss of gene order conservation (GOC250) with time, for D_radiodurans data set (time is estimated through 16S rRNA distance, expressed in nucleotide substitutions per site). Each point represents a genome pair; the three categories of points (shown in different colors) were defined by radiation resistance (R) or nonresistance (N) of species in the genome pair. Model describing the R-R category of points is shown in black, the R-N category in red, and the N-N category in blue. The steeper the decline of the model fits, the higher the rate of rearrangements. At each 16S rRNA distance between two species one can read out the GOC250 values to estimate the portion of still-contiguous orthologs. For example, at the 16S rRNA distance of 0.075, the typical GOC250 predicted by the models for R-R and N-N category of points is 0.174 and 0.457, respectively. Therefore, at this divergence time point, the portion of nonrearranged ortholog neighbors is 2.6 times lower in a typical radiation-resistant species than in a typical nonresistant species. (Inset) Rearrangement dynamics of the whole D_radiodurans group is described by the model fit to all the GOC250 16S rRNA distance points in the data set; this model was used for calculation of genome-stability indices for the statistical comparison of radiation-resistant and nonresistant species and as a reference for statistical comparison of residuals of different categories of points, as described in main text.
Figure 4
Figure 4
Loss of gene order conservation (GOC250) with time, for six data sets noted in the top right corner of each plot (time is estimated through 16S rRNA distance, expressed in nucleotide substitutions per site). Each point represents a genome pair; the three categories of points, shown in different colors, were defined by radiation resistance (R) or nonresistance (N) of species in the genome pair. Model describing the R-R category of points is shown in black, the R-N category in red, and N-N category in blue. Faster decline of the model fits signifies higher rate of genome rearrangement.
Figure 5
Figure 5
Maximum likelihood trees obtained from 16S rRNA alignments for data sets (A) D_radiodurans, (B) P_arcticum, and (C) E_faecium. (A) D_radiodurans tree contains four additional species from a different phylum (Anaeromyxobacter dehalogenans, A. sp. K, Desulfobacca acetoxidans, and Syntrophobacter fumaroxidans). Branches with radiation-resistant species are marked with gray boxes. Full species names are given in Table S2 in File S1.
Figure 6
Figure 6
Dot plots show positions of homologous sequences between pairs of genomes (in base pairs, where M denotes 1 million). Homologous sequences between two genomes are represented by MUMs (see Methods). Shown are positions of MUMs identified between the forward conformation of the genome on the x-axis and the forward conformation of the genome on the y-axis (black •), or the reverse conformation of the genome on the y-axis (gray •). Only the largest genome element is shown for the multi-element genomes (see Methods). Each column represents one data set; for each data set shown, the first plot is a MUM alignment of two radiation-resistant genomes, and the second plot a MUM alignment of two nonresistant genomes.

References

    1. Abomohra A. E.-F., El-Shouny W., Sharaf M., Abo-Eleneen M., 2016. Effect of gamma radiation on growth and metabolic activities of Arthrospira platensis. Braz. Arch. Biol. Technol. 59: e16150476.
    1. Achaz G., Coissac E., Netter P., Rocha E. P. C., 2003. Associations between inverted repeats and the structural evolution of bacterial genomes. Genetics 164: 1279–1289. - PMC - PubMed
    1. Achaz G., Boyer F., Rocha E. P. C., Viari A., Coissac E., 2007. Repseek, a tool to retrieve approximate repeats from large DNA sequences. Bioinformatics 23: 119–121. - PubMed
    1. Aguileta G., de Vienne D. M., Ross O. N., Hood M. E., Giraud T., et al. , 2014. High variability of mitochondrial genome order among fungi. Genome Biol. Evol. 6: 451–465. - PMC - PubMed
    1. Albuquerque L., Simoes C., Nobre M. F., Pino N. M., Battista J. R., et al. , 2005. Truepera radiovictrix gen. nov., sp. nov., a new radiation resistant species and the proposal of Trueperaceae fam. nov. FEMS Microbiol. Lett. 247: 161–169. - PubMed

Publication types