. 2017 Mar 6;216(3):675-693.
doi: 10.1083/jcb.201607019. Epub 2017 Feb 10.

CLUH regulates mitochondrial metabolism by controlling translation and decay of target mRNAs

Affiliations

CLUH regulates mitochondrial metabolism by controlling translation and decay of target mRNAs

Désirée Schatton et al. J Cell Biol. .

Abstract

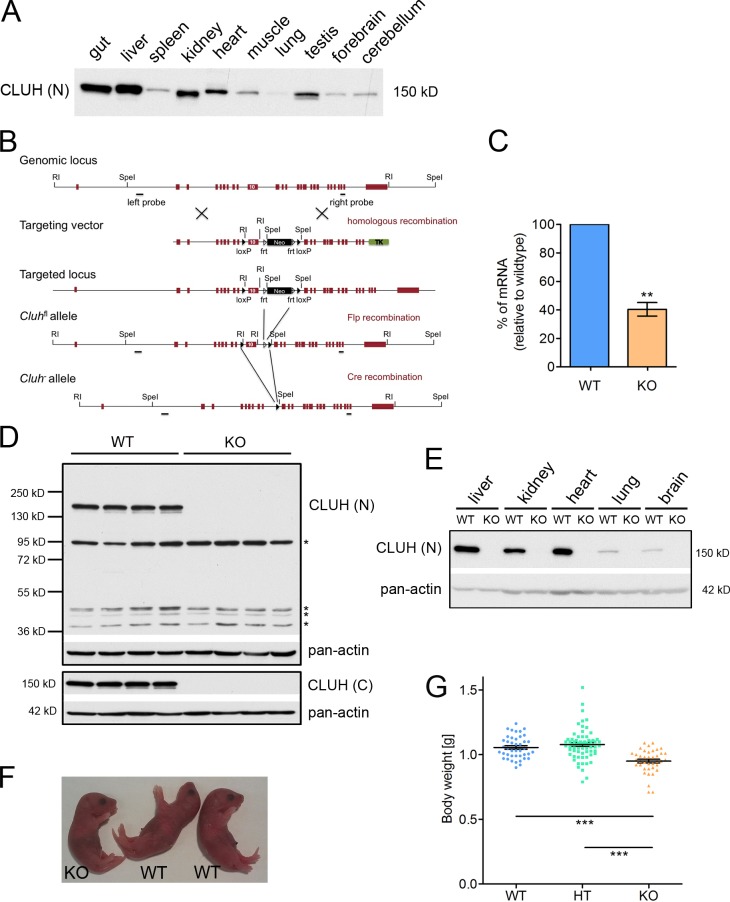
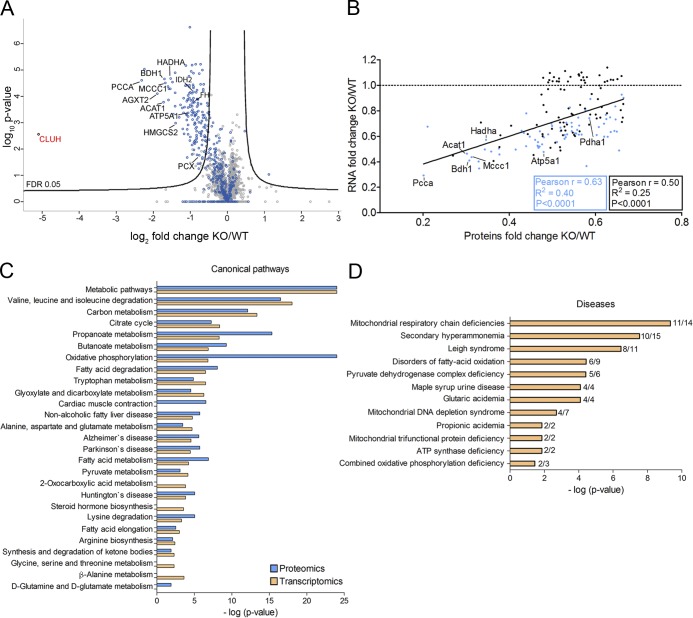
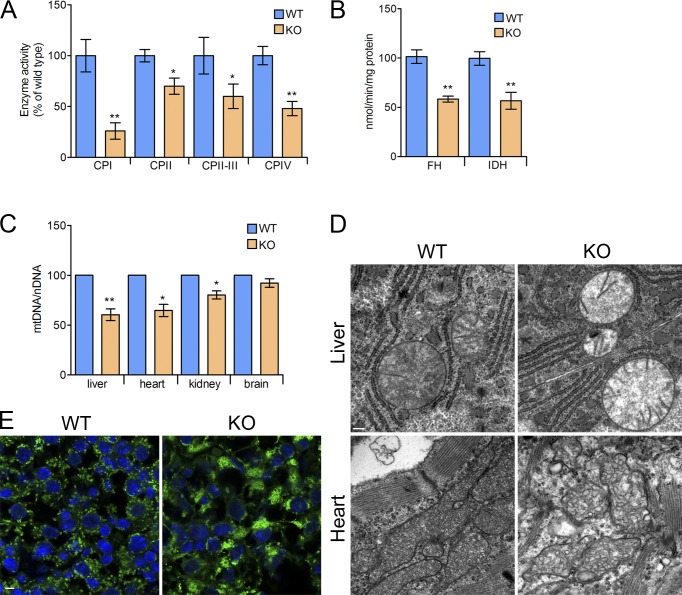
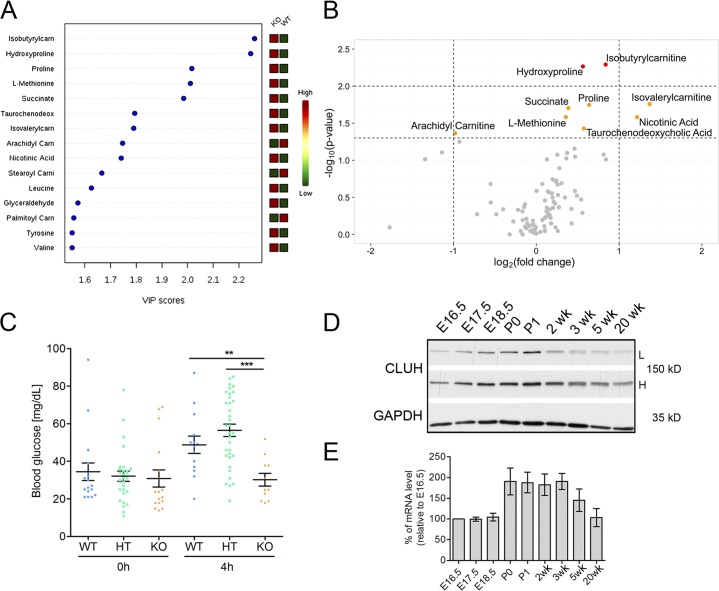
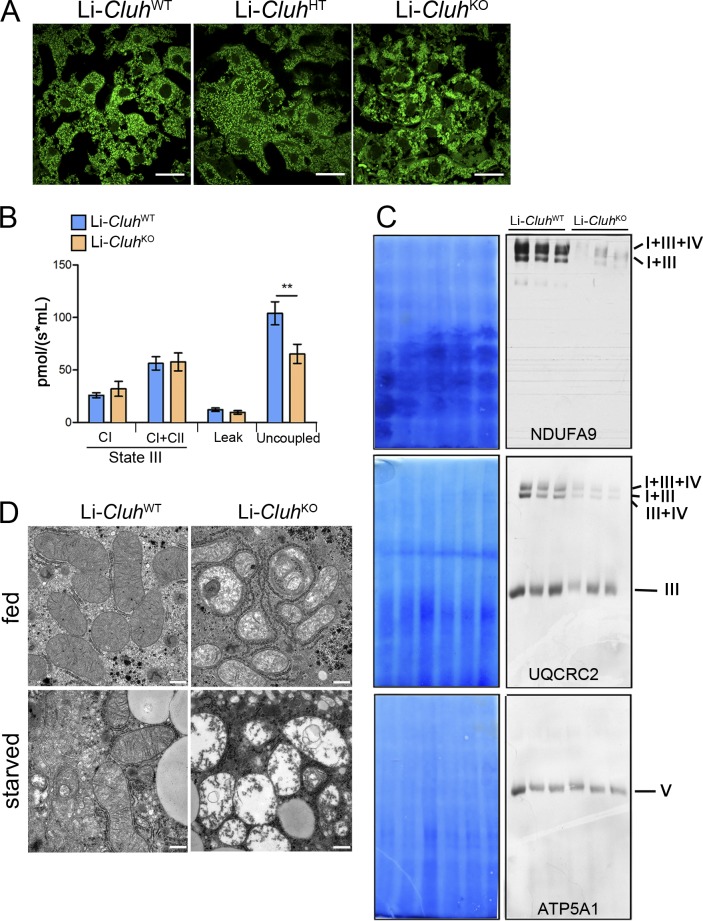
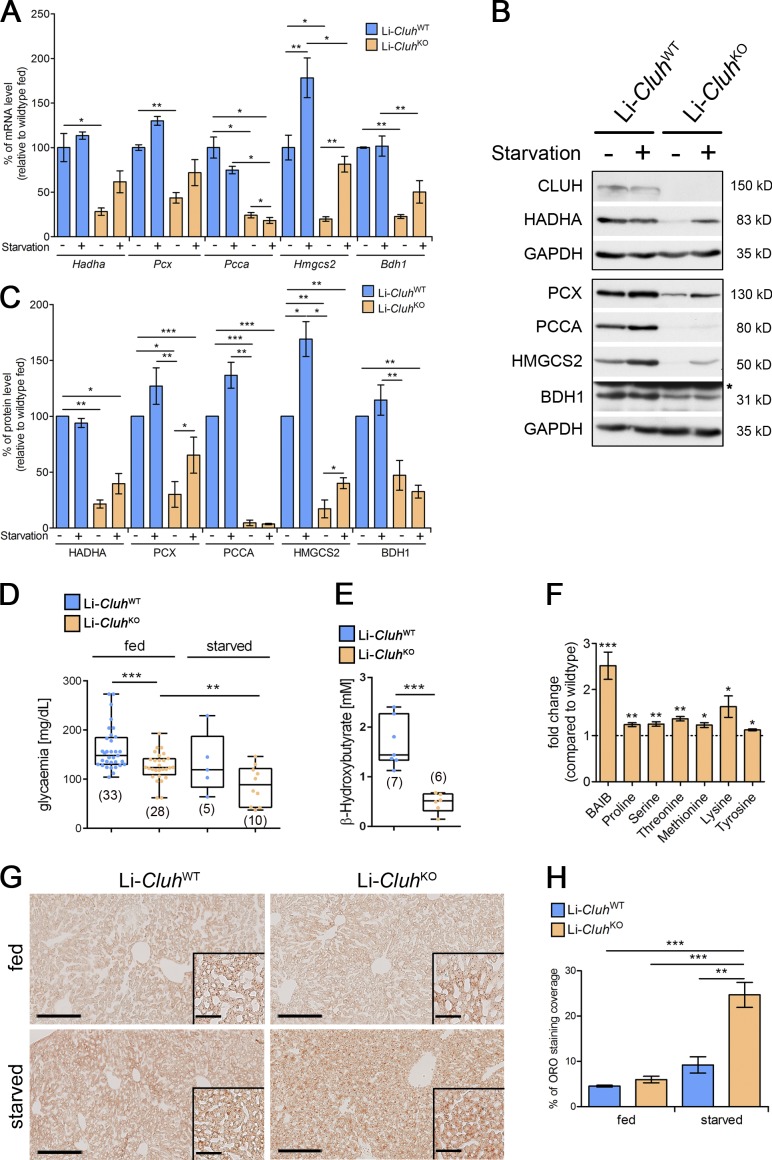
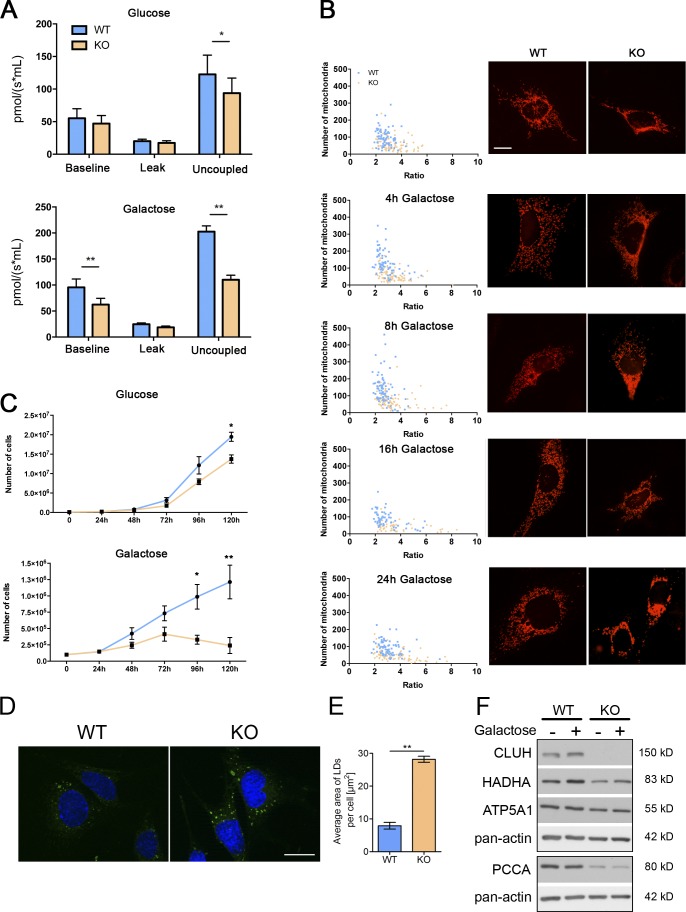
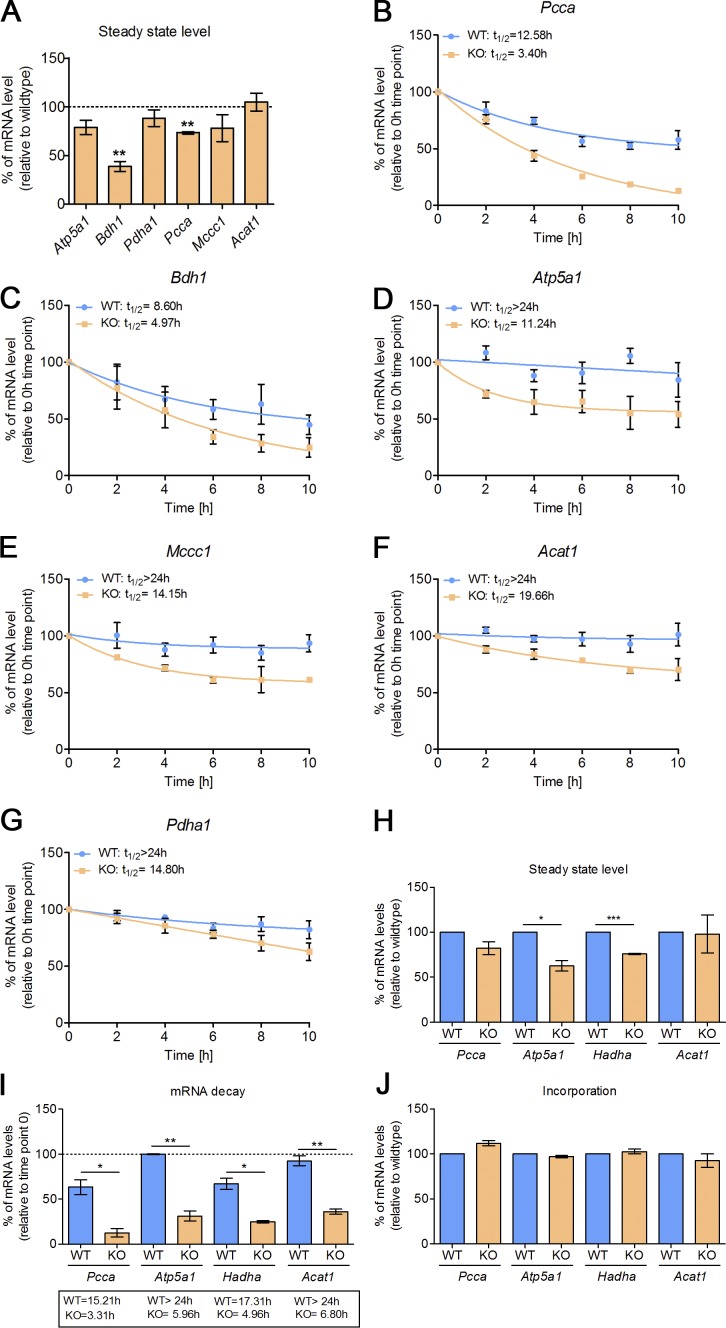
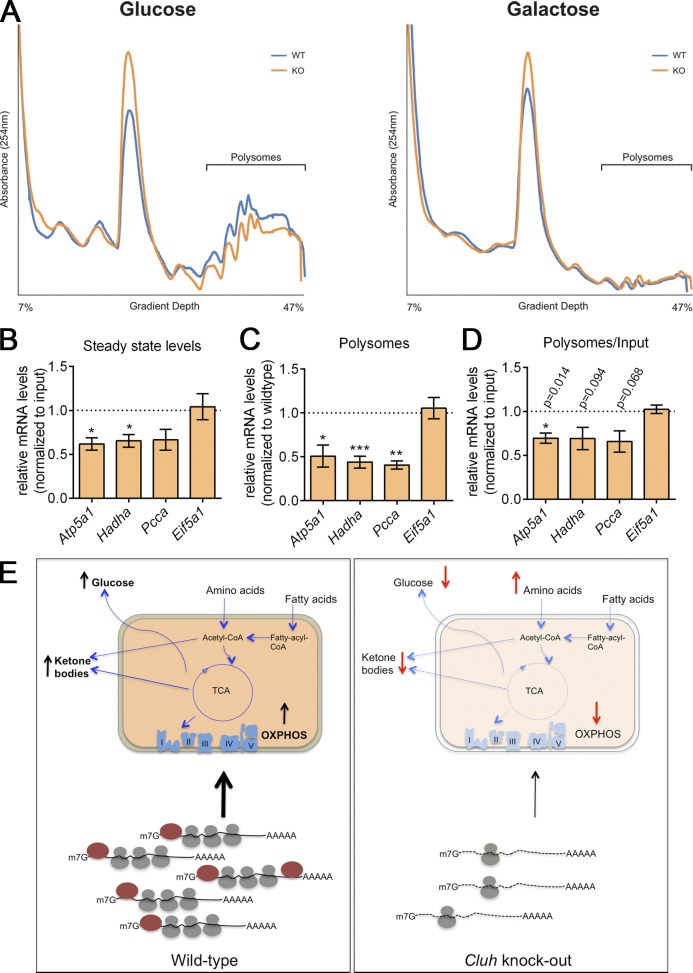
Mitochondria are essential organelles that host crucial metabolic pathways and produce adenosine triphosphate. The mitochondrial proteome is heterogeneous among tissues and can dynamically change in response to different metabolic conditions. Although the transcriptional programs that govern mitochondrial biogenesis and respiratory function are well known, posttranscriptional regulatory mechanisms remain unclear. In this study, we show that the cytosolic RNA-binding protein clustered mitochondria homologue (CLUH) regulates the expression of a mitochondrial protein network supporting key metabolic programs required under nutrient deprivation. CLUH exerts its function by controlling the stability and translation of target messenger RNAs. In the absence of Cluh, mitochondria are severely depleted of crucial enzymes involved in catabolic energy-converting pathways. CLUH preserves oxidative mitochondrial function and glucose homeostasis, thus preventing death at the fetal-neonatal transition. In the adult liver, CLUH ensures maximal respiration capacity and the metabolic response to starvation. Our results shed new light on the posttranscriptional mechanisms controlling the expression of mitochondrial proteins and suggest novel strategies to tailor mitochondrial function to physiological and pathological conditions.


Figures

Figure 1.
Figure 1.
Generation and characterization of Cluh−/− mice. (A) CLUH expression in murine tissues at 5 wk of age. (B) The genomic locus of the Cluh gene, the targeting vector, and the resulting floxed (fl) and Cluh alleles are depicted. Exons are represented as red boxes. frt, Flp recognition target site; RI, EcoRI. (C) Percentage of Cluh mRNA in KO livers relative to WT determined by quantitative RT-PCR. n = 4. **, P ≤ 0.01 (two-tailed t test). (D) Immunoblot of whole-liver lysates of E18.5 neonates probed with anti-CLUH antibodies against N-terminal (N) or C-terminal (C) epitopes. Asterisks denote unspecific signals. (E) Immunoblot of WT and KO tissues at E18.5 probed for CLUH. (D and E) Pan-actin was used as a loading control. (F) Representative picture of WT and KO mice at E18.5. (G) Body weight of WT (n = 42), HT (n = 68), and KO (n = 39) mice at E18.5. ***, P ≤ 0.001 (one-way analysis of variance). Graphs show means ± SEM.
Figure 2.
Figure 2.
Protein and transcript levels of a subset of nuclear-encoded mitochondrial proteins are down-regulated in Cluh−/− livers. (A) Volcano plot of proteomics analyses of livers of E18.5 KO mice compared with WT. Names are indicated for all proteins relevant in the following experiments. Blue dots are mitochondrial proteins according to Mitocarta 2.0; gray dots indicate nonmitochondrial proteins. (B) Correlation of the abundance of significantly down-regulated proteins (FC ≥1.5) with corresponding transcript levels. Previously identified CLUH targets (Gao et al., 2014) are indicated in blue. The black line shows correlation regression of all genes. The black box shows statistics for all genes, and the blue box shows statistics only for identified CLUH targets. Names are indicated for genes for which mRNA stability is measured in the following experiments. The dashed line marks an RNA FC of 1. (C) Significantly enriched pathways highlighted by proteomics (blue) and transcriptomics (orange) data. (D) Disease implication analysis of proteomics data. In C and D, bars indicate log of p-values.
Figure 3.
Figure 3.
Cluh deficiency affects respiratory function, mt-DNA content, distribution, and ultrastructure of mitochondria. (A) Enzymatic activities of respiratory chain complexes in KO liver lysates relative to WT samples at E18.5. (B) Enzymatic activities of fumarate hydratase (FH) and IDH in whole-liver lysates at E18.5. (C) Quantitative PCR on DNA extracted from whole tissues. Graphs show mt-DNA amount of KO samples relative to WT levels, calculated by normalizing mt-Co1 expression (mitochondrial encoded) to Rmrp expression (nuclear encoded) and show mean ± SEM. n = 4. *, P ≤ 0.05; **, P ≤ 0.01 (two-tailed t test). (D) Representative electron micrographs of livers (n = 5) and hearts (n = 3) of WT and KO neonates at E18.5. Bar, 0.2 µm. (E) Immunofluorescence of livers of WT and KO neonates at E18.5 stained with anti-TOMM20 (green) and DAPI (blue). n = 3. Bar, 10 µm.
Figure 4.
Figure 4.
Metabolic alterations and hypoglycemia in Cluh−/− mice. (A) Targeted metabolomics of liver samples from WT and KO mice obtained by C-section at E18.5 and starved for 4 h. Partial least squares discriminant analysis variable importance in projection (PLSDA-VIP) plot depicting the top-ranked metabolites that contributed to the separation of WT and KO. n = 7. (B) Volcano plot of analyzed metabolites showing those reaching statistical significance. Dashed lines on the x axis indicate a log2 (KO/WT FC) of 1 and −1, respectively. Dashed lines on the y axis mark p-values corresponding to 0.05 and 0.01. (C) Glycaemia of E18.5 neonates immediately after C-section (WT, n = 17; HT, n = 28; KO, n = 17) or after 4 h of starvation (WT, n = 14; HT, n = 34; KO, n = 11). Graph shows means ± SEM. **, P ≤ 0.01; ***, P ≤ 0.001 (one-way analysis of variance). (D) Representative immunoblot of whole-liver lysates of WT mice at different ages. n = 3. GAPDH was used as a loading control. L, low exposure; H, high exposure. (E) Expression of Cluh in the liver was quantified at different ages using quantitative RT-PCR. Expression was normalized to GAPDH levels. The graph shows percentages of mRNA relative to E16.5 samples. Error bars are SEM. n = 3.
Figure 5.
Figure 5.
Liver-specific Cluh deletion affects mitochondrial distribution and structure, assembled respiratory supercomplexes, and respiratory capacity. (A) Representative confocal images of livers of 8-wk-old mice of the indicated genotypes. To analyze mitochondrial morphology, mice were crossed with a stop-mito-YFP reporter line activated by Cre recombination. n = 4. Bars, 5 µm. (B) Oxygen consumption of mitochondria isolated from livers of 8-wk-old mice. State III respiration was measured in the presence of pyruvate, malate, glutamate, and ADP (complex I [CI]), followed by addition of succinate (complex I + complex II [CI + CII]). The proton leak was measured after addition of oligomycin, whereas maximal respiration was assessed by CCCP titration. n = 5. Graph shows means ± SEM. **, P ≤ 0.01 (two-tailed t test). (C) Blue-native–PAGE of digitonin-solubilized mitochondria isolated from the liver of mice with the indicated genotypes at 8 wk of age. Corresponding Coomassie stainings are shown. Supercomplexes were detected using antibodies against NDUFA9 (complex I) and UQCRC2 (complex III). ATP5A1 was used to detect complex V. (D) Representative electron micrographs showing mitochondrial structures in the livers of 8-wk-old mice either fed ad libitum or starved for 24 h. n = 3. Bars, 0.5 µm.
Figure 6.
Figure 6.
Cluh deletion in the adult liver impairs the metabolic response under starvation. (A) Quantitative RT-PCR of selected CLUH mRNA targets in the livers of 8-wk-old mice fed ad libitum or starved for 24 h. n = 3–4. Expression was normalized to GAPDH levels. Graph shows percentages of mRNA levels relative to WT fed samples. n = 4. (B) Representative immunoblots of selected CLUH mRNA targets in livers of 8-wk-old mice fed ad libitum or starved for 24 h. n = 3. GAPDH was used as a loading control. (C) Quantification of immunoblots shown in B. Graph shows percentages of protein levels relative to WT fed samples. n = 3. (D) Glycaemia of 8-wk-old mice fed ad libitum or starved for 24 h. (E) Serum levels of β-hydroxybutyrate after 24-h starvation of 8-wk-old mice. (D and E) Graphs show individual data points as boxplots. n values are indicated in parentheses. (F) Significantly changed amino acids and BAIB in serum of 8-wk-old mice starved for 24 h. Graph represents relative FC compared with WT samples (dashed line). n = 5. (G) Representative images of ORO staining in liver sections of 8-wk-old mice fed ad libitum or starved for 24 h. n = 4–6. Bars: (main images) 200 µm; (insets) 40 µm. (H) Quantification of ORO staining of 8-wk-old mice fed ad libitum or starved for 24 h. Graphs show means ± SEM. *, P ≤ 0.05; **, P ≤ 0.01; ***, P ≤ 0.001 (two-tailed t test).
Figure 7.
Figure 7.
Cluh-deficient MEFs mimic liver phenotypes. (A) Oxygen consumption of intact MEFs cultured in glucose or galactose medium. The proton leak was measured after the addition of oligomycin, whereas maximal respiration was assessed by CCCP titration. n ≥ 4. (B) Mitochondrial morphology in MEFs transfected with mito-mCherry. Graphs show the mean aspect ratio (area/perimeter) on the x axis and the number of mitochondria on the y axis for individual cells from three independent experiments. Right panels show representative images of mitochondrial morphology at the indicated time points. Bar, 12 µm. (C) Growth curves of MEFs cultured in glucose or galactose medium during five consecutive days. n = 3. (D) Representative images of LD staining in MEFs grown in glucose medium. Nuclei were stained with DAPI (blue), and LDs were stained with BODIPY 493/503 (green). Bar, 20 µm. (E) Quantification of LD staining shown in D. 50 cells were analyzed per genotype per experiment. Graph shows the mean area of LDs per cell. n = 3. (A, C, and E) Error bars are means ± SEM. *, P ≤ 0.05; ** P ≤ 0.01 (two-tailed t test). (F) Representative immunoblots of MEFs grown in glucose (−) or galactose (+) media for 20 h for selected CLUH mRNA targets. Pan-actin was used as a loading control. n = 3.
Figure 8.
Figure 8.
CLUH controls the stability of target mRNAs. (A) Steady-state levels of mRNAs of KO cells relative to WT cells (dashed line) from experiments shown in B–G at time point 0. (B–G) Nonlinear regression decay trendlines of indicated mRNAs at different time points after actinomycin D treatment in WT and KO MEFs relative to time point 0. Calculated half-lives are indicated. Expression was normalized to GAPDH levels. (H) Steady-state levels of the indicated mRNAs in KO cells relative to WT levels from the experiment shown in I and J at time point 0 of whole-cell RNA. (I) Relative mRNA levels of pulled-down EU-incorporated mRNAs after 10-h chase relative to the corresponding time point 0 (dashed line). *, P ≤ 0.05; **, P ≤ 0.01; ***, P ≤ 0.001 (two-tailed t test). Calculated half-lives are indicated. (J) Relative mRNA levels of pulled down EU-incorporated mRNAs at time point 0 of KO cells relative to WT levels. Expression was normalized to GAPDH levels. Graphs represent means ± SEM. n = 3.
Figure 9.
Figure 9.
CLUH regulates translation of Atp5a1, Hadha, and Pcca. (A) Representative graphs of polysome profilings of WT and KO MEFs grown in glucose or galactose media for 20 h. n ≥ 4. (B) Steady-state levels of the indicated mRNAs in KO cells relative to WT cells (dotted line) in cell inputs from the experiments in C and D. (C) Relative mRNA levels of the indicated genes in polysome fractions of KO MEFs relative to WT (dotted line). (D) Relative mRNA levels of the indicated genes in polysome fractions of KO MEFs relative to WT (dotted line) after normalization to corresponding inputs. Graphs represent means ± SEM. n = 4. *, P ≤ 0.05; **, P ≤ 0.01; ***, P ≤ 0.001 (two-tailed paired t test), unless otherwise indicated. Firefly luciferase mRNA was used as a spike-in control in B–D and mRNA levels were normalized to luciferase levels. (E) Models of the physiological and molecular roles of CLUH. In the cytoplasm, CLUH (dark red) binds to mRNAs encoding specific mitochondrial proteins and promotes their stability and translation. As a result, mitochondria are enriched in proteins implicated in the conversion of fatty acids and amino acids in energy under nutrient deprivation. In the absence of CLUH, mRNAs become unstable and are less translated. As a consequence of the mitochondrial proteome reshaping, up-regulation of OXPHOS, ketone body production, and gluconeogenesis are impaired.

References

    1. Anders S., and Huber W.. 2010. Differential expression analysis for sequence count data. Genome Biol. 11 10.1186/gb-2010-11-10-r106 - DOI - PMC - PubMed
    1. Barnes C.A. 1998. Upf1 and Upf2 proteins mediate normal yeast mRNA degradation when translation initiation is limited. Nucleic Acids Res. 26:2433–2441. 10.1093/nar/26.10.2433 - DOI - PMC - PubMed
    1. Bhattacharyya S.N., Habermacher R., Martine U., Closs E.I., and Filipowicz W.. 2006. Relief of microRNA-mediated translational repression in human cells subjected to stress. Cell. 125:1111–1124. 10.1016/j.cell.2006.04.031 - DOI - PubMed
    1. Calvo S.E., and Mootha V.K.. 2010. The mitochondrial proteome and human disease. Annu. Rev. Genomics Hum. Genet. 11:25–44. 10.1146/annurev-genom-082509-141720 - DOI - PMC - PubMed
    1. Calvo S.E., Clauser K.R., and Mootha V.K.. 2016. MitoCarta2.0: an updated inventory of mammalian mitochondrial proteins. Nucleic Acids Res. 44:1251–1257. 10.1093/nar/gkv1003 - DOI - PMC - PubMed

Publication types

LinkOut - more resources