. 2017 Mar 15;37(11):3085-3101.
doi: 10.1523/JNEUROSCI.2797-16.2017. Epub 2017 Feb 10.

Amygdalar Gating of Early Sensory Processing through Interactions with Locus Coeruleus

Affiliations

Amygdalar Gating of Early Sensory Processing through Interactions with Locus Coeruleus

Cynthia D Fast et al. J Neurosci. .

Abstract

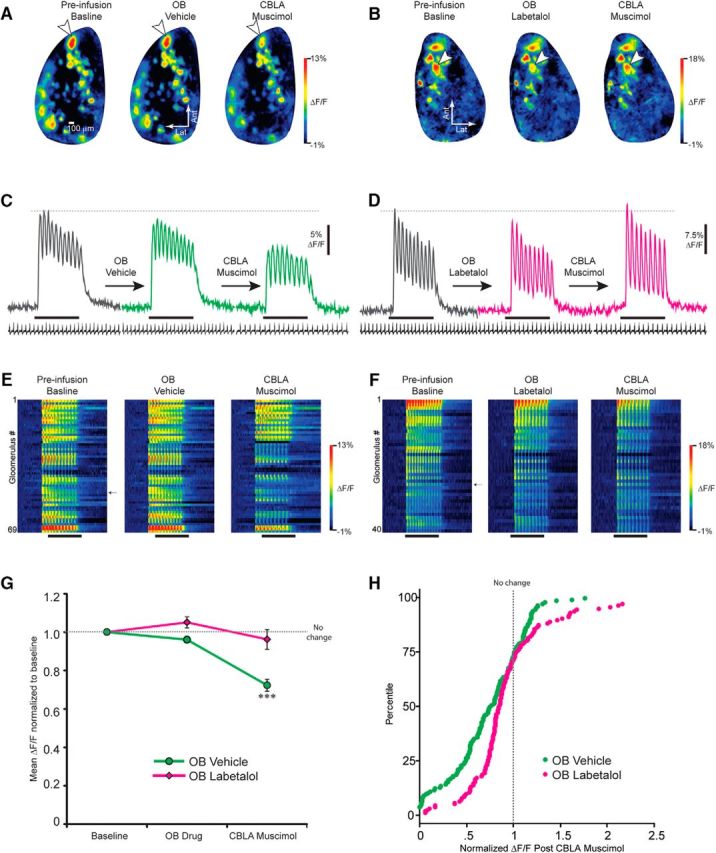
Fear- and stress-induced activity in the amygdala has been hypothesized to influence sensory brain regions through the influence of the amygdala on neuromodulatory centers. To directly examine this relationship, we used optical imaging to observe odor-evoked activity in populations of olfactory bulb inhibitory interneurons and of synaptic terminals of olfactory sensory neurons (the primary sensory neurons of the olfactory system, which provide the initial olfactory input to the brain) during pharmacological inactivation of amygdala and locus coeruleus (LC) in mice. Although the amygdala does not directly project to the olfactory bulb, joint pharmacological inactivation of the central, basolateral, and lateral nuclei of the amygdala nonetheless strongly suppressed odor-evoked activity in GABAergic inhibitory interneuron populations in the OB. This suppression was prevented by inactivation of LC or pretreatment of the olfactory bulb with a broad-spectrum noradrenergic receptor antagonist. Visualization of synaptic output from olfactory sensory neuron terminals into the olfactory bulb of the brain revealed that amygdalar inactivation preferentially strengthened the odor-evoked synaptic output of weakly activated populations of sensory afferents from the nose, thus demonstrating a change in sensory gating potentially mediated by local inhibition of olfactory sensory neuron terminals. We conclude that amygdalar activity influences olfactory processing as early as the primary sensory input to the brain by modulating norepinephrine release from the locus coeruleus into the olfactory bulb. These findings show that the amygdala and LC state actively determines which sensory signals are selected for processing in sensory brain regions. Similar local circuitry operates in the olfactory, visual, and auditory systems, suggesting a potentially shared mechanism across modalities.SIGNIFICANCE STATEMENT The affective state is increasingly understood to influence early neural processing of sensory stimuli, not just the behavioral response to those stimuli. The present study elucidates one circuit by which the amygdala, a critical structure for emotional learning, valence coding, and stress, can shape sensory input to the brain and early sensory processing through its connections to the locus coeruleus. One function of this interaction appears to be sensory gating, because inactivating the central, basolateral, and lateral nuclei of the amygdala selectively strengthened the weakest olfactory inputs to the brain. This linkage of amygdalar and LC output to primary sensory signaling may have implications for affective disorders that include sensory dysfunctions like hypervigilance, attentional bias, and impaired sensory gating.

Keywords: affective; amygdala; emotional; locus coeruleus; olfactory; sensory gating.


Figures

Figure 1.
Figure 1.
Inactivation of the amygdala inhibits GABAergic periglomerular interneuron populations in the olfactory bulb. A, Schematic illustration of the first stage of olfactory processing on the surface of the olfactory bulb. Axons terminals from OSNs located in the olfactory epithelium synapse onto mitral cells (which project to the olfactory cortex) and local interneurons, including periglomerular cells (green), within small spherical structures called glomeruli. Odor-evoked activity of olfactory bulb PG interneurons was visualized in transgenic mice that expressed the fluorescent calcium indicator GCaMP6f in GABAergic PG cells. B, Mice were implanted with bilateral cannulae targeting the central, basal, and lateral nuclei of the amygdala (CBLA), and odor-evoked activity of PG populations in individual glomeruli was observed through optical windows implanted over the olfactory bulbs. C, Infusing the GABAA agonist muscimol into the CBL amygdala produced a significant reduction (p < 0.001) in odor-evoked activity (red bars) both during the first sniff of odorant (left) and integrated over the full 6 s odorant presentation (right). Vehicle infusion into CBL amygdala produced a slight but significant increase in odor-evoked activity (green bars). Error bars represent the SEM. ***Statistically significant change from the preinfusion baseline at the p < 0.001 level. D, G, Pseudocolored activity maps showing the change in fluorescence of the olfactory bulb during the first inhalation of odorant before and after CBL amygdala infusions of vehicle (D) or muscimol (G). E, H, Traces indicating the change in fluorescence over time from the glomeruli indicated by arrows in D and G during odor presentations before (gray trace) and following CBL amygdala infusion of vehicle (E, green trace) or muscimol (H, red trace). Black bars indicate the delivery of odorant for 6 s. Small black traces indicate respiration frequency, with upticks reflecting inhalation. F, I, Pseudocolored heat maps depicting the change in fluorescence in all responsive glomeruli (along the ordinate) over time (on the abscissa) before and after vehicle (F) or muscimol (I) infusion into CBL amygdala for the example mouse shown in D and G. The arrows denote which line of each heat map corresponds to the glomeruli illustrated in D and G. Lat, Lateral; Ant, anterior.
Figure 2.
Figure 2.
Histological confirmation of CBL amygdala cannulation. A, Representative cannula placement and the diffusion pattern of BODIPY-tagged muscimol (orange; equivalent volume and rate of experimental solutions) in the left hemisphere of coronally sectioned (100 μm) tissue stained with DAPI (blue) at 4 × magnification. Although some backflow can be observed along the cannula tract, the diffusion pattern indicates that all subnuclei of the CeA [only the lateral CeA (CeL) and medial CeA (CeM) are labeled in the image], lateral nucleus (LA), and basolateral (BLA) nucleus of the amygdala were affected, while surrounding areas such as the dorsal endopiriform claustrum (DeN) and ventral endopiriform claustrum (VeN) were spared. B, C, Schematic illustration (as adapted from the study by Franklin and Paxinos, 2007) of the cannula placement and diffusion patterns observed across all mice that received CBL amygdala infusions. Orange circles indicate the centroid of diffusion observed in BODIPY-tagged muscimol. B, Coronal sections. Numbers indicate posterior distance from bregma. C, Horizontal sections. Numbers indicate ventral distance from skull. LV, lateral ventricle.
Figure 3.
Figure 3.
Inactivation of the locus coeruleus prevents the effect of CBL amygdala inactivation on PG cells. Transgenic mice expressing GCaMP6f in PG cells were each implanted with four cannulae, targeting the left and right LC and left and right CBL amygdala (CBLA). A, B, Pseudocolored activity maps showing the change in fluorescence of the olfactory bulb during the first inhalation of odorant before any infusion (left), after LC infusion (middle) of vehicle (A) or muscimol (B), and after subsequent CBL amygdala infusion of muscimol (right). C, D, Traces indicating the change in fluorescence over time from the glomeruli indicated by arrows in A and B during odor presentations before any infusion (gray trace), following LC infusion of vehicle (C, green trace) or muscimol (D, red trace), and after subsequent CBL amygdala infusion of muscimol (rightmost traces). Black bars indicate the delivery of odorant for 6 s. Small black traces indicate respiration frequency, with upticks reflecting inhalation. E, F, Pseudocolored heat maps depicting the change in fluorescence in all responsive glomeruli (along the ordinate) over time (on the abscissa) before any infusions (left), after LC vehicle (E) or muscimol (F) infusion, and following CBL amygdala infusion of muscimol for the example shown in A and B. The arrows denote which line of each heat map corresponds to the glomeruli illustrated in C and D. G, Summary data across mice showing that inactivating LC prevented the subsequent CBL amygdala inactivation from altering PG activity (red triangles), whereas infusing vehicle into the LC before CBL amygdala inactivation produced a significant decrease in PG activity (green circles) in accordance with the data shown in Figure 1. Notably, no change in odor-evoked activity was observed following LC infusion of either vehicle or muscimol. Error bars represent the SEM. ***A statistically significant difference at p < 0.001. H, Cumulative frequency histogram illustrating the distribution of changes in odor-evoked activity after CBL amygdala inactivation across all glomeruli normalized to preinfusion baseline for mice that had received an LC infusion of either vehicle (green points) or muscimol (red points). Lat, Lateral; Ant, anterior.
Figure 4.
Figure 4.
Histological confirmation of LC cannulation. A, Representative cannula placement and diffusion pattern of BODIPY-tagged muscimol (orange; equivalent volume and rate of experimental solutions) in the right hemisphere of coronally sectioned (100 μm) tissue stained with DAPI (blue) at 4 × magnification. The small volume and rate of infusion minimized backflow along the cannula tract and diffusion into surrounding structures, although Barrington's nucleus (Bar) was likely affected, as shown here. B, Coronal illustration (as adapted, with permission, from Franklin and Paxinos, 2007) of infusion locations across animals. Orange circles indicate the centroid of BODIPY-tagged muscimol diffusion. Numbers indicate posterior distance from bregma. MPB, Medial parabrachial nucleus; 4V, fourth ventricle.
Figure 5.
Figure 5.
Local blockade of noradrenergic signaling in the olfactory bulb prevents the effect of CBL amygdala inactivation on PG cells. Bilateral cannulae targeting the CBL amygdala (CBLA) were implanted, and the skull and dura mater overlying the olfactory bulb were removed in PG-GCaMP6f mice. A, B, Pseudocolored activity maps showing the change in fluorescence of the olfactory bulb (OB) during the first inhalation of odorant in preinfusion baseline trials (left) after vehicle (A) or the broad-spectrum noradrenergic antagonist labetalol (B) was applied to the OB superfusate (middle) and after subsequent CBL amygdala infusion of muscimol (right). C, D, Traces indicating the change in fluorescence over time from the glomeruli indicated by arrows in A and B during odor presentations on baseline trials (gray trace), following OB application of vehicle (C, green trace) or labetalol (D, red trace), and after subsequent CBL amygdala infusion of muscimol (rightmost trace). Black bars indicate delivery of odorant for 6 s. Small black traces indicate respiration frequency, with upticks reflecting inhalation. E, F, Pseudocolored heat maps depicting the change in fluorescence in all responsive glomeruli (along the ordinate) over time (on the abscissa) during baseline trials (left), after OB application of vehicle (E) or labetalol (F), and following CBL amygdala infusion of muscimol for the example shown in A and B. The arrows denote which line of each heat map corresponds to the glomeruli illustrated in C and D. G, Summary data showing the mean change in odor-evoked responses across all glomeruli. Replicating the effect of LC inactivation, labetalol applied to the OB prevented the subsequent CBL amygdala inactivation from altering PG cell activity (red diamonds), whereas OB application of vehicle before CBL amygdala inactivation produced a significant decrease in PG activity (green circles) in accordance with the data shown in Figure 1. H, Cumulative frequency histogram illustrating the distribution of changes in odor-evoked activity after CBL amygdala inactivation across all glomeruli normalized to preinfusion baseline for mice that had received intrabulbar application of either vehicle (green points) or labetalol (red points). Together with the previous experiments, these results confirm that CBL amygdala inactivation influences PG cell activity by inducing norepinephrine release from LC projections to the olfactory bulb. Lat, Lateral; Ant, anterior.
Figure 6.
Figure 6.
CBL amygdala inactivation differentially affects PG cell activity depending on baseline odor-evoked responding. We pooled data from 16 mice across three experimental cohorts that received muscimol infused into the CBL amygdala. A, Scatter plot of the change in odor-evoked PG cell activity in olfactory bulb glomeruli following CBL amygdala inactivation against preinfusion odor-evoked response amplitude. Each circle represents one glomerulus. Although CBL amygdala inactivation reduced odor-evoked glomerular responses on average, the effect was very heterogeneous and included some glomeruli that showed an increased response. B, Summary plot of the mean effect of CBL amygdala inactivation for glomeruli in the bottom, middle, and top thirds of the distribution of preinfusion responses. CBL amygdala inactivation suppressed PG cell activity less in glomeruli that exhibited the weakest odor-evoked response before the CBL amygdala infusion of muscimol.
Figure 7.
Figure 7.
CBL amygdala inactivation preferentially enhances the weakest odor-evoked OSN outputs. Odor-evoked output of OSNs was visualized in gene-targeted mice expressing the fluorescent exocytosis indicator spH before and after CBL amygdala (CBLA) infusion of either vehicle or muscimol. A, Schematic illustration of the first stage of olfactory processing on the surface of the olfactory bulb with OSN axon terminals highlighted in green to indicate their expression of spH. B, Summary across mice showing the change in mean OSN output following CBL amygdala inactivation based on where each glomerulus fell in the distribution of preinfusion odor-evoked response amplitudes (i.e., lowest, middle, and top third of baseline odor-evoked responses). CBL amygdala inactivation selectively enhanced odor-evoked OSN output in glomeruli that exhibited the weakest odor-evoked responses at baseline. Error bars represent the SEM. C, Cumulative frequency histogram illustrating the distribution of changes in glomerular inputs normalized to baseline following CBL amygdala infusion of either vehicle (green points) or muscimol (red points). D, G, Pseudocolored activity maps showing the change in fluorescence of the olfactory bulb at the end of odorant presentation before and after CBL amygdala infusions of vehicle (D) or muscimol (G). E, H, Traces indicating the change in fluorescence over time from the glomeruli indicated by arrows in D and G during odor presentations before (gray trace) and following CBL amygdala infusion of vehicle (E, green trace) or muscimol (H, pink, magenta, and dark red traces). Black bars indicate the delivery of odorant for 6 s. Small black traces indicate respiration frequency, with upticks reflecting inhalation. Glomeruli 1 and 2 refer to the location of the glomeruli in G. Note that glomerulus 3 is from the other olfactory bulb of this mouse and so is not visible in G; it was included for comparison because of its similar response size to glomerulus 2 at baseline but divergence after muscimol. F, I, Scatter plots of odor-evoked glomerular inputs following CBL amygdala infusion of either vehicle (F) or muscimol (I) as a function of preinfusion magnitude. Glomeruli illustrated in H are labeled. As seen with PG cell activity, CBL amygdala inactivation selectively influenced the response magnitude in glomeruli that were weakly driven by the odorant at baseline.
Figure 8.
Figure 8.
Schematic illustration of amygdala–locus coeruleus–olfactory bulb interactions. Diagram of a subset of interconnections within and between the olfactory system, amygdala, and locus coeruleus responsible for the data reported above. Left, OSNs located in the olfactory epithelium in the nose detect the odorant molecules and project their axons to the glomeruli of the olfactory bulb, where they release glutamate onto mitral and tufted cells (which project to the olfactory cortex) and onto local interneurons called PG cells. PG cells also receive noradrenergic input from the LC, which is in turn inhibited by activity in the CBL nuclei of the amygdala. PG cells release the inhibitory transmitter GABA onto OSN axon terminals (presynaptically inhibiting their transmitter release) and onto mitral and tufted cells. Right, Infusion of muscimol into the CBL amygdala silences local activity (decreased activity shown in red), which disinhibits the LC (increased activity shown in green), which inhibits PG cells (via norepinephrine release), disinhibiting weakly activated OSN axon terminals. The increased OSN output in the glomeruli is presumably reflected in stronger odor-evoked activity in mitral and tufted cells and thus the input to the olfactory cortices.

Similar articles

Cited by

References

    1. Abraham NM, Vincis R, Lagier S, Rodriguez I, Carleton A (2014) Long term functional plasticity of sensory inputs mediated by olfactory learning. Elife 3:e02109. 10.7554/eLife.02109 - DOI - PMC - PubMed
    1. Adler LE, Hoffer L, Nagamoto HT, Waldo MC, Kisley MA, Giffith JM (1994) Yohimbine impairs P50 auditory sensory gating in normal subjects. Neuropsychopharmacology 10:249–257. 10.1038/npp.1994.28 - DOI - PubMed
    1. Aggleton JP. (1993) The contribution of the amygdala to normal and abnormal emotional states. Trends Neurosci 16:328–333. 10.1016/0166-2236(93)90110-8 - DOI - PubMed
    1. Åhs F, Miller SS, Gordon AR, Lundström JN (2013) Aversive learning increases sensory detection sensitivity. Biol Psychol 92:135–141. 10.1016/j.biopsycho.2012.11.004 - DOI - PubMed
    1. Akerboom J, Chen TW, Wardill TJ, Tian L, Marvin JS, Mutlu S, Calderón NC, Esposti F, Borghuis BG, Sun XR, Gordus A, Orger MB, Portugues R, Engert F, Macklin JJ, Filosa A, Aggarwal A, Kerr RA, Takagi R, Kracun S, et al. (2012) Optimization of a GCaMP calcium indicator for neural activity imaging. J Neurosci 32:13819–13840. 10.1523/JNEUROSCI.2601-12.2012 - DOI - PMC - PubMed

Publication types

LinkOut - more resources