. 2017 Mar 7;8(10):17140-17155.
doi: 10.18632/oncotarget.15084.

Tetraspanin 8 is a novel regulator of ILK-driven β1 integrin adhesion and signaling in invasive melanoma cells

Affiliations

Tetraspanin 8 is a novel regulator of ILK-driven β1 integrin adhesion and signaling in invasive melanoma cells

Manale El Kharbili et al. Oncotarget. .

Abstract

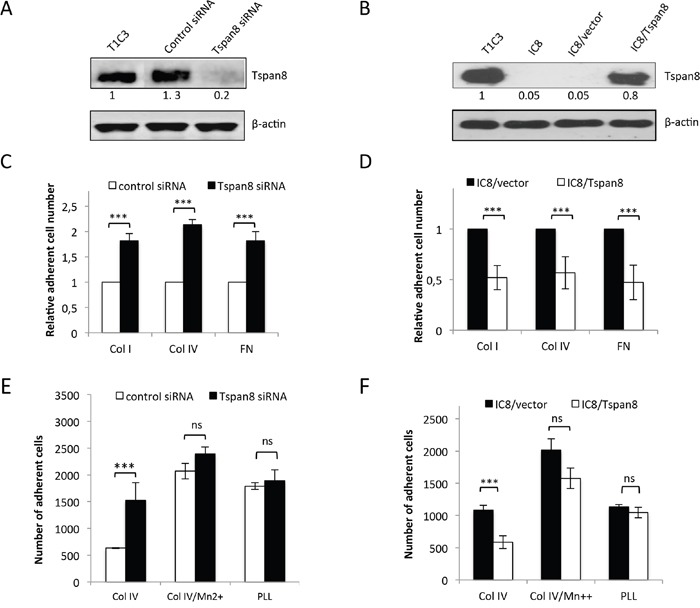
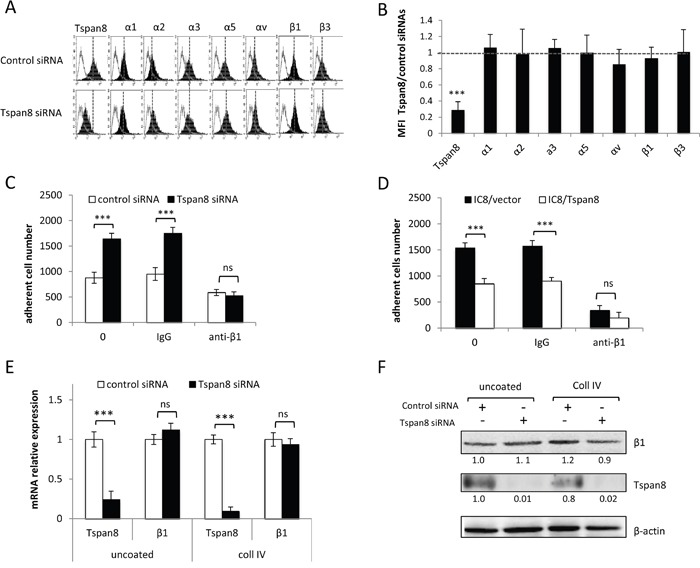
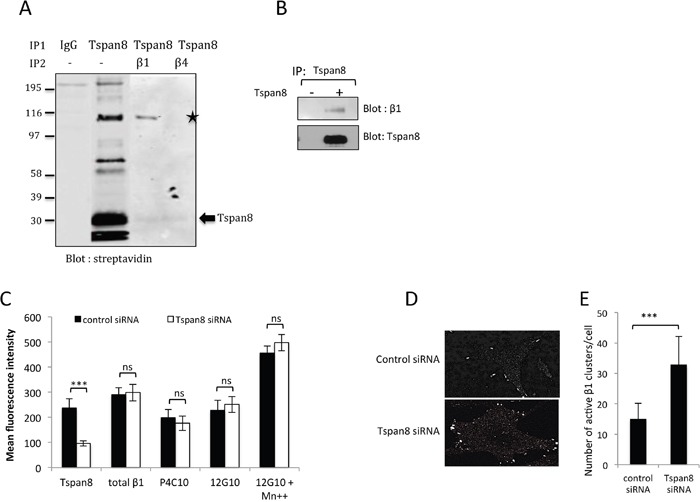
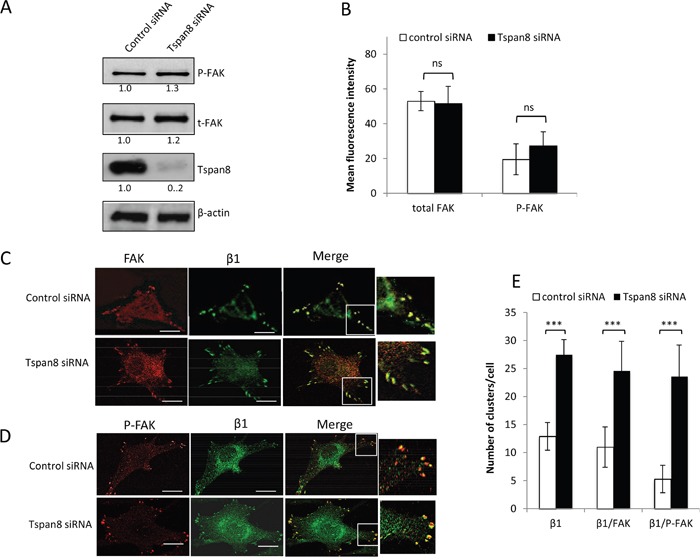
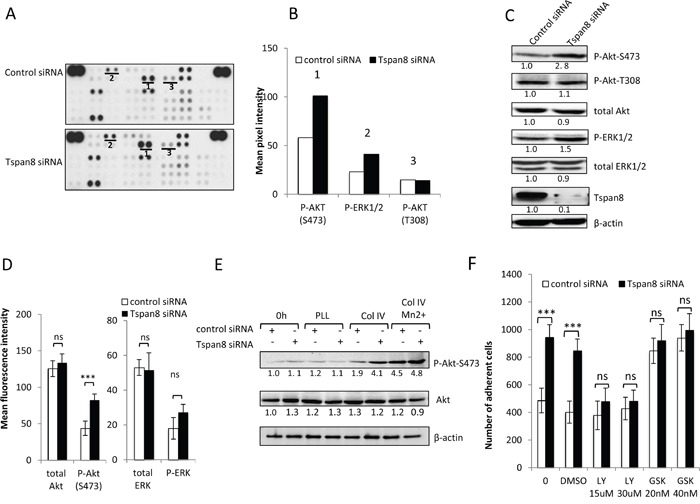
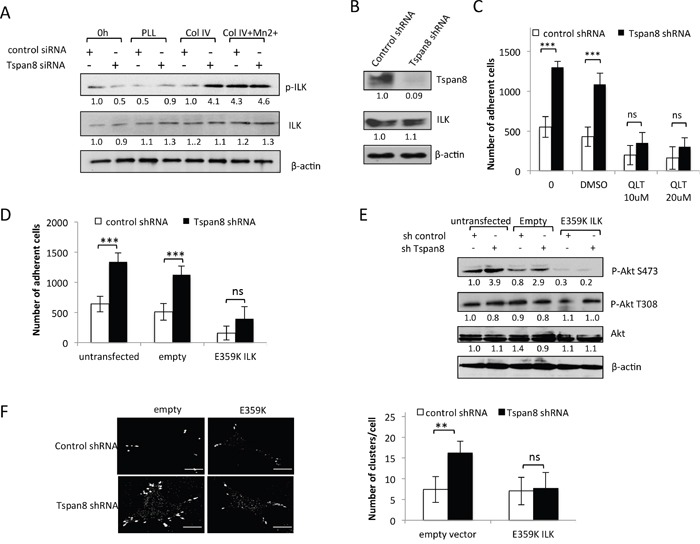
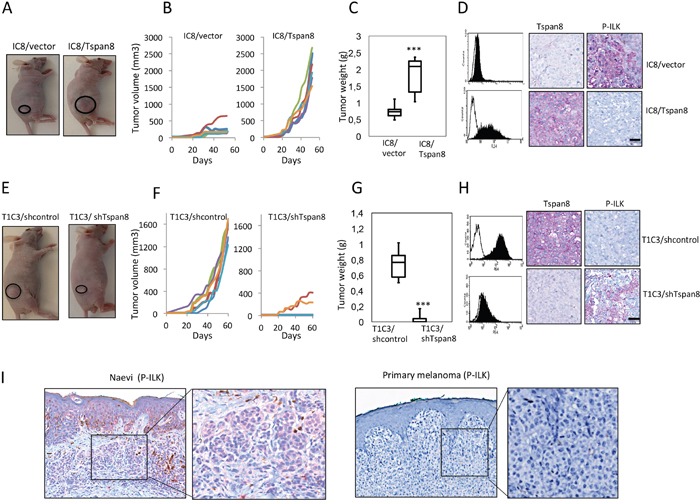
Melanoma is well known for its propensity for lethal metastasis and resistance to most current therapies. Tumor progression and drug resistance depend to a large extent on the interplay between tumor cells and the surrounding matrix. We previously identified Tetraspanin 8 (Tspan8) as a critical mediator of melanoma invasion, whose expression is absent in healthy skin. The present study investigated whether Tspan8 may influence cell-matrix anchorage and regulate downstream molecular pathways leading to an aggressive behavior. Using silencing and ectopic expression strategies, we showed that Tspan8-mediated invasion of melanoma cells resulted from defects in cell-matrix anchorage by interacting with β1 integrins and by interfering with their clustering, without affecting their surface or global expression levels. These effects were associated with impaired phosphorylation of integrin-linked kinase (ILK) and its downstream target Akt-S473, but not FAK. Specific blockade of Akt or ILK activity strongly affected cell-matrix adhesion. Moreover, expression of a dominant-negative form of ILK reduced β1 integrin clustering and cell-matrix adhesion. Finally, we observed a tumor-promoting effect of Tspan8 in vivo and a mutually exclusive expression pattern between Tspan8 and phosphorylated ILK in melanoma xenografts and human melanocytic lesions. Altogether, the in vitro, in vivo and in situ data highlight a novel regulatory role for Tspan8 in melanoma progression by modulating cell-matrix interactions through β1 integrin-ILK axis and establish Tspan8 as a negative regulator of ILK activity. These findings emphasize the importance of targeting Tspan8 as a means of switching from low- to firm-adhesive states, mandatory to prevent tumor dissemination.

Keywords: ILK; integrin; matrix; melanoma; tetraspanin 8.


Conflict of interest statement

CONFLICTS OF INTEREST

The authors have no conflicts to disclose.

Figures

Figure 1
Figure 1. Tspan8 weakened melanoma cell-matrix anchorage
A. Western blot showing the Tspan8 expression 48 hours after transfection of invasive T1C3 cells with siRNA targeting Tspan8 (Tspan8 siRNA) or non-targeting siRNA (control siRNA). B. Western blot analysis of Tspan8 expression in non-invasive IC8 cells stably transduced with empty (IC8/vector) or Tspan8 (IC8/Tspan8) expression vectors. (A and B.) Band intensities were normalized to that of β-actin, used as an internal loading control. C-F. These cells were serum-starved for 12 hours before seeding on collagen IV (col IV), fibronectin(FN) or poly-L-lysine (PLL)-coated plates and treated with or without manganese (Mn2+) in serum-free media. C and D. The number of adherent cells counted on the entire well surface was normalized to the value from control cells (n=6, mean ± SEM). E and F. The number of adherent cells was the mean ± SD from a representative experiment (n=4, each in quadruplicate). ***, p < 0.001, student t test.
Figure 2
Figure 2. Tspan8-reduced β1 integrin-mediated adhesion was independent of β1 transcript and protein expression level
A and B. T1C3 cells transfected with control or TSPAN8 siRNAs were cell surface stained with the indicated mAbs.(A) Data from one representative experiment out of five showing flow cytometry profiles of cells expressing or not Tspan8. Filled histograms represent specific staining and open histograms show isotype-matched control antibody. (B) The value represent the mean MFI ratio of Tspan8-deleted cells to Tspan8-expressing cells ± SD of 5 separate experiments. C and D. Tspan8-depleted (C) and Tspan8-ectopically expressing (D) cells were treated or not with a function-blocking β1 integrin (P4C10) or control (IgG) antibodies, seeded on collagen IV-coated plates and subjected to adhesion assays (n=4, mean ± SD). ***, p < 0.001, student t test. E and F. Cells silenced or not for Tspan8 were seeded onto plates coated or not with collagen IV and subjected to QPCR analysis (E; n=3, mean ± SD) and Western blotting (F). β-actin was used as a loading control. Band intensities were quantified and normalized to β-actin signal (representative of 3 independent experiments).
Figure 3
Figure 3. Tspan8 is in a common co-immunoprecipitable complex with β1 integrin and modulates its clustering rather than its affinity
A. T1C3 melanoma cells were surface biotin-labeled before lysis with Brij 97, immunoprecipitated with Tspan8 mAb or IgGcontrol and immunoblotted with HRP-conjugated streptavidin. Eluted co-immunoprecipitated proteins with anti-Tspan8 (IP1) were identified by a second round of immunoprecipitations using a β1 integrin mAb or an irrelevant anti-β4 integrin mAb (IP2) and visualized by western blotting using a streptavidin-HRP secondary antibody. The asterisk indicates a streptavidin-reactive band: β1 integrin. B. Cells expressing or not Tspan8 were lysed in Brij 97, immunoprecipitated with Tspan8 mAb and examined by western blotting using β1 integrin and Tspan8 mAbs. C. T1C3 cells transfected with control or Tspan8 siRNAs were cell-surface stained for total β1 integrin (MAR4 mAb), inactive (P4C10 mAb) and active (12G10 mAb) β1 integrin epitopes, after treatment with Mn2+ and analyzed by flow cytometry. Data were expressed as mean MFI values ± S.D (n=4). ***, p < 0.001, student t test. (D and E) Cells seeded on glass coverslips coated with collagen IV were fixed 6h later and stained for active β1 using 12G10 mAb. D. Representative images of T1C3 cells transfected with control siRNA or Tspan8 siRNA (n=3). Scale bar is 10μm. E. Quantification of the mean number of active β1 integrin clusters per cell (40 cells per experiment, n =3). ***, p < 0.001, student t test.
Figure 4
Figure 4. Tspan8 regulates β1 integrin clustering but does not affect phosphorylation state of FAK
A and B. T1C3 cells transfected with control or TSPAN8 siRNAs were seeded on collagen IV-coated plates and subjected to western blot (A) and flow cytometry (B) for analysis of total FAK (t-FAK) and phospho-FAK (P-FAK) expression level. (A) Bands intensities were quantified and normalized to that of β-actin (representative of 3 independent experiments). (B.) The value represents the mean MFI ± SD of three independent experiments. C-E. T1C3 cells silenced or not for Tspan8 were plated onto collagen IV-coated coverslips and costained with FAK (red) and 12G10 (green) mAbs or P-FAK (red) and 12G10 (green). (C and D). The merged representative confocal image shows colocalization (yellow). Inset, enlarged areas of peripheral adhesion staining. Scale bar is 10 μm. (E). The number of clusters per cell containing active β1 integrin colocalized or not with FAK was quantified. Data shown represent the mean ± SD for at least 45 cells per experimental group encompassing at least three independent experiments.
Figure 5
Figure 5. Tspan8 down-regulates β1 integrin-mediated cell adhesion through PI3K/Akt signaling
A. Representative image of phosphokinase arrays shows the levels of phosphorylation of individual kinases present in the total protein lysates processed from control or Tspan8-siRNAs transfected cells and plated on collagen IV after 12 hours serum starvation. Each phosphorylated kinase is spotted in duplicate. The pair dots in the top right and top left corners are positive controls. Each pair of the most positive kinase dots is denoted by a numeral, the identity of the corresponding kinases is (1) P-Akt S473, (2) P-ERK1/2, (3) P-Akt T308. B. Mean pixel intensity of the spots measured by densitometry. C and D. The expression level of the 3 selected kinases was verified by western immunoblotting (C) and by flow cytometry (D). The results shown are representative of three independent experiments. (C) Bands intensities were quantified and normalized to that of β-actin loading control. (D) Histograms showing levels of intracellular kinases expressed as mean MFI ± SD (n= 3). ***, p < 0.001, student t test. E. T1C3 cells silenced or not for Tspan8 were plated on poly-L-lysine (PLL) or collagen IV (col IV), treated or not with Mn 2+. Cell lysates before (0 h) or after adherence were blotted for total or phosphorylated Akt mAbs (a representative blot of 3 independent experiments). The band intensities were normalized to β-actin signal. F. T1C3 cells transfected with control or Tspan8 siRNA were treated or not with LY294002 (LY; at 15 μM, 30 μM), GSK690693 (GSK; 20 μM, 40 μM) and vehicle (DMSO) and seeded onto collagen IV-coated plates. The adherent cells were numerated. Bars represent the mean ± SD of quadruplicate samples from one representative experiment (n=4).
Figure 6
Figure 6. Tspan8 silencing reduces ILK activity with a concomitant decrease in β1 integrin-dependent adhesion and clustering
A. T1C3 cells silenced or not for Tspan8 were plated on poly-L-lysine (PLL) or collagen IV (col IV) with or without Mn2+ and allowed to adhere for 2 h. Cell lysates before (0 h) or after adherence were analyzed by Western blot with total or phosphorylated ILK mAbs (representative blot of 3 independent experiments). The band intensities were normalized to β-actin signal. B. Western blot analysis of Tspan8 and ILK in invasive T1C3 cells stably transduced with control or Tspan8 shRNAs expressing plasmids. β-actin was used as a loading control. Of note, Tspan8 knockdown had no effect on the ILK protein expression levels. C. These cells were pre-treated or not with QLT0267 at 10 μM or 20 μM or vehicle (DMSO), plated on collagen IV-coated plates and subjected to adhesion assay. Bars represent the mean number of adherent cells ± SD from a representative experiment (n=2, each in sixplicate). ***, p < 0.001, Student t test. D-F. T1C3 cells stably silenced for Tspan8 were transfected or not with empty or ILK-E359K plasmids, plated onto collagen IV-coated plates and subjected to adhesion assays (D) western blot analysis (E) and microscopy (F). (D) Bars represent the number of cells that adhere to collagen IV-coated plates (mean ± SD of sixplicate samples from one representative experiment; n=3). (E) Representative western blot of total (Akt) and phosphorylated (P-Akt) Akt (n=3). β-actin was used as a loading control and a internal reference for band quantification. (F). T1C3 cells plated onto collagen IV-coated coverslips were stained with 12G10 mAb. Left panel, representative confocal microscopy images (n=2; scale bar: 10 μm). Right panel, mean number of β1 integrin clusters per cell ± S.D. from up to 40 cells over 2 separate experiments. **, p < 0.05, Student t test.
Figure 7
Figure 7. Tspan8 modulates melanoma growth in vivo and its expression correlates with downregulation of ILK phosphorylation
A-D. IC8 cells transduced with the vector alone (IC8/vector) or Tspan8 cDNAs (IC8/Tspan8) were subcutaneously injected into the flank of nude mice (6 mice per group; n=2). (A) Representative photographs of xenografts. (B). Tumor growth curves for each mice. (C). Tumor weight was measured after mice were killed at 50 days post-injection (n=6, mean ± SEM). **p<0.005, Student's t-test. (D). The dissected xenograft tumors were subjected to flow cytometry analysis for Tspan8 expression and immunohistochemical staining with Tspan8 and P-ILK mAbs. Filled histograms represent the specific staining and open histograms show the isotype-matched control antibody. Scale bar, 100 μm. E-H. T1C3 cells stably expressing control (T1C3/shcontrol) or Tspan8 shRNAs (T1C3/shTspan8) were xenografted in nude mice (6 mice per group, n=2). (E) Representative photographs of xenografts. (F) Growth curves of xenografts. White symbols: volume of tumors generated from T1C3 cells transduced with Tspan8 shRNA (T1C3/shTspan8); black symbols: volume of tumors generated from T1C3 cells transduced with control shRNA (T1C3/shcontrol). (G) At day 50, the mice were euthanized and the tumors were removed and weighed. **P<0.005. (H) The dissected tumors were subjected to flow cytometry analysis for Tspan8 expression and immunohistochemical staining with Tspan8 and P-ILK mAbs. Filled histograms represent the specific staining and open histograms show the isotype-matched control antibody. Scale bar is 100 μm. I. Representative immunohistochemical expression of P-ILK staining in a benign nevus and primary melanoma. The square represents the area of magnification shown in the inset.

References

    1. Miller AJ, Mihm MC, Jr, Melanoma N Engl J Med. 2006;355:51–65. - PubMed
    1. Hynes RO. Integrins: bidirectional, allosteric signaling machines. Cell. 2002;110:673–687. doi: 10.1016/S0092-8674(02)00971-6. - DOI - PubMed
    1. Guo W, Giancotti FG. Integrin signalling during tumor progression. Nat Rev Mol Cell Biol. 2004;5:816–826. - PubMed
    1. Seguin L, Desgrosellier JS, Weis SM, Cheresh DA. Integrins and cancer: regulators of cancer stemness, metastasis, and drug resistance. Trends Cell Biol. 2015;25:234–240. - PMC - PubMed
    1. Hirata E, Girotti MR, Viros A, Hooper S, Spencer-Dene B, Matsuda M, Larkin J, Marais R, Sahai E. Intravital imaging reveals how BRAF inhibition generates drug-tolerant microenvironments with high integrin β1/FAK signaling. Cancer Cell. 2015;27:574–588. - PMC - PubMed

MeSH terms