

Assessment of Structural Heterogeneity and Viscosity in the Cervix Using Shear Wave Elasticity Imaging: Initial Results from a Rhesus Macaque Model
- PMID: 28189282
- PMCID: PMC5348278
- DOI: 10.1016/j.ultrasmedbio.2016.12.006
Assessment of Structural Heterogeneity and Viscosity in the Cervix Using Shear Wave Elasticity Imaging: Initial Results from a Rhesus Macaque Model
Abstract
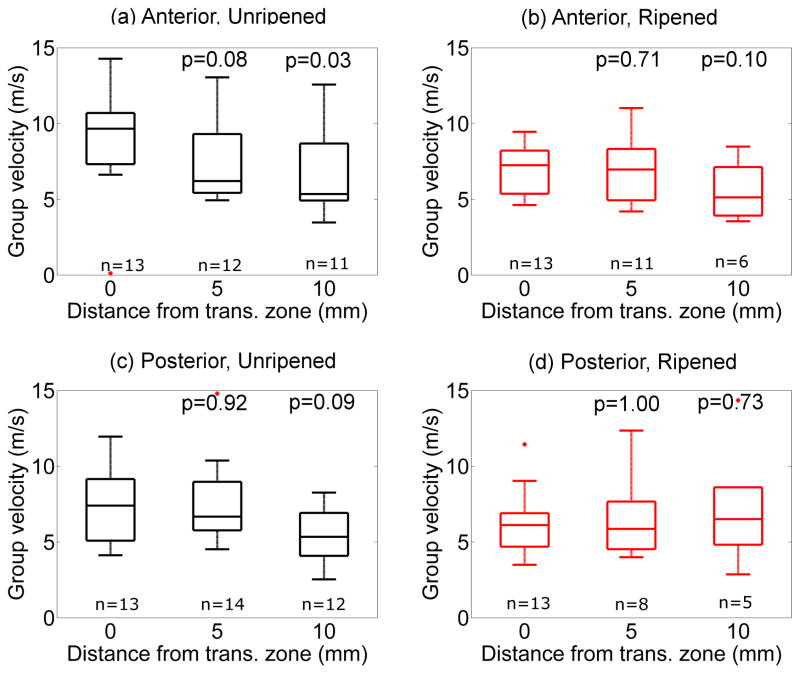
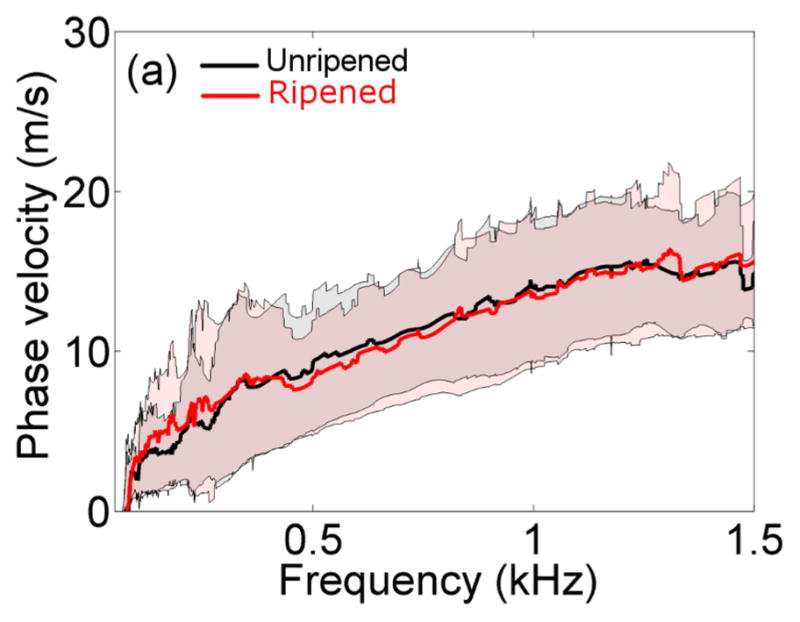
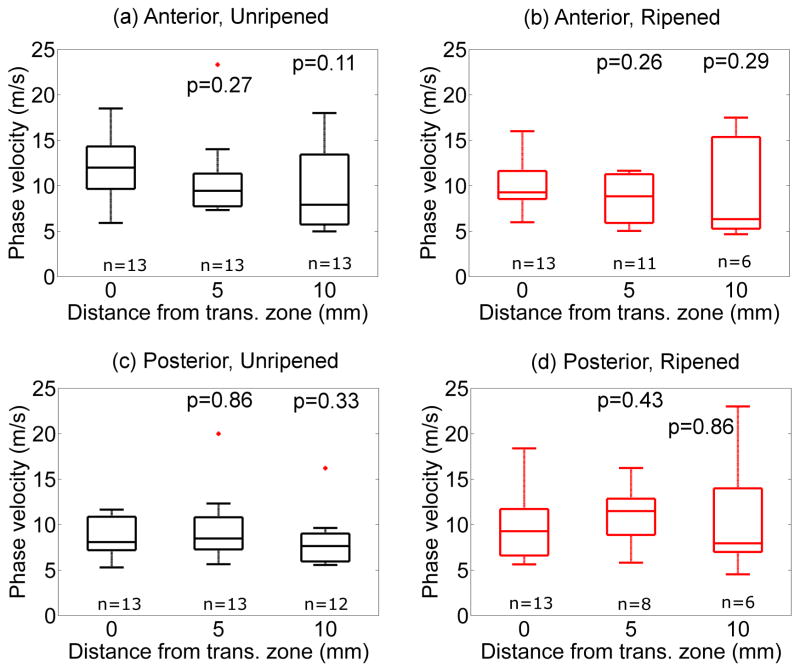
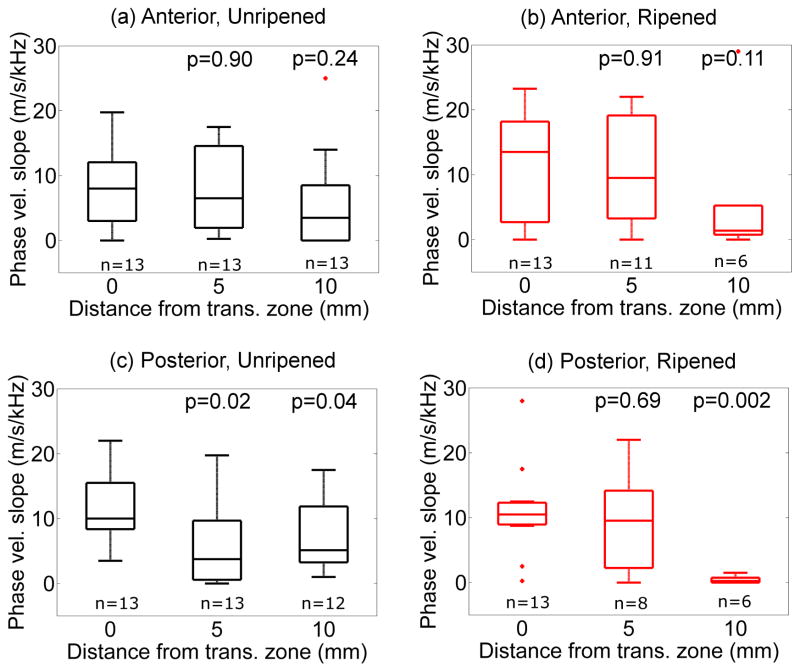
Shear wave elasticity imaging has shown promise in evaluation of the pregnant cervix. Changes in shear wave group velocity have been attributed exclusively to changes in stiffness. This assumes homogeneity within the region of interest and purely elastic tissue behavior. However, the cervix is structurally/microstructurally heterogeneous and viscoelastic. We therefore developed strategies to investigate these complex tissue properties. Shear wave elasticity imaging was performed ex vivo on 14 unripened and 13 misoprostol-ripened cervix specimens from rhesus macaques. After tests of significant and uniform shear wave displacement, as well as reliability of estimates, group velocity decreased significantly from the distal (vaginal) to proximal (uterine) end of unripened, but not ripened, specimens. Viscosity was quantified by the slope of the phase velocity versus frequency. Dispersion was observed in both groups (median: 5.5 m/s/kHz, interquartile range: 1.5-12.0 m/s/kHz), also decreasing toward the proximal cervix. This work suggests that comprehensive assessment of complex tissues such as cervix requires consideration of structural heterogeneity and viscosity.
Keywords: Cervix; Shear Wave Elasticity; Viscoelasticity.
Copyright © 2016 World Federation for Ultrasound in Medicine & Biology. Published by Elsevier Inc. All rights reserved.
Figures
Similar articles
-
Quantitative assessment of cervical softening during pregnancy in the Rhesus macaque with shear wave elasticity imaging.Phys Med Biol. 2018 Apr 19;63(8):085016. doi: 10.1088/1361-6560/aab532. Phys Med Biol. 2018. PMID: 29517492 Free PMC article.
-
New techniques in evaluation of the cervix.Semin Perinatol. 2017 Dec;41(8):477-484. doi: 10.1053/j.semperi.2017.08.006. Semin Perinatol. 2017. PMID: 29191290 Free PMC article. Review.
-
Estimation of Shear Wave Speed in the Rhesus Macaques' Uterine Cervix.IEEE Trans Ultrason Ferroelectr Freq Control. 2016 Sep;63(9):1243-52. doi: 10.1109/TUFFC.2016.2524259. Epub 2016 Feb 8. IEEE Trans Ultrason Ferroelectr Freq Control. 2016. PMID: 26886979 Free PMC article.
-
Estimation of shear wave speed in the human uterine cervix.Ultrasound Obstet Gynecol. 2014 Apr;43(4):452-8. doi: 10.1002/uog.12555. Epub 2014 Mar 12. Ultrasound Obstet Gynecol. 2014. PMID: 23836486 Free PMC article.
-
Cervical elastography during pregnancy: a critical review of current approaches with a focus on controversies and limitations.J Med Ultrason (2001). 2016 Oct;43(4):493-504. doi: 10.1007/s10396-016-0723-z. Epub 2016 Jun 3. J Med Ultrason (2001). 2016. PMID: 27259500 Review.
Cited by
-
Detection of Changes in Cervical Softness Using Shear Wave Speed in Early versus Late Pregnancy: An in Vivo Cross-Sectional Study.Ultrasound Med Biol. 2018 Mar;44(3):515-521. doi: 10.1016/j.ultrasmedbio.2017.10.017. Epub 2017 Dec 12. Ultrasound Med Biol. 2018. PMID: 29246767 Free PMC article.
-
Why Are Viscosity and Nonlinearity Bound to Make an Impact in Clinical Elastographic Diagnosis?Sensors (Basel). 2020 Apr 22;20(8):2379. doi: 10.3390/s20082379. Sensors (Basel). 2020. PMID: 32331295 Free PMC article. Review.
-
Quantitative assessment of cervical softening during pregnancy in the Rhesus macaque with shear wave elasticity imaging.Phys Med Biol. 2018 Apr 19;63(8):085016. doi: 10.1088/1361-6560/aab532. Phys Med Biol. 2018. PMID: 29517492 Free PMC article.
-
Cervical Evaluation: From Ancient Medicine to Precision Medicine.Obstet Gynecol. 2017 Jul;130(1):51-63. doi: 10.1097/AOG.0000000000002106. Obstet Gynecol. 2017. PMID: 28594774 Free PMC article.
-
New techniques in evaluation of the cervix.Semin Perinatol. 2017 Dec;41(8):477-484. doi: 10.1053/j.semperi.2017.08.006. Semin Perinatol. 2017. PMID: 29191290 Free PMC article. Review.
References
-
- Aubry S, Risson JR, Kastler A, Barbier-Brion B, Siliman G, Runge M, Kastler B. Biomechanical properties of the calcaneal tendon in vivo assessed by transient shear wave elastography. Skeletal radiology. 2013;42:1143–1150. - PubMed
-
- Barone WR, Feola AJ, Moalli PA, Abramowitch SD. Viscoelastic behavior of the rat uterine cervix at mid-pregnancy. ASME 2010 Summer Bioengineering Conference. American Society of Mechanical Engineers; 2010; pp. 697–698.
-
- Barry CT, Hah Z, Partin A, Mooney RA, Chuang KH, Augustine A, Almudevar A, Cao W, Rubens DJ, Parker KJ. Mouse liver dispersion for the diagnosis of early-stage fatty liver disease: a 70-sample study. Ultrasound in medicine & biology. 2014;40:704–713. - PubMed
Publication types
MeSH terms
Grants and funding
LinkOut - more resources
Full Text Sources
Other Literature Sources
Medical
