. 2017 Mar 22;4(3):291-305.e7.
doi: 10.1016/j.cels.2016.12.013. Epub 2017 Feb 8.

Construction and Analysis of Two Genome-Scale Deletion Libraries for Bacillus subtilis

Affiliations

Construction and Analysis of Two Genome-Scale Deletion Libraries for Bacillus subtilis

Byoung-Mo Koo et al. Cell Syst. .

Abstract

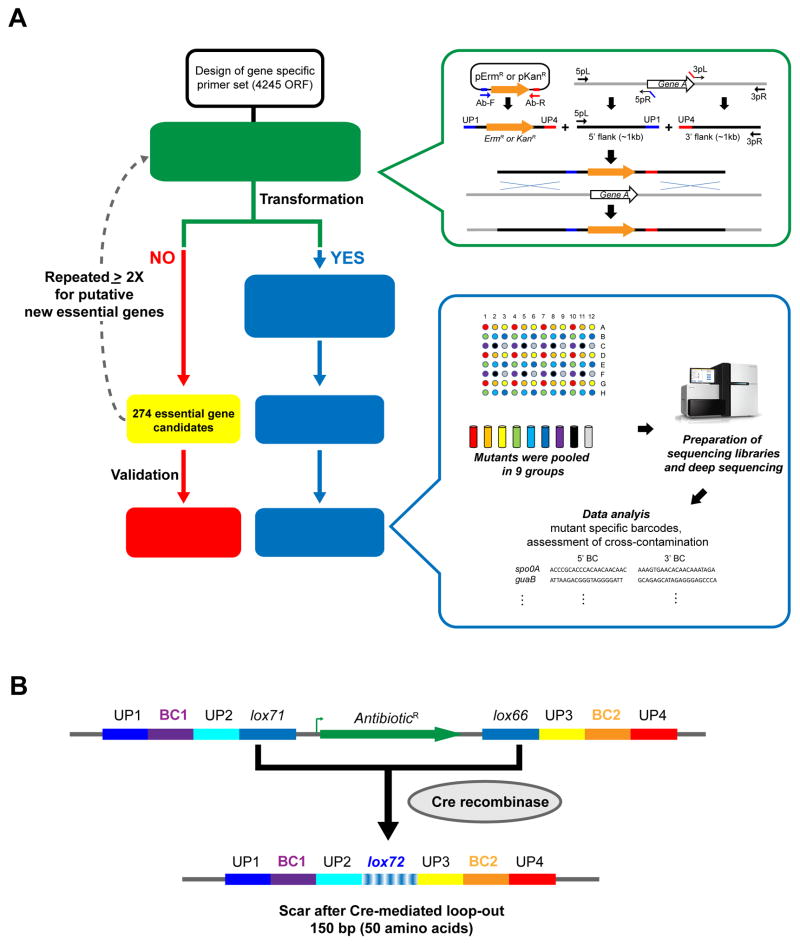
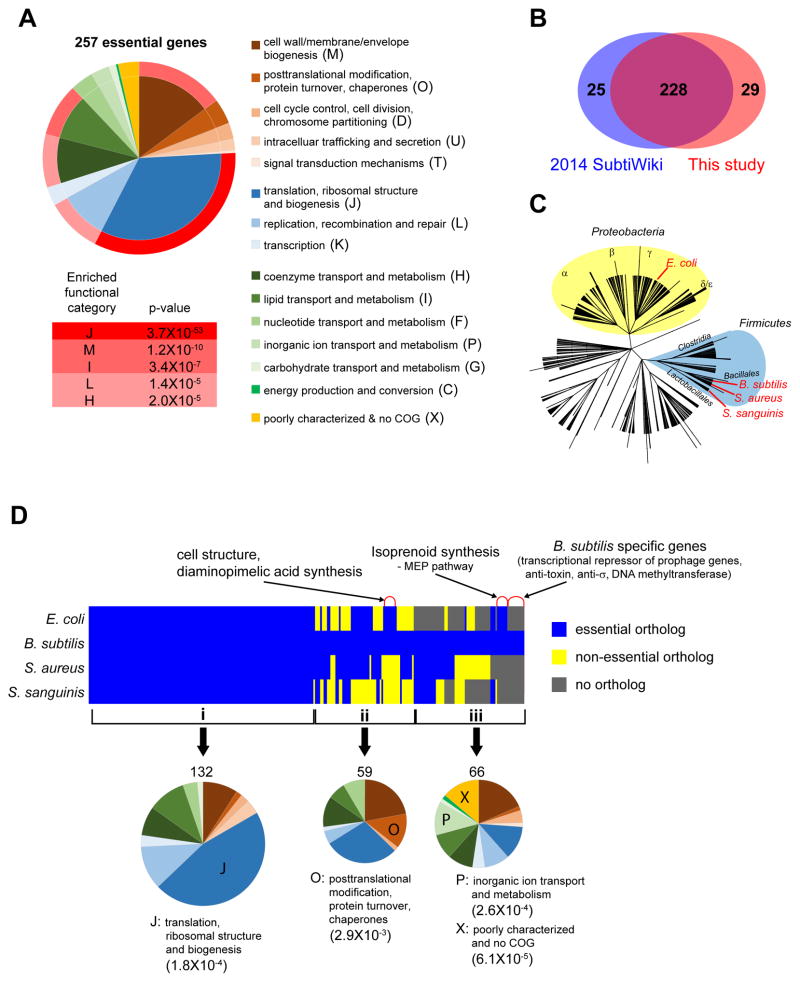
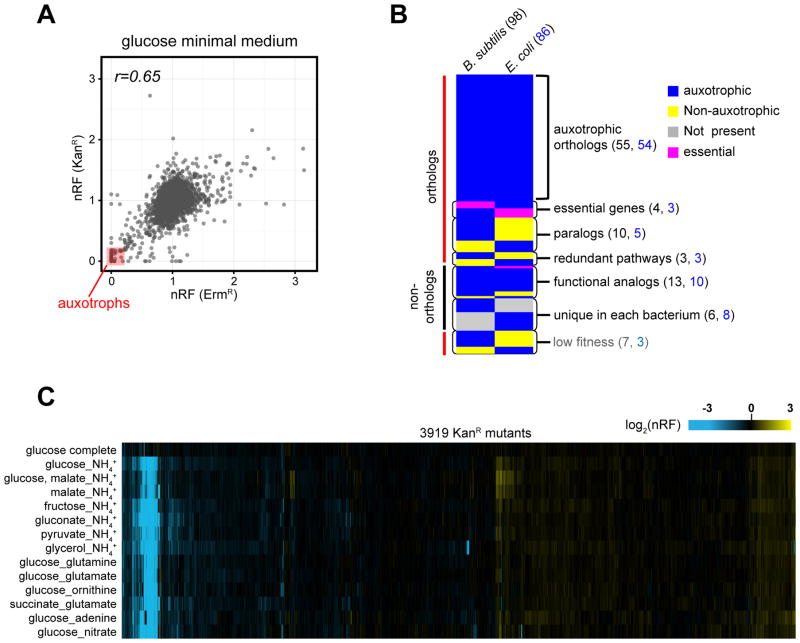
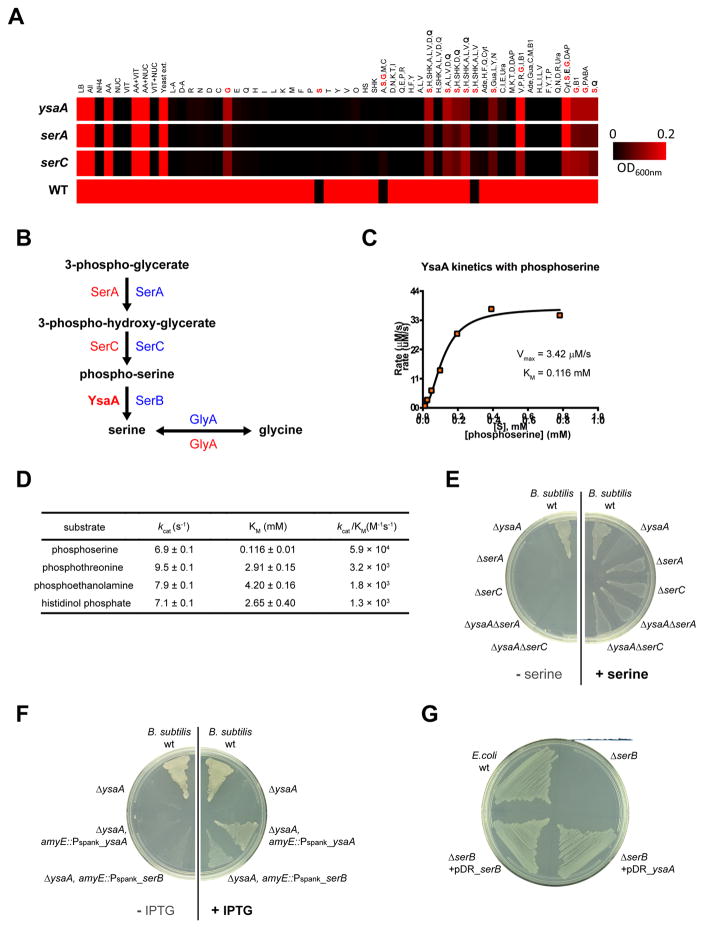
A systems-level understanding of Gram-positive bacteria is important from both an environmental and health perspective and is most easily obtained when high-quality, validated genomic resources are available. To this end, we constructed two ordered, barcoded, erythromycin-resistance- and kanamycin-resistance-marked single-gene deletion libraries of the Gram-positive model organism, Bacillus subtilis. The libraries comprise 3,968 and 3,970 genes, respectively, and overlap in all but four genes. Using these libraries, we update the set of essential genes known for this organism, provide a comprehensive compendium of B. subtilis auxotrophic genes, and identify genes required for utilizing specific carbon and nitrogen sources, as well as those required for growth at low temperature. We report the identification of enzymes catalyzing several missing steps in amino acid biosynthesis. Finally, we describe a suite of high-throughput phenotyping methodologies and apply them to provide a genome-wide analysis of competence and sporulation. Altogether, we provide versatile resources for studying gene function and pathway and network architecture in Gram-positive bacteria.

Keywords: Bacillus subtilis; Genome-wide screening; auxotrophic gene; competence; essential gene; growth; high-throughput methods for transformation and double-mutant analysis; ordered gene deletion mutant library; sporulation; ysaA.


Figures

Figure 1
Figure 1. Overview of construction of single gene deletion libraries in B. subtilis
(A) Left: Workflow of mutant construction and essential gene validation. Right top (green): Construction of DNA fragments to replace target genes. The plasmid encoded antibiotic resistance cassette (ErmR or KanR) was amplified with Ab-F and Ab-R, each consisting of a random barcode sequence flanked by UP (Universal priming) sequences. About 1kb of the 5′ and 3′ flanking sequences of the target gene were amplified by 5pL/5pR and 3pL/3pR respectively. The purified antibiotic resistance cassette and its flanking regions were joined, amplified, and transformed into the wild-type strain. Right bottom (blue): Schematic procedure for barcode identification. Within each library, mutants were pooled in 9 groups as denoted by color code according to their position in 96 well plates. Sequencing libraries were prepared and sequenced as described in STAR methods. Mutant specific barcodes were identified by mapping the sequencing reads onto the B. subtilis genome. Cross-contamination was indicated when mutant barcodes were present in pools that should lack the mutant. Detailed procedures are described in STAR Methods. (B) Structure of the antibiotic resistance cassettes. UP1~4, universal priming sequence; BC1 and BC2, mutant specific barcodes; lox71 and lox66, Cre recombinase recognition sites used for excision of the antibiotic resistance cassette. A150 bp scar sequence after Cre mediated excision of antibiotic resistance cassette is shown at the bottom. The lox72 sequence remaining after recombination between lox71 and lox66 is indicated. See also Figure S1 and Table S1 and S2.
Figure 2
Figure 2. The B. subtilis essential gene set
(A) Functional categories of B. subtilis essential genes. Pie chart (left) indicates COG based classification of essential genes. Each color represents a COG class ID described at the right. Gradient red colors outside the pie chart represent enrichment of each category. Bottom table: enriched functional categories of essential genes with their Bonferroni corrected p-value. (B) A Venn diagram comparison of the essential genes from SubtiWiki and our study. (C) Phylogenetic tree of bacteria representing the distance among B. subtilis, S. aureus, S. sanguinis and E. coli. Two phyla, Firmicutes and Proteobacteria are highlighted by blue and yellow circles respectively. Tree was generated from NCBI Taxonomy and visualized in iTOL (Letunic and Bork, 2016). (D) Conservation and essentiality of orthologs of B. subtilis essential genes in E. coli, S. aureus and S. sanguinis. Top: Orthologs of B. subtilis essential genes in other bacteria were identified by pairwise comparison of their protein sequences as determined from their genomic sequences. Genes were grouped by their conservation and essentiality in other bacteria: i. essential in all four bacteria; ii. conserved in all four bacteria; iii. missing in at least one bacterium. Bottom: Pie charts indicate the distribution of functional categories of genes in each group colored according to their COG class IDs shown in (A). The enriched functional categories in each group are indicated by letter in the pie chart; description of enriched functional categories and their Bonferroni corrected p-values are indicated under the pie chart. See also Figure S2 and Table S3.
Figure 3
Figure 3. Profiling of strain fitness in minimal media
The ErmR and KanR libraries arrayed in high-density (1536/plate) were grown in minimal media with different C or N source. We used integrated colony opacity (Iris; Kritikos et al.) to calculate the normalized relative fitness (nRF) of each mutant (colony opacity of mutant)/(median colony opacity in plate). Data were processed as described in STAR methods and are listed in Table S4. (A) Scatter plot of the nRF of ErmR and KanR mutants in glucose minimal medium at 37°C. We defined as auxotrophs mutants with an nRF <0.3 in both libraries (red square). (B) Comparison of auxotrophic genes in B. subtilis and E. coli. Orthologs were identified by pairwise protein sequence allignments using NCBI BLAST. The Metacyc database (Caspi et al., 2014) was used for functional annotation of genes and pathway analysis. The colors represent conservation, essentiality and auxotrophy of genes in each bacterium. The reasons for discordance in auxotrophy between orthologs are described to the right of the chart. The numbers of auxotrophic genes in each category for B. subtilis (black) and E. coli (blue) are indicated. (C) Heat map representation of nRF of 3911 KanR mutants (x-axis) in 13 minimal media conditions and in defined rich medium (y-axis). See also Figure S3 and S4, and Table S4.
Figure 4
Figure 4. Identifying the function of YsaA
(A) Growth of ysaA, serA, serC and wild-type in various defined media are shown as a heat map. Values are based on average of duplicate determinations of the OD600 of each strain after 18hr in glucose minimal media supplemented with various metabolites and pools of metabolites. Amino acids are represented by their single letter code. Abbreviations: AA: amino acids; NUC: nucleoside bases; VIT: vitamins; L-A: L-alanine; D-A: D-alanine; HS: homoserine; SHK: shikimate; Ade: adenine; Cyt: cytosine; Gua: guanine; Ura: uracil; DAP: diaminopimelic acid; B1: vitamin B1; PABA, p-amino benzoic acid. (B) Serine biosynthesis pathway. Known enzymes catalyzing each step in B. subtilis (red) and E. coli (blue) are shown. The function of YsaA (bold) was identified as part of this study. (C) Saturation curve for phosphoserine phosphatase activity of YsaA. (D) Steady-state kinetic parameters for YsaA against four putative substrates. (E) Epistatic interaction of ysaA with serA and serC in B. subtilis is shown by comparing plates with (right) or without (left) serine. (F) Complementation of B. subtilis ysaA with either B. subtilis ysaA or with E.coli serB, each integrated at the B. subtilis amyE chromosomal locus, and controlled by an IPTG inducible promoter (Pspank). (G) Complementation of E. coli serB growing in glucose minimal medium with multicopy plasimids expressing B. subtilis ysaA (pDR_yasA) or E.coli serB (pDR_serB).
Figure 5
Figure 5. High-throughput transformation with genomic DNA
(A) Schematic procedure for high-throughput double mutant generation. ErmR mutants arrayed in 384 format on MC agar plates were resuspended in liquid competence medium, mixed with genomic DNA from donor (KanR) and incubated for 16 hr. Transformants were then enriched by adding LB and kanamycin and incubation for 6 hours further. Note that mutants with only KanR can also be generated by replacement of ErmR region with its original wild-type sequence, which results from co-transformation of wild-type piece of genomic DNA (congression). Following enrichment for transformants on Kan, double mutants (KanR + ErmR) were selected on both erythromycin and kanamycin. The steps in liquid medium are highlighted in yellow. The genome-wide screen was performed with hisC:kan. (B) The minimum distance between deletions in a double mutant was assessed by determining the fraction of mutants in the amyE or gmuD neighborhood that maintained their ErmR antibiotic marker after transformation with amyE::KanR and gmuD::KanR genomic DNA. This experiment was performed according to the protocol in (A) except that the enrichment step was eliminated to obtain an accurate estimation of the number of transformants that retained both markers. Top - Genomic context of the amyE and gmuD loci. Middle - Quantitative representation of the results. A bar graph indicating the fraction of double mutants among total transformants. Results at the amyE locus left and the gmuD locus-right. Bottom - Qualitative representation of the results. Direct plating of the double mutants in each transformation presented in the bar graph. Each plating is in duplicate from technical replicate cultures. See also Figure S5 and S6, and Table S5.
Figure 6
Figure 6. Genome-wide screening of sporulation in B. subtilis
(A) Sporulation phenotypes and colony size were automatically quantified using Iris (Kritikos et al.) after 45 hr of growth on succinate-glutamate minimal agar plates supplemented with limiting amounts of nutrients. Top: A representative sporulation plate image is shown. Bottom left: A zoomed-in portion of the 1536 colony array image processed with Iris is shown at the lower left. The raw sporulation score is calculated from the color intensity in the center area of the colony (red circle). Bottom right: Color-coded relative sporulation scores (rSS) of each mutant in the zoomed-in portion are shown. rSS was calculated by following equation, rSS = (sporulation score of mutant)/(median sporulation score in plate). For details see STAR Methods. (B) Reproducibility of rSS from two technical replicates of the KanR library. (C) The rSS of ErmR and KanR mutants is shown by scatter plot, with the sporulation scores of 101 known sporulation mutants indicated in red color. A density plot (above) indicates the relative distribution of known mutants compared to all genes in B. subtilis. (D) Using a 5% false discovery rate (FDR), 70% of the known sporulation mutants were recovered in this screen. (E) COG functional groups enriched in sporulation defective mutants (p<0.05). A violin plot showing the distribution of the rSS of genes by functional group with the total member of genes in each category indicated. Width represents the probability density of the data at a given rSS. D, cell cycle control, cell division, chromosome partitioning; J, translation, ribosome structure and biogenesis; M, cell wall/membrane/envelope biogenesis; N, cell motility; T, signal transduction (F) Distribution of the rSS of genes positively regulated by mother cell sporulation sigmas (SigE and SigK; red), forespore sigmas (SigF and SigG; blue) and Spo0A (yellow). Total member of genes in each category is indicated. Sigma regulons enriched in sporulation defective genes are indicated by *, p-value <0.05); n.s., not significant. See also Figure S7 and Table S6.

References

    1. Abecasis AB, Serrano M, Alves R, Quintais L, Pereira-Leal JB, Henriques AO. A genomic signature and the identification of new sporulation genes. J Bacteriol. 2013;195:2101–2115. - PMC - PubMed
    1. Altschul SF, Gish W, Miller W, Myers EW, Lipman DJ. Basic local alignment search tool. J Mol Biol. 1990;215:403–410. - PubMed
    1. Arumugam M, Raes J, Pelletier E, Le Paslier D, Yamada T, Mende DR, Fernandes GR, Tap J, Bruls T, Batto JM, et al. Enterotypes of the human gut microbiome. Nature. 2011;473:174–180. - PMC - PubMed
    1. Auchtung JM, Lee CA, Garrison KL, Grossman AD. Identification and characterization of the immunity repressor (ImmR) that controls the mobile genetic element ICEBs1 of Bacillus subtilis. Mol Microbiol. 2007;64:1515–1528. - PMC - PubMed
    1. Auchtung JM, Lee CA, Grossman AD. Modulation of the ComA-dependent quorum response in Bacillus subtilis by multiple Rap proteins and Phr peptides. J Bacteriol. 2006;188:5273–5285. - PMC - PubMed

Publication types