. 2017 May;1862(5):513-522.
doi: 10.1016/j.bbalip.2017.02.002. Epub 2017 Feb 9.

Fatty-acyl chain profiles of cellular phosphoinositides

Affiliations

Fatty-acyl chain profiles of cellular phosphoinositides

Alexis Traynor-Kaplan et al. Biochim Biophys Acta Mol Cell Biol Lipids. 2017 May.

Abstract

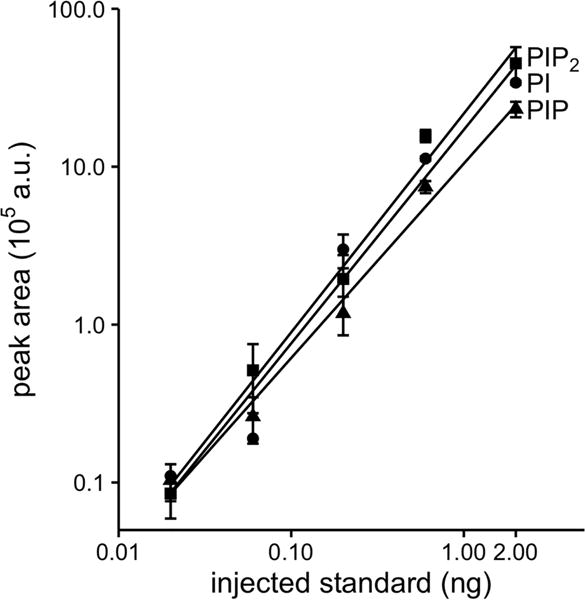
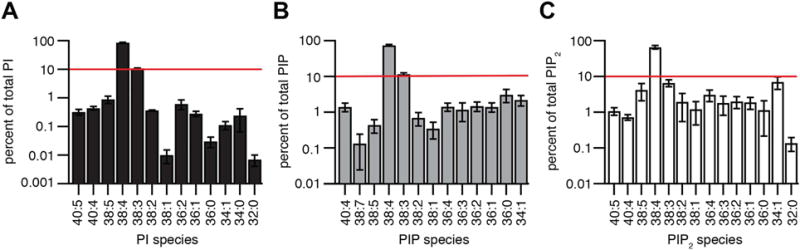
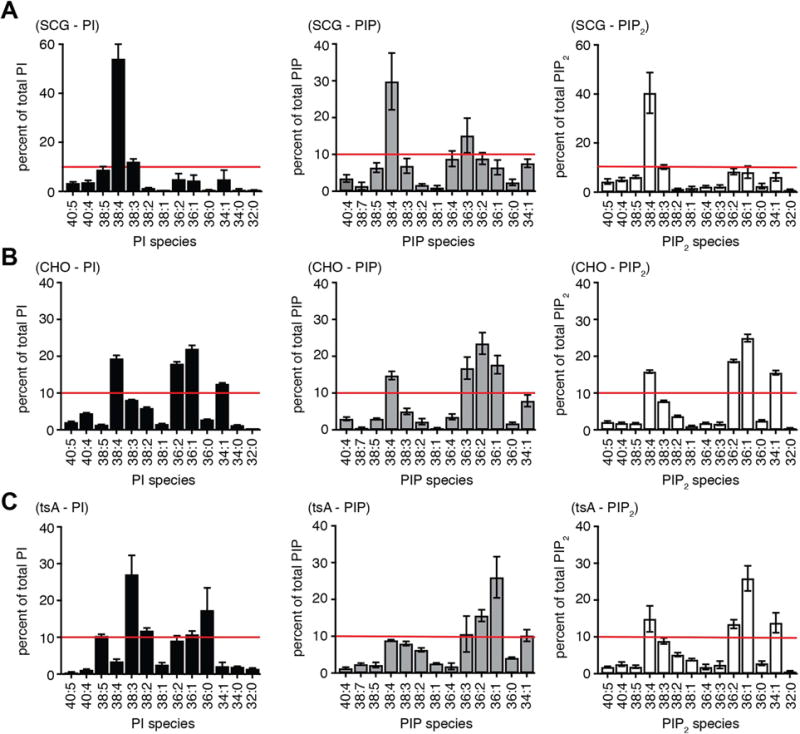
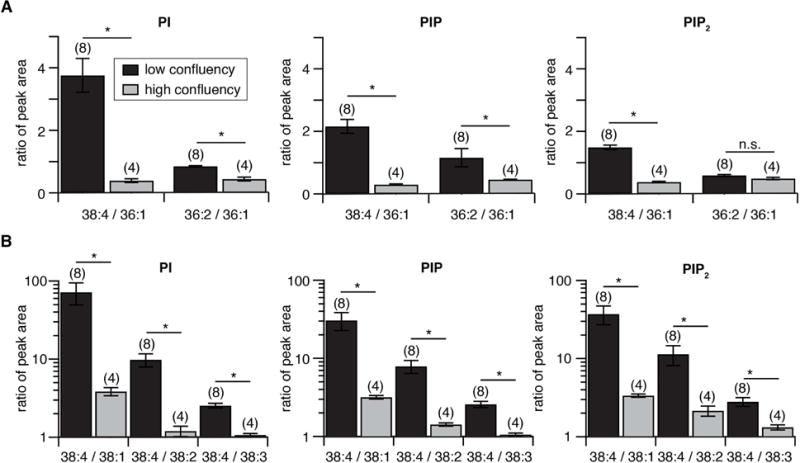
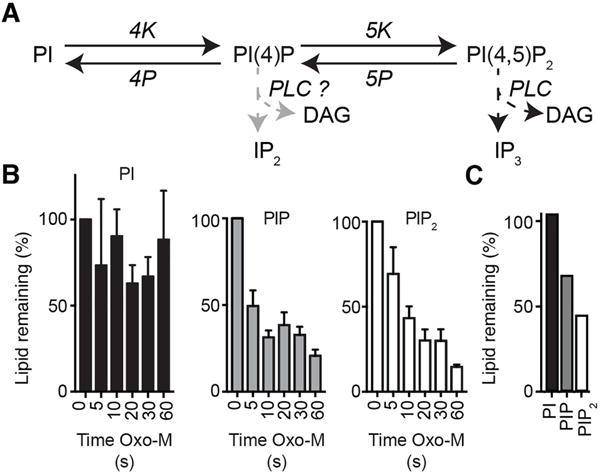
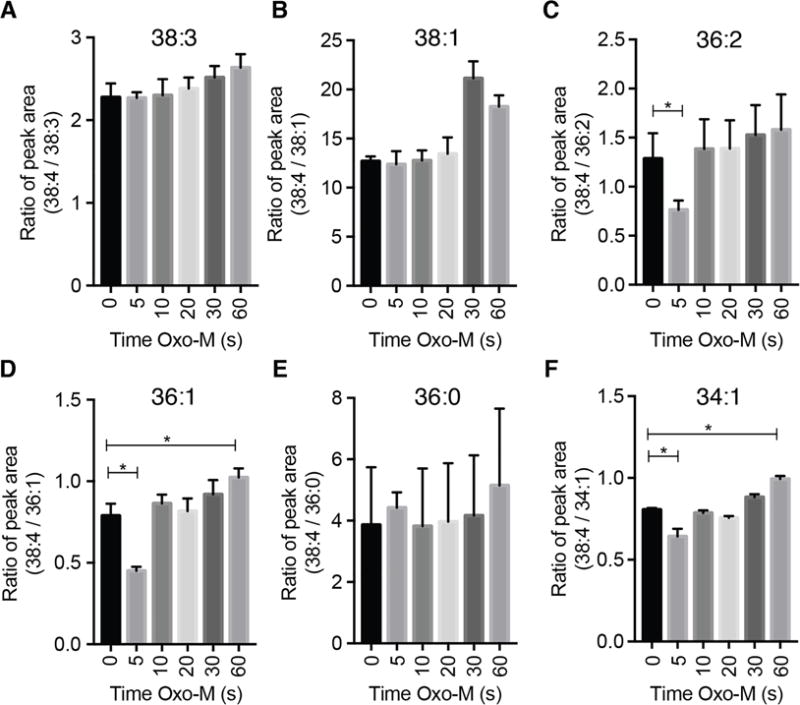
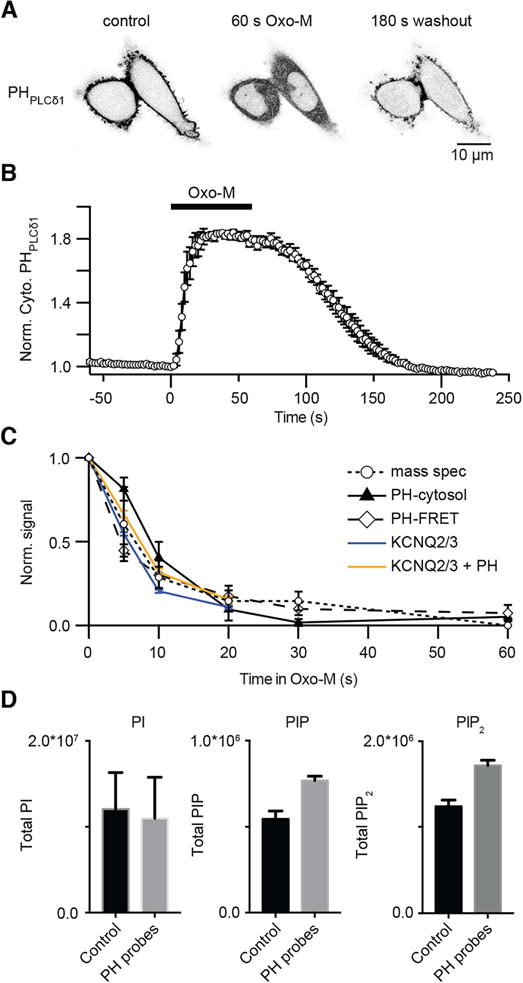
Phosphoinositides are rapidly turning-over phospholipids that play key roles in intracellular signaling and modulation of membrane effectors. Through technical refinements we have improved sensitivity in the analysis of the phosphoinositide PI, PIP, and PIP2 pools from living cells using mass spectrometry. This has permitted further resolution in phosphoinositide lipidomics from cell cultures and small samples of tissue. The technique includes butanol extraction, derivatization of the lipids, post-column infusion of sodium to stabilize formation of sodiated adducts, and electrospray ionization mass spectrometry in multiple reaction monitoring mode, achieving a detection limit of 20pg. We describe the spectrum of fatty-acyl chains in the cellular phosphoinositides. Consistent with previous work in other mammalian primary cells, the 38:4 fatty-acyl chains dominate in the phosphoinositides of the pineal gland and of superior cervical ganglia, and many additional fatty acid combinations are found at low abundance. However, Chinese hamster ovary cells and human embryonic kidney cells (tsA201) in culture have different fatty-acyl chain profiles that change with growth state. Their 38:4 lipids lose their dominance as cultures approach confluence. The method has good time resolution and follows well the depletion in <20s of both PIP2 and PIP that results from strong activation of Gq-coupled receptors. The receptor-activated phospholipase C exhibits no substrate selectivity among the various fatty-acyl chain combinations.

Keywords: Arachidonic acid; Lipidomics; Mass spectrometry; Phospholipids.


Figures

Fig. 1
Fig. 1
Calibration curves shown as responses to analytical internal standards for 37:4 PI, PIP, and PIP2 spiked into 106 tsA201 cells. Cells combined with internal standards were extracted and derivatized. Different quantities of extract were injected, specified as nanograms of the standard actually injected onto the C4 UPLC column. We used post-column sodium infusion (50 μM at 5 μl/min) and monitored the effluent with the Waters Xevo TQ MS/MS run in MRM mode using the fragmentation transitions identified in Fig. S3. (n = 3)
Fig.2
Fig.2
Fatty-acyl chains in phosphoinositide lipids of rat pineal glands. Mass spectrometry analysis of the fatty-acid composition of D-PI, D-PIP, and D-PIP2 in derivatized extracts from untreated pineal glands expressed as percent of the total pool of each major lipid type. Horizontal red lines are at 10% abundance. Note that bars are drawn here on a logarithmic scale to emphasize the broad dynamic range of detection of minor species and the dominance of 38:4 fatty acids in all three phosphoinositide classes. Each result is pooled from 5 pineal glands with three repeats (n = 3). Values are displayed as mean ± SEM.
Fig. 3
Fig. 3
Fatty acid compositions of phosphoinositides in SCG neurons compared with CHO and tsA201 cell lines. Experimental protocol and display are as for Fig. 2, but the results are shown on linear axes here. Red lines are at 10% abundance. (A) Superior cervical ganglia: data from four independent extractions, two ganglia per extraction. (B) CHO-M1 cells: ~106 cells harvested at 85–95% confluency (n = 3). (C) tsA-201 cells: ~106 cells harvested at 85–95% confluency (n = 7)
Fig. 4
Fig. 4
Fatty-acid unsaturation of phosphoinositides decreases as cultured cells become confluent. Phosphatidylinositides were extracted from tsA201-cells harvested at 40–70% confluency (“low confluency,” black) or >90% confluency (“high confluency,” gray) and analyzed in MRM mode for different fatty-acid compositions. (A) Bar graphs show ratio of peak areas (more-saturated:less-saturated). for 38:4 versus 36:1 and 36:2 versus 36:1 in PI, PIP, and PIP2. (B) Similar comparisons of the ratios of 38:4 versus 38:1, 38:2, and 38:3. Numbers in brackets indicate number of experiments. *: p <0.05 (t-test).
Fig. 5
Fig. 5
UPLC mass spectrometry detects cellular depletion in total PIP and PIP2 pools following activation of phospholipase C (PLC) in CHO-M1 cells. (A) Schematic of cellular phosphoinositide metabolism and the actions of PLC. (B) Summary histograms of the total PI, PIP, and PIP2 signals in control (0 s) and following 5 – 60 s oxotremorine-M (Oxo-M, 10 μM) to activate a stably expressed M1R receptor in the CHO cells (n = 5). Bars are sums of all fatty-acid species in their sodiated and protonated forms. (C) Changes in phosphoinositide lipids of rat pineal glands after stimulation by norepinephrine showing percent remaining in PI, PIP, and PIP2 pools after a 60 min incubation with 1 μM norepinephrine at 37°C compared to untreated control.
Fig. 6
Fig. 6
Relative constancy of fatty-acyl chain distribution in PIP2 as PIP2 is being depleted by Oxo-M-activated PLC. Lipids are analyzed in CHO-M1 cells at time points during activation of M1 muscarinic receptors by 10 μM Oxo-M (n = 5). Plotted are the ratios of 38:4 lipids to the indicated species. Same experiment as in Fig. 5B.
Fig. 7
Fig. 7
Comparison of four methods for monitoring kinetics of PIP2 depletion in cultured cells. (A) Inverted confocal micrographs from two CHO-M1 cells expressing the fluorescent YFP-PH PLCδ1 biosensor (dark in this negative image) before (Control), after 60-s in Oxo-M (10 μM), and after 180 s of washout. (B) Normalized time courses of YFP-PH PLCδ1 fluorescence from a region of interest in the cytoplasm, with application of Oxo-M (10 μM), a confocal experiment as in (A) (mean ± SEM, n = 7). Up in the graph indicates PIP2 depletion at the PM. (C) Normalized time courses of PIP2 depletion following 60 s application of Oxo-M (10 μM) as measured by three methods in CHO-M1 cells: mass spectrometry (open circles, n = 5), cytosolic translocation of YFP-PH PLCδ1 (filled triangles from (B)), and FRET measurements of RFP-PH PLCδ1 probes (open diamonds, n = 5). These data are compared with the time course of KCNQ current amplitude in receptor-transfected tsA201 cells (orange and blue lines) (published KCNQ data from Jensen et al, 2009). For KCNQ currents, one group of cells was cotransfected with RFP-PHPLCδ1 (orange line) and another was not (blue line). (D) Summary comparison of total resting PI, PIP, and PIP2 measured by mass spectrometry in CHO-M1 cells untransfected (black) or transfected with RFP-PH PLCδ1 probes (gray) (n = 3).

Similar articles

Cited by

References

    1. Balla T. Phosphoinositides: tiny lipids with giant impact on cell regulation. Physiol Rev. 2013;93:1019–1137. - PMC - PubMed
    1. Shewan A, Eastburn DJ, Mostov K. Phosphoinositides in cell architecture. Cold Spring Harb Perspect Biol. 2011;3:a004796. - PMC - PubMed
    1. Falkenburger BH, Jensen JB, Dickson EJ, Suh BC, Hille B. Phosphoinositides: lipid regulators of membrane proteins. The Journal of physiology. 2010;588:3179–3185. - PMC - PubMed
    1. Hille B, Dickson EJ, Kruse M, Vivas O, Suh BC. Phosphoinositides regulate ion channels. Biochim Biophys Acta. 2015;1851:844–856. - PMC - PubMed
    1. Wenk MR, Lucast L, Di Paolo G, Romanelli AJ, Suchy SF, Nussbaum RL, Cline GW, Shulman GI, McMurray W, De Camilli P. Phosphoinositide profiling in complex lipid mixtures using electrospray ionization mass spectrometry. Nat Biotechnol. 2003;21:813–817. - PubMed

Publication types