

Mathematical imaging methods for mitosis analysis in live-cell phase contrast microscopy
- PMID: 28189773
- PMCID: PMC6414815
- DOI: 10.1016/j.ymeth.2017.02.001
Mathematical imaging methods for mitosis analysis in live-cell phase contrast microscopy
Abstract
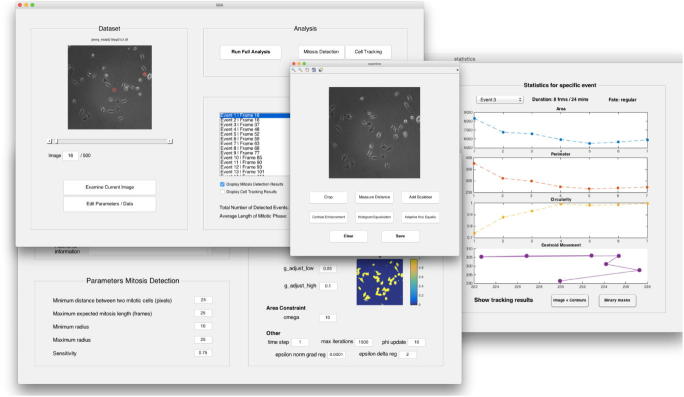
In this paper we propose a workflow to detect and track mitotic cells in time-lapse microscopy image sequences. In order to avoid the requirement for cell lines expressing fluorescent markers and the associated phototoxicity, phase contrast microscopy is often preferred over fluorescence microscopy in live-cell imaging. However, common specific image characteristics complicate image processing and impede use of standard methods. Nevertheless, automated analysis is desirable due to manual analysis being subjective, biased and extremely time-consuming for large data sets. Here, we present the following workflow based on mathematical imaging methods. In the first step, mitosis detection is performed by means of the circular Hough transform. The obtained circular contour subsequently serves as an initialisation for the tracking algorithm based on variational methods. It is sub-divided into two parts: in order to determine the beginning of the whole mitosis cycle, a backwards tracking procedure is performed. After that, the cell is tracked forwards in time until the end of mitosis. As a result, the average of mitosis duration and ratios of different cell fates (cell death, no division, division into two or more daughter cells) can be measured and statistics on cell morphologies can be obtained. All of the tools are featured in the user-friendly MATLAB®Graphical User Interface MitosisAnalyser.
Keywords: Cell tracking; Circular Hough transform; Level-set methods; Mitosis analysis; Phase contrast microscopy; Variational methods.
Copyright © 2017. Published by Elsevier Inc.
Figures


References
-
- Rittscher J. Characterization of biological processes through automated image analysis. Ann. Rev. Biomed. Eng. 2010;12:315–344. - PubMed
-
- Topham C.H., Taylor S.S. Mitosis and apoptosis: how is the balance set? Curr. Opin. Cell Biol. 2013;25(6):780–785. - PubMed
-
- Gascoigne K.E., Taylor S.S. Cancer cells display profound intra-and interline variation following prolonged exposure to antimitotic drugs. Cancer cell. 2008;14(2):111–122. - PubMed
-
- Rieder C.L., Maiato H. Stuck in division or passing through: what happens when cells cannot satisfy the spindle assembly checkpoint. Developmental cell. 2004;7(5):637–651. - PubMed
-
- Weaver B.A., Cleveland D.W. Decoding the links between mitosis, cancer, and chemotherapy: the mitotic checkpoint, adaptation, and cell death. Cancer cell. 2005;8(1):7–12. - PubMed
Publication types
MeSH terms
Grants and funding
LinkOut - more resources
Full Text Sources
Other Literature Sources
Research Materials
