. 2017 May 5:178:185-191.
doi: 10.1016/j.saa.2017.01.069. Epub 2017 Feb 2.

Dual time-resolved temperature-jump fluorescence and infrared spectroscopy for the study of fast protein dynamics

Affiliations

Dual time-resolved temperature-jump fluorescence and infrared spectroscopy for the study of fast protein dynamics

Caitlin M Davis et al. Spectrochim Acta A Mol Biomol Spectrosc. .

Abstract

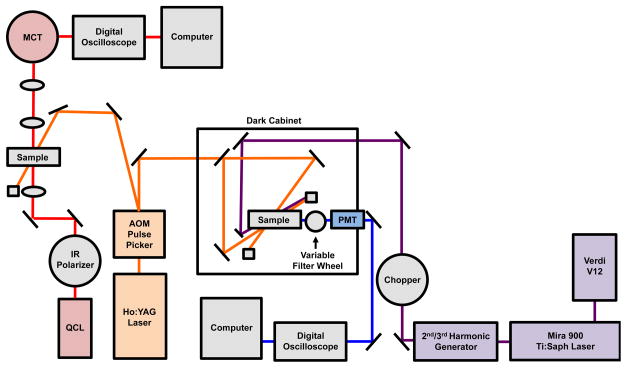
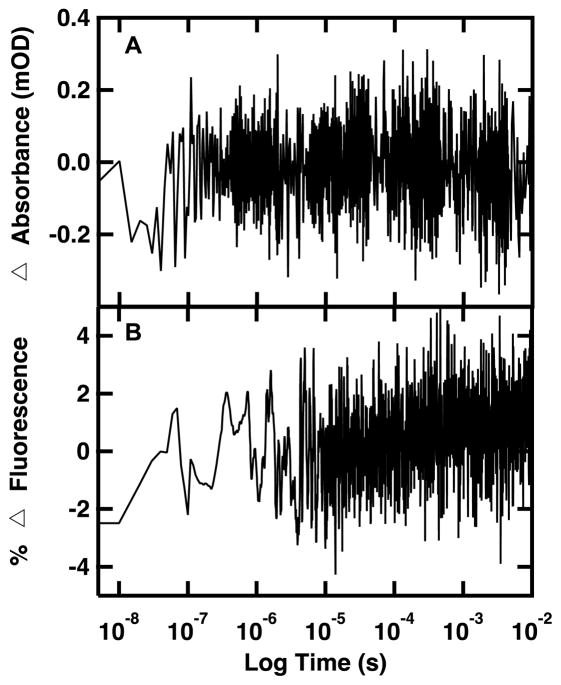
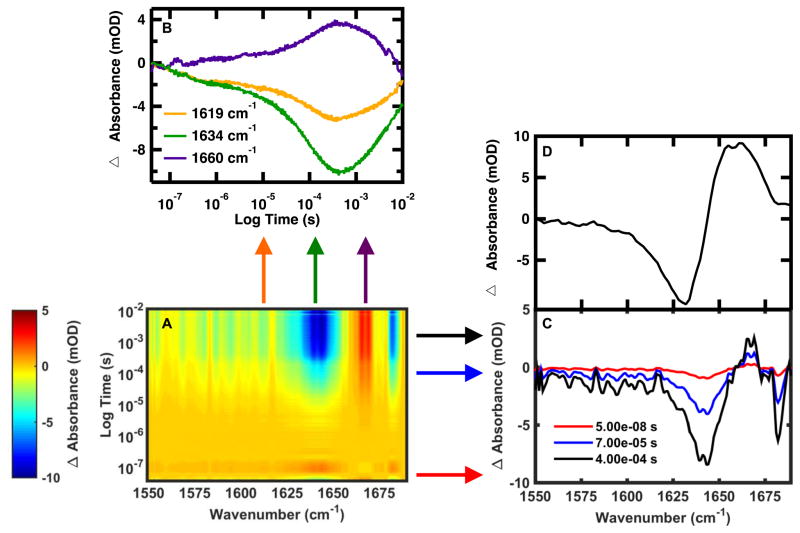
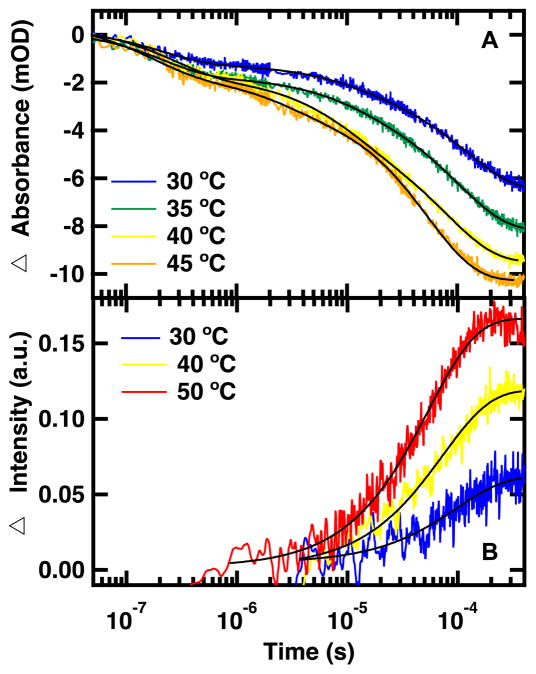
Time-resolved temperature-jump (T-jump) coupled with fluorescence and infrared (IR) spectroscopy is a powerful technique for monitoring protein dynamics. Although IR spectroscopy of the polypeptide amide I mode is more technically challenging, it offers complementary information because it directly probes changes in the protein backbone, whereas, fluorescence spectroscopy is sensitive to the environment of specific side chains. With the advent of widely tunable quantum cascade lasers (QCL) it is possible to efficiently probe multiple IR frequencies with high sensitivity and reproducibility. Here we describe a dual time-resolved T-jump fluorescence and IR spectrometer and its application to study protein folding dynamics. A Q-switched Ho:YAG laser provides the T-jump source for both time-resolved IR and fluorescence spectroscopy, which are probed by a QCL and Ti:Sapphire laser, respectively. The Ho:YAG laser simultaneously pumps the time-resolved IR and fluorescence spectrometers. The instrument has high sensitivity, with an IR absorbance detection limit of <0.2mOD and a fluorescence sensitivity of 2% of the overall fluorescence intensity. Using a computer controlled QCL to rapidly tune the IR frequency it is possible to create a T-jump induced difference spectrum from 50ns to 0.5ms. This study demonstrates the power of the dual time-resolved T-jump fluorescence and IR spectroscopy to resolve complex folding mechanisms by complementary IR absorbance and fluorescence measurements of protein dynamics.

Keywords: Fluorescence spectroscopy; Infrared spectroscopy; Protein folding; Quantum Cascade laser; Temperature-jump; WW domain.


Figures

Figure 1
Figure 1
Schematic of the dual time-resolved T-jump fluorescence and IR spectrometer. An AOM pulse picker reduces the repetition rate of the 50 Hz pulsed Q-switched Ho:YAG laser and produces the 2.09 μm pump radiation that is the source for both the IR and fluorescence T-jump. By using multiple quantum cascade lasers, the total frequency range spanned by the IR system is 1000–2250 cm−1. Fluorescence is excited using a mode-locked, frequency tripled Ti:Sapphire laser and emission is collected with a photomultiplier tube and an appropriate band pass filter.
Figure 2
Figure 2
Difference between two signal averaged D2O reference transients. (A) Difference IR absorbance transient of 20 mM potassium phosphate buffer (pD 7) detected at 1619 cm−1 with a 1000 shot average. (B) Difference fluorescence transient of 400 μM Trp in 20 mM potassium phosphate buffer (pD 7) excited at 285 nm and monitored at 350 nm using a 200 Ω resistor and a 5000 shot average.
Figure 3
Figure 3
Percent transmittance of the QCL probe beam through a 100 μM pinhole as a function of probe frequency. Error bars represent the standard deviation of three trials. Red lines represent one standard deviation from the average percent transmission through the pinhole. The FTIR absorbance spectrum of water vapor is overlaid for comparison (blue line, spectrum scaled for best comparison with QCL transmittance spectrum).
Figure 4
Figure 4
(A) Wavelength dependent time-resolved T-jump IR spectroscopy of FBP28-N,Q monitored in the amide I′ spectral region following a T-jump from 15 to 30 °C. Individual T-jump transients were collected at 1 cm−1 resolution from 1550 to 1690 cm−1. The change in absorbance (mOD) is indicated by the color. (B) Representative IR relaxation kinetics monitored at 1619, 1634 and 1660 cm−1. (C) T-jump induced difference absorbance spectrum of FBP28-N,Q recorded at 50 ns, 70 μs and 400 μs after the pump laser. (D) Equilibrium difference spectra obtained by subtracting the equilibrium FTIR spectrum at 15 °C from the spectrum at 30 °C.
Figure 5
Figure 5
Representative IR absorbance (A) and fluorescence (B) relaxation kinetics of FBP28-N,Q following T-jumps to the listed final temperatures. IR absorbance relaxation kinetics were monitored in the amide I′ spectral region at 1626 cm−1 following a 15 °C T-jump. Fluorescence relaxation kinetics were excited at 285 nm and monitored at 350 nm following a 10 °C T-jump. Differences in fluorescence response times are due to resistor selection. Data at 30 and 40 °C were collected using a 10,630 Ω resistor and data at 50 °C were collected using a 500 Ω resistor. A triple exponential fit is overlaid on the IR absorbance transients and a single exponential fit is overlaid on the fluorescence transients (Equation 1).

References

    1. Yang LW, Eyal E, Chennubhotla C, Jee J, Gronenborn AM, Bahar I. Structure. 2007;15:741. - PMC - PubMed
    1. Jamin M, Baldwin RL. Nat Struct Biol. 1996;3:613. - PubMed
    1. Roy R, Hohng S, Ha T. Nat Methods. 2008;5:507. - PMC - PubMed
    1. Dyer RB. Curr Opin Struct Biol. 2007;17:38. - PubMed
    1. Eaton WA, Munoz V, Hagen SJ, Jas GS, Lapidus LJ, Henry ER, Hofrichter J. Annu Rev Biophys Biomol Struct. 2000;29:327. - PMC - PubMed

LinkOut - more resources