. 2018 Feb;55(2):1590-1606.
doi: 10.1007/s12035-017-0436-3. Epub 2017 Feb 11.

Adaptor Complex 2 Controls Dendrite Morphology via mTOR-Dependent Expression of GluA2

Affiliations

Adaptor Complex 2 Controls Dendrite Morphology via mTOR-Dependent Expression of GluA2

Alicja Koscielny et al. Mol Neurobiol. 2018 Feb.

Abstract

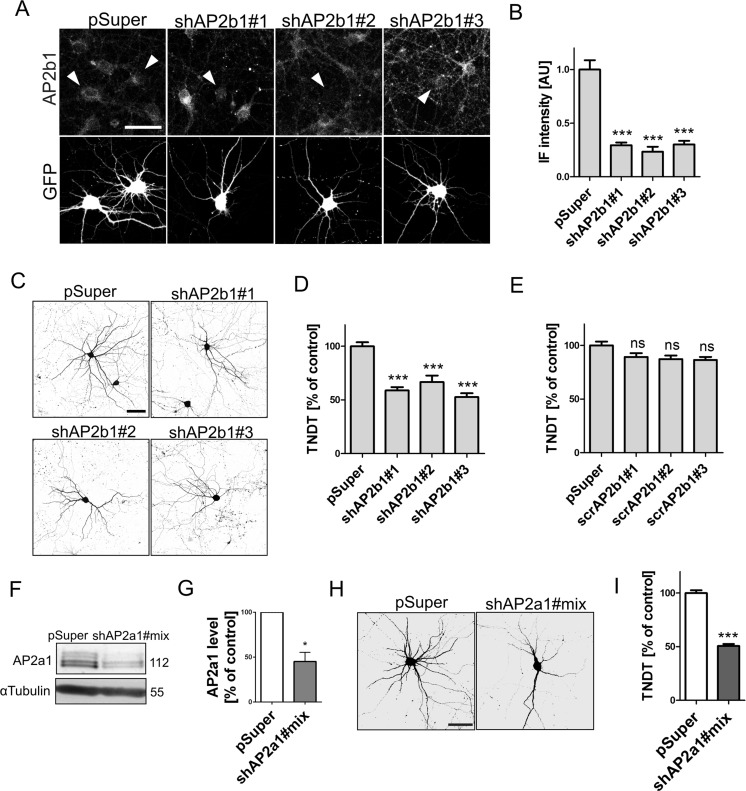
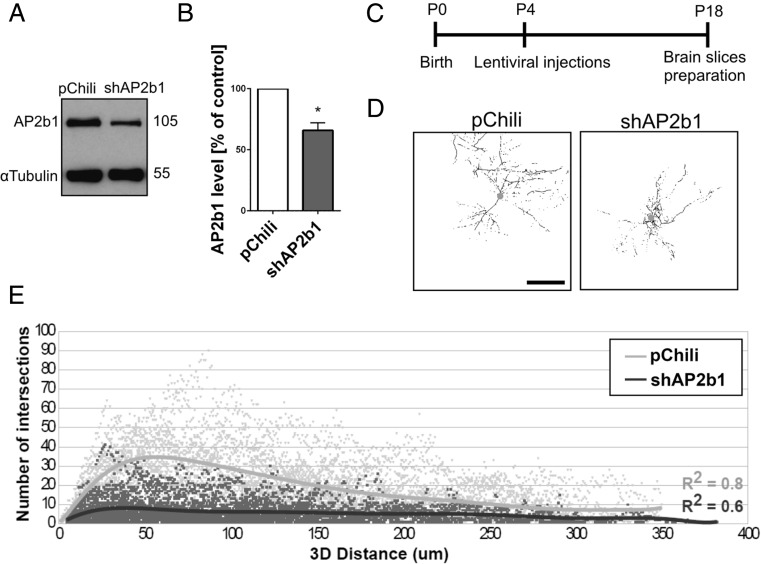
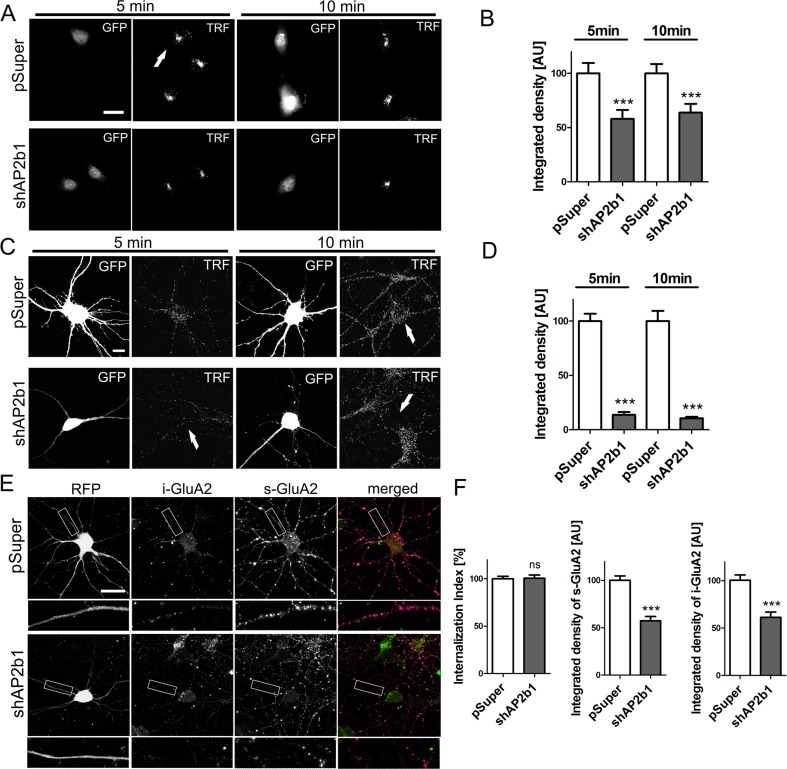
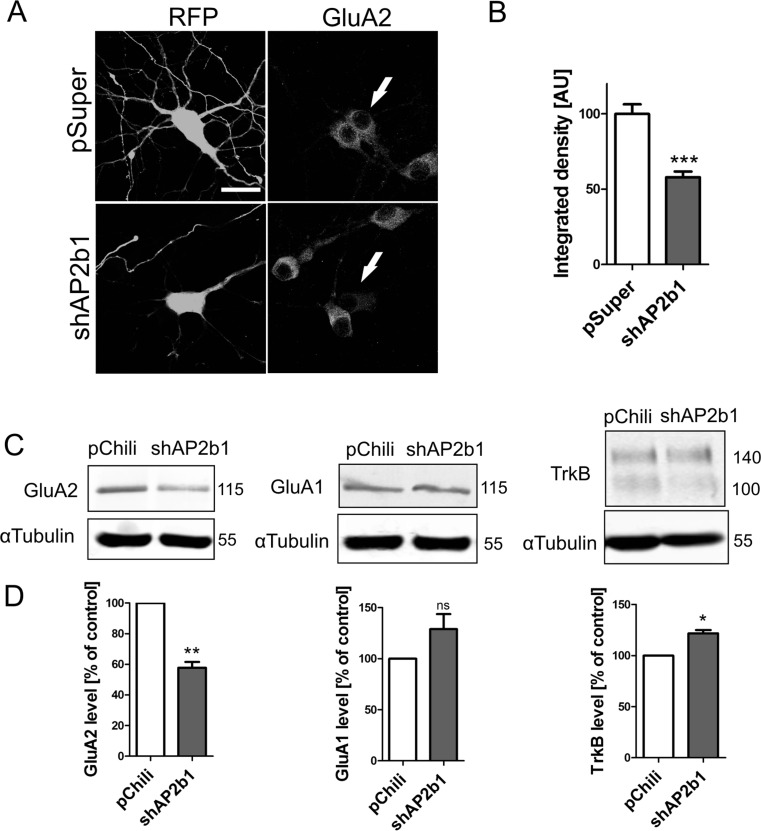
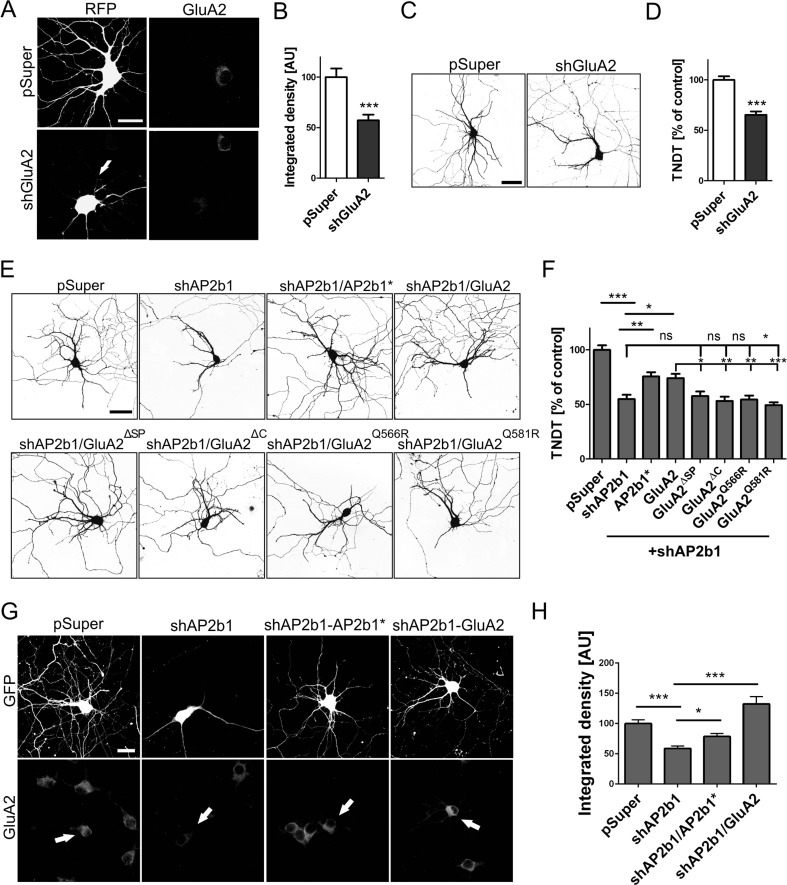
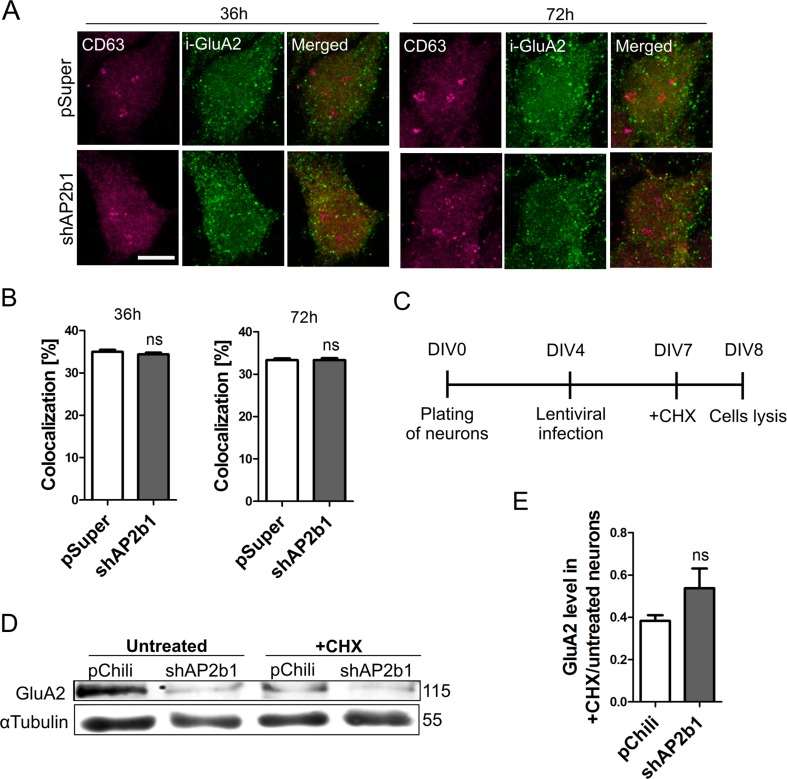
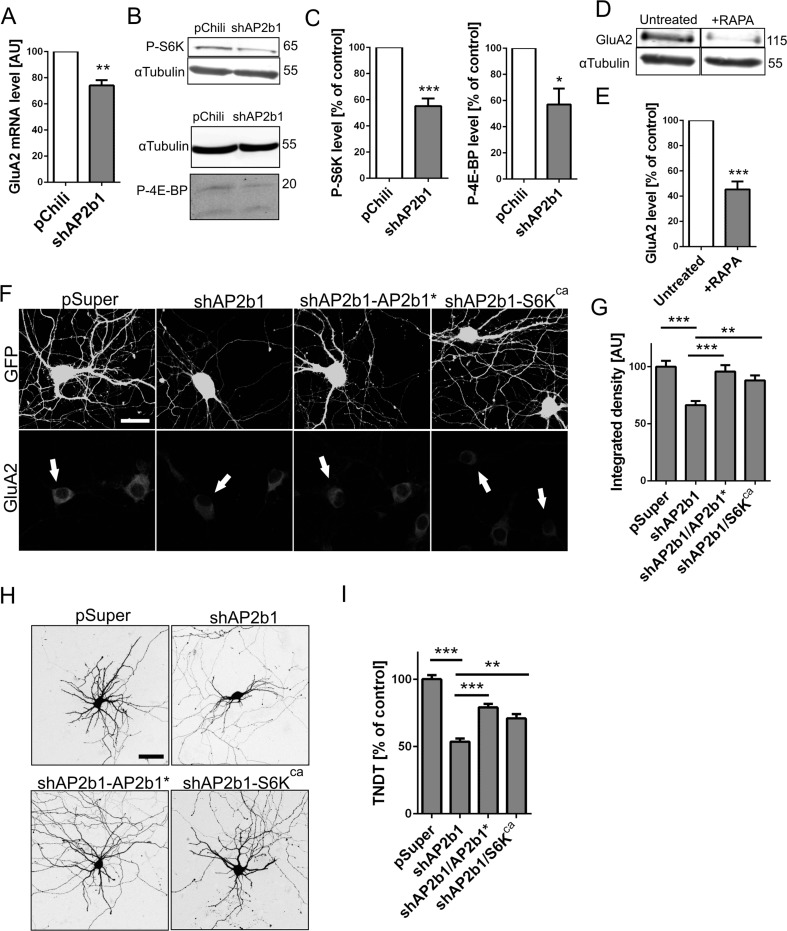
The formation of dendritic arbors in neurons is a highly regulated process. Among the regulators of dendritogenesis are numerous membrane proteins that are eventually internalized via clathrin-mediated endocytosis. AP2 is an adaptor complex that is responsible for recruiting endocytic machinery to internalized cargo. Its direct involvement in dendritogenesis in mammalian neurons has not yet been tested. We found that the knockdown of AP2b1 (β2-adaptin), an AP2 subunit, reduced the number of dendrites in developing rat hippocampal neurons and decreased α-amino-3-hydroxy-5-methyl-4-isoxazolepropionic acid (AMPA) receptor subunit GluA2 levels by inhibiting mechanistic/mammalian target of rapamycin (mTOR). The dendritic tree abruption that was caused by AP2b1 knockdown was rescued by the overexpression of GluA2 or restoration of the activity of the mTOR effector p70S6 kinase (S6K1). Altogether, this work provides evidence that the AP2 adaptor complex is needed for the dendritogenesis of mammalian neurons and reveals that mTOR-dependent GluA2 biosynthesis contributes to this process.

Keywords: AP2b1; Dendritic arbor; GluA2; mTOR.


Conflict of interest statement

None of the authors have any financial or non-financial competing interests in the manuscript.

Figures

Fig. 1
Fig. 1
AP2 controls dendritic arbor morphology in neurons cultured in vitro. a Representative confocal images of DIV10 cultured hippocampal neurons immunofluorescently stained for AP2b1. Cells were transfected on DIV8 for 2 days as indicated. Neurons were additionally co-transfected with GFP-encoding plasmid for the identification of transfected cells (arrowheads). Scale bar = 50 μm. b Quantification of level of AP2b1 immunofluorescence in the cell body of neurons transfected as in a. The data are expressed as a mean value normalized to control ± SEM. ***p < 0.001 (Kruskal-Wallis test followed by Dunn’s multiple-comparison test). Cell images were obtained from two independent culture batches. Number of cells per variant (n): pSuper (22), shAP2b1#1 (23), shAP2b1#2 (18), and shAP2b1#3 (22). c Representative confocal images of cultured hippocampal neurons transfected on DIV8 for 4 days as indicated. Neuron morphology was visualized by co-transfection with GFP. Scale bar = 50 μm. d Total number of dendritic tips (TNDT) of neurons transfected as in c. The data are expressed as a mean value normalized to control ± SEM. ***p < 0.001 (Kruskal-Wallis test followed by Dunn’s multiple-comparison test). Cell images were obtained from two independent culture batches. Number of cells per variant (n): pSuper (36), shAP2b1#1 (36), shAP2b1#2 (17), and shAP2b1#3 (37). e TNDT of hippocampal neurons transfected on DIV8 for 4 days with a plasmids scrambled shRNAs against AP2b1. The data are expressed as a mean value normalized to control ± SEM. ns, nonsignificant (Kruskal-Wallis test followed by Dunn’s multiple-comparison test). Cell images were obtained from two independent culture batches. Number of cells per variant (n): pSuper (25), scrAP2b1#1 (20), scrAP2b1#2 (21), and scrAP2b1#3 (21). f Western blot analysis of α-adaptin (AP2a1) and tubulin in protein lysates obtained from cortical neurons nucleofected on DIV0 for 2 days with empty pSuper or a pool of pSuper plasmids that encoded shRNAs against α-adaptin. g Results of quantitative WB analysis of cell lysates obtained from neurons nucleofected as in f. *p < 0.05 (one-sample t test). Number of independent experiments (N) = 3. Error bars indicate SEM. h Representative confocal images of cultured hippocampal neurons transfected on DIV7 for 3 days as indicated. Neuron morphology was visualized by co-transfection with GFP-encoding plasmid. Scale bar =50 μm. i TNDT of neurons transfected as in h. The data are expressed as a mean value normalized to control ± SEM. ***p < 0.001 (Mann-Whitney test). Cell images were obtained from four independent culture batches. Number of cells per variant (n): pSuper (78) and shAP2a1#mix (75)
Fig. 2
Fig. 2
AP2 controls dendritic arbor morphology in vivo. a Western blot analysis of AP2b1 in protein lysates obtained from cultured hippocampal neurons infected with Lv-Chili or Lv-Chili-shAP2b1 on DIV4 for 6 days. b Results of quantitative WB analysis of cell lysates obtained from neurons transduced as in a. *p < 0.05 (one-sample t test). Number of independent experiments (N) = 4. Error bars indicate SEM. c The time-course of the experiment. d Representative 3D reconstructions of CA1 hippocampal neurons of rats transduced with Lv-Chili or Lv-Chili-shAP2b1 on P4 for 2 weeks. Scale bar = 100 μm. e Results of 3D Sholl analysis of CA1 hippocampal neurons from rats treated as in b. The data are expressed as the number of intersections as a function of the 3D distance from the soma. R 2 values = 0.8 for Lv-Chili (good fit) and 0.6 for Lv-Chili-shAP2b1 (satisfactory fit). Cell images were obtained from eight (Lv-Chili) or five (Lv-Chili-shAP2b1) animals. Number of cells per variant (n): Lv-Chili (28) and Lv-Chili-shAP2b1 (34)
Fig. 3
Fig. 3
In developing neurons, AP2 contributes to endocytosis of transferrin receptor but not GluA2 under basal culture conditions. a Representative confocal images of RAT2 fibroblasts exposed to fluorescently labeled transferrin. Cells were electroporated for 2 days with empty pSuper or pSuper-shAP2b1#2 (shAP2b1) and pEGFP-C1 for the identification of transfected cells (arrows). After 2 days, the cells were starved overnight prior to 5 or 10 min fluorescently labeled transferrin uptake. Scale bar = 20 μm. b Quantification of integrated density of transferrin fluorescence in the cell body of RAT2 fibroblasts transfected and treated as in a. The data are expressed as a mean value normalized to control. Error bars indicate SEM. ***p < 0.001 (Mann-Whitney test). Cell images were obtained from four independent culture batches. Number of cells per variant (n): pSuper (55) and shAP2b1 (49) for 5 min uptake and pSuper (72) and shAP2b1 (52) for 10 min uptake. c Representative confocal images of cultured hippocampal neurons exposed to fluorescently labeled transferrin. DIV7 neurons were transfected (arrows) for 3 days as indicated. On DIV10, cells were starved for 3 h prior to 5 or 10 min fluorescent transferrin uptake. Scale bar = 10 μm. d Quantification of integrated density of transferrin fluorescence in the cell body of neurons transfected and treated as in c. The data are expressed as a mean value normalized to control. Error bars indicate SEM. ***p < 0.001 (Mann-Whitney test). Cell images were obtained from five independent culture batches. Number of cells per variant (n): pSuper (44) and shAP2b1 (52) for 5 min uptake and pSuper (50) and shAP2b1 (50) for 10 min uptake. e Representative confocal images of cultured hippocampal neurons transfected as indicated on DIV7 for 3 days and subjected to the GluA2 internalization assay. i-GluA2, internalized pool of GluA2; s-GluA2, surface pool of GluA2. Scale bar = 20 μm. f Quantitative analysis of integrated density of s-GluA2 and i-GluA2 dendritic fluorescence and GluA2 internalization index in neurons transfected and treated as in e. For s-GluA2 and i-GluA2, the data are expressed as a mean value normalized to control ± SEM. The internalization index was calculated using the following formula: i-GluA2/s-GluA2 + i-GluA2. The results are presented as a mean value normalized to control ± SEM. ns, nonsignificant; ***p < 0.001 (Mann-Whitney test). Cell images were obtained from five independent culture batches. Number of cells per variant (n): pSuper (50) and shAP2b1 (48)
Fig. 4
Fig. 4
AP2 regulates cellular level of GluA2. a Representative confocal images of neurons transfected (arrows) as in Fig. 3e and immunofluorescently stained for GluA2. Scale bar = 20 μm. b Quantitative analysis of total level of GluA2 immunofluorescence in neurons transfected as in Fig. 3e. The integrated density of GluA2 immunofluorescence in cell bodies of transfected cells was normalized to that in non-transfected neurons. The data are expressed as a mean value normalized to control. Error bars indicate SEM. ***p < 0.001 (Mann-Whitney test). Cell images were obtained from six independent culture batches. Number of cells per variant (n): pSuper (48) and shAP2b1 (50). c Western blot analysis of GluA2, GluA1, and TrkB in protein lysates obtained from cultured hippocampal neurons infected with Lv-Chili or Lv-Chili-shAP2b1 on DIV4 for 6 days. d Results of quantitative WB analysis. ns, nonsignificant; *p < 0.05, **p < 0.01 (one-sample t test). Number of independent experiments (N): GluA2 (4), GluA1 (4), and TrkB (3). Error bars indicate SEM
Fig. 5
Fig. 5
GluA2 is required for AP2b1-dependent proper dendritic arbor morphology. a Representative confocal images of cultured hippocampal neurons transfected (arrows) on DIV7 for 3 days and immunofluorescently stained as indicated. Scale bar = 20 μm. b Quantitative analysis of total level of GluA2 immunofluorescence in neurons transfected as in a. The integrated density of GluA2 immunofluorescence in transfected cells (cell body) was normalized to that in non-transfected neurons. The data are expressed as a mean value normalized to control. Error bars indicate SEM. ***p < 0.001 (Mann-Whitney test). Cell images were obtained from four independent culture batches. Number of cells per variant (n): pSuper (32) and shAP2b1 (32). c Representative confocal images of cultured hippocampal neurons transfected on DIV7 for 3 days as indicated. Neuron morphology was visualized by co-transfection with GFP-encoding plasmid. Scale bar = 50 μm. d Total number of dendritic tips (TNDT) of neurons transfected as in c. The data are expressed as a mean value normalized to control. Error bars indicate SEM. ***p < 0.001 (Mann-Whitney test). Cell images were obtained from four independent culture batches. Number of cells per variant (n): pSuper (40) and shGluA2 (40). e Representative confocal images of cultured hippocampal neurons transfected on DIV7 for 3 days as indicated. The GFP-encoding plasmid was co-transfected to visualize neuron morphology. Scale bar = 50 μm. f TNDT of neurons transfected as in e. The data are expressed as a mean value normalized to control. Error bars indicate SEM. ns, nonsignificant; ***p < 0.001, **p < 0.01, *p < 0.05 (one-way ANOVA test followed by Bonferroni multiple-comparison test). Cell images were obtained from three independent culture batches. Number of cells per variant (n): all variants (30), except from pSuper (29). g Representative confocal images of cultured hippocampal neurons transfected (arrows) on DIV7 for 3 days and immunofluorescently stained as indicated. Scale bar = 20 μm. h Quantitative analysis of total level of GluA2 immunofluorescence in neurons transfected as in g. The integrated density of GluA2 immunofluorescence in transfected cells (cell body) was normalized to that in non-transfected neurons. The data are expressed as a mean value normalized to control. Error bars indicate SEM. *p < 0.05, ***p < 0.001 (Kruskal-Wallis test followed by Dunn’s multiple-comparison test). Cell images were obtained from three independent culture batches. Number of cells per variant (n): pSuper (32), shAP2b1 (31), shAP2b1/AP2b1* (30), and shAP2b1/GluA2 (29)
Fig. 6
Fig. 6
Lack of AP2b1 does not influence lysosomal targeting and degradation of GluA2. a Representative confocal images of cultured hippocampal neurons transfected as indicated, immunofluorescently stained for pool of internalized GluA2 (i-GluA2, green) and lysosomal marker CD63 (magenta). Scale bar = 5 μm. b Results of colocalization analysis of i-GluA2 with CD63 in the cell soma of neurons transfected and treated as in a. The data are expressed as a mean value normalized to control. Error bars indicate SEM. ns, nonsignificant (Mann-Whitney test). Cell images were obtained from three independent culture batches. Number of cells per variant (n): pSuper (26) and shAP2b1 (28) for 36 h; pSuper (30) and shAP2b1 (29) for 72 h. c The time-course of the experiment. d Representative Western blot showing GluA2 levels in protein extracts obtained from cultured hippocampal neurons infected with Lv-Chili (control) or Lv-Chili-shAP2b1 on DIV4 for 4 days and treated as indicated in c. e Results of qWB analysis of GluA2 degradation in cells treated as in c. The data are expressed as a ratio of GluA2 levels in CHX-treated neurons to untreated cells. GluA2 levels were normalized to tubulin. ns, nonsignificant (Mann-Whitney test). Number of independent experiments N = 3. Error bars indicate SEM
Fig. 7
Fig. 7
AP2 controls GluA2 levels via mTORC1. a GluA2 mRNA levels in cultured hippocampal neurons infected with Lv-Chili (control) or Lv-Chili-shAP2b1 on DIV4 for 6 days. **p < 0.01 (one-sample t test). Number of independent experiments N = 4. Error bars indicate SEM. b Representative Western blot showing phospho-S6K (T389) (P-S6K) and phospho-4E-BP1 (T37/46) (P-4E-BP) levels in protein lysates obtained from neurons infected as in a. c Results of qWB analysis of P-S6K and P-4E-BP levels, normalized to tubulin, in protein lysates from neurons infected as in a. ***p < 0.001, *p < 0.05 (one-sample t test). Number of independent experiments N = 6 (P-S6K) and N = 4 (P-4E-BP). Error bars indicate SEM. d Representative Western blot showing levels of GluA2 in protein extracts obtained from control DIV9 neurons or cells after 2 days rapamycin (RAPA, 100 nM) treatment. e Results of qWB analysis of GluA2 levels, normalized to tubulin, in protein extracts of cells treated as in d. ***p < 0.001 (one-sample t test). Number of independent experiments N = 5. Error bars indicate SEM. f Representative confocal images of cultured hippocampal neurons transfected on DIV7 for 3 days as indicated. Cells were immunofluorescently stained for GluA2. GFP was co-transfected to identify transfected neurons (arrows). Scale bar = 20 μm. g Quantitative analysis of total levels of GluA2 immunofluorescence in neurons transfected as in f. The integrated density of GluA2 immunofluorescence in cell bodies of transfected cells was normalized to that in non-transfected neurons. The data are expressed as a mean value normalized to control. Error bars indicate SEM. ***p < 0.001, **p < 0.01 (Kruskal-Wallis test followed by Dunn’s multiple-comparison test). Cell images were obtained from four independent culture batches. Number of cells per variant (n): pSuper (39), shAP2b1 (46), shAP2b1/AP2b1* (40), and shAP2b1/S6Kca (42). h Representative confocal images of cultured hippocampal neurons transfected on DIV7 for 3 days as indicated. Scale bar = 50 μm. i Total number of dendritic tips (TNDT) of neurons transfected as in h. The data are expressed as a mean value normalized to control. Error bars indicate SEM. ***p < 0.001, **p < 0.01 (Kruskal-Wallis test followed by Dunn’s multiple-comparison test). Cell images were obtained from five independent culture batches. Number of cells per variant (n): pSuper (50), shAP2b1 (50), shAP2b1/AP2b1* (47), and shAP2b1/S6Kca (47)

References

    1. Stuart G, Spruston N, Häusser M. Dendrites. 2. Oxford: Oxford University Press; 2007.
    1. Urbanska M, Blazejczyk M, Jaworski J. Molecular basis of dendritic arborization. Acta Neurobiol Exp Wars. 2008;68:264–288. - PubMed
    1. Jan YN, Jan LY. Branching out: mechanisms of dendritic arborization. Nat Rev Neurosci. 2010;11:316–328. doi: 10.1038/nrn2836. - DOI - PMC - PubMed
    1. Dong X, Shen K, Bülow HE. Intrinsic and extrinsic mechanisms of dendritic morphogenesis. Annu Rev Physiol. 2015;77:271–300. doi: 10.1146/annurev-physiol-021014-071746. - DOI - PubMed
    1. McMahon HT, Boucrot E. Molecular mechanism and physiological functions of clathrin-mediated endocytosis. Nat Rev Mol Cell Biol. 2011;12:517–533. doi: 10.1038/nrm3151. - DOI - PubMed

Publication types

Substances