. 2017 Mar 2;100(3):406-413.
doi: 10.1016/j.ajhg.2017.01.017. Epub 2017 Feb 9.

Who's Who? Detecting and Resolving Sample Anomalies in Human DNA Sequencing Studies with Peddy

Affiliations

Who's Who? Detecting and Resolving Sample Anomalies in Human DNA Sequencing Studies with Peddy

Brent S Pedersen et al. Am J Hum Genet. .

Abstract

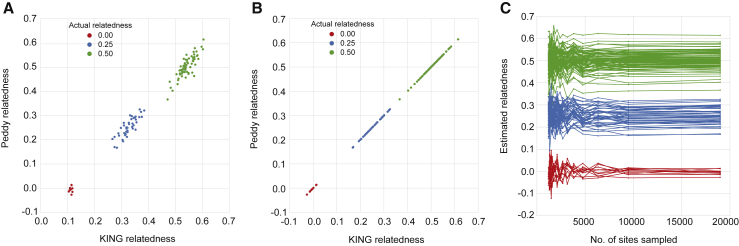
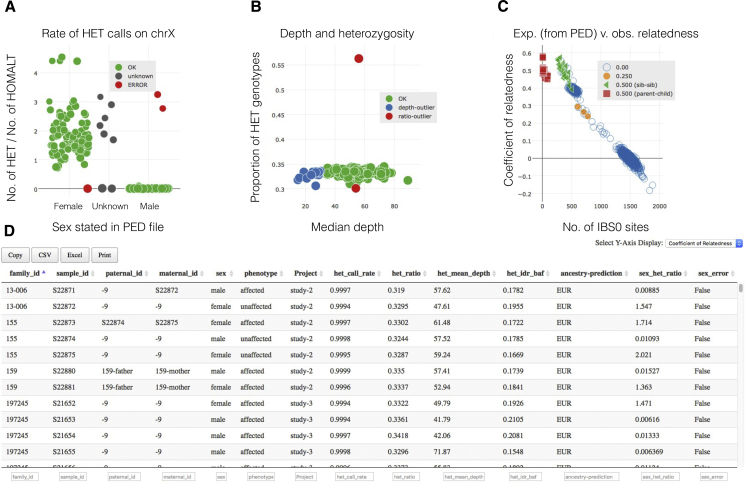
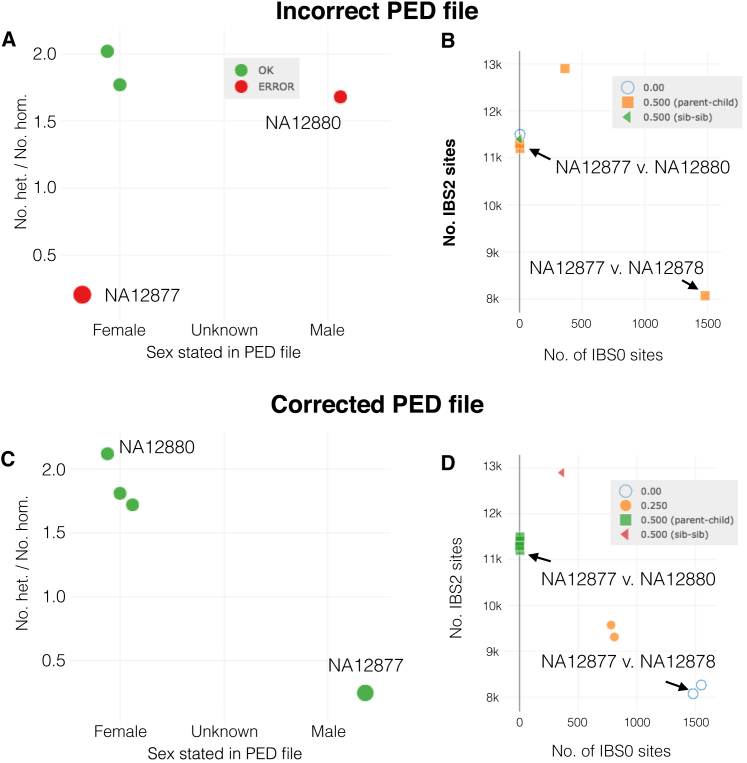
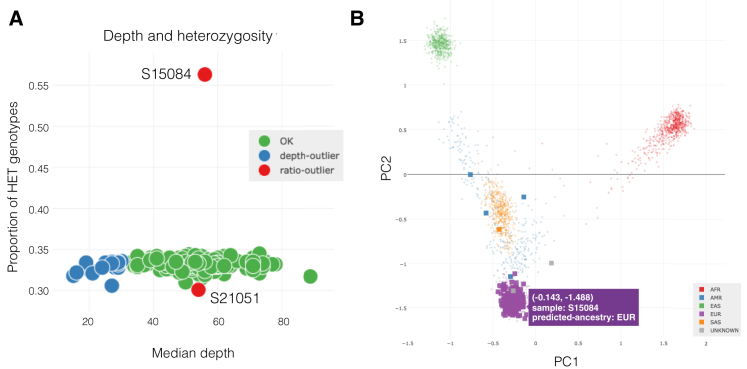
The potential for genetic discovery in human DNA sequencing studies is greatly diminished if DNA samples from a cohort are mislabeled, swapped, or contaminated or if they include unintended individuals. Unfortunately, the potential for such errors is significant since DNA samples are often manipulated by several protocols, labs, or scientists in the process of sequencing. We have developed a software package, peddy, to identify and facilitate the remediation of such errors via interactive visualizations and reports comparing the stated sex, relatedness, and ancestry to what is inferred from the individual genotypes derived from whole-genome (WGS) or whole-exome (WES) sequencing. Peddy predicts a sample's ancestry using a machine learning model trained on individuals of diverse ancestries from the 1000 Genomes Project reference panel. Peddy facilitates both automated and interactive, visual detection of sample swaps, poor sequencing quality, and other indicators of sample problems that, if left undetected, would inhibit discovery.

Keywords: QC; VCF; genetic variation; pedigree; quality control; sample mixup.


Figures

Figure 1
Figure 1
Validation and Convergence of Sampling Method A comparison of the relatedness coefficient estimated by KING (KING estimates kinship which is 0.5 relatedness) compared to that from peddy, using genotype data from the CEPH1463 pedigree (A). A similar comparison when the relatedness estimate is restricted to the subset of 23,556 sites used by peddy (B). Convergence of peddy’s relatedness estimate as a function of the number of sites sampled (C). The three clusters of converging lines reflect the estimated relatedness among pairs of individuals with an actual relatedness of 0.0, 0.25, and 0.5, respectively. The estimated relatedness rapidly stabilizes to the actual relatedness statistic when at least 5,000 markers are used.
Figure 2
Figure 2
Interactive Website for Identifying and Resolving Sample Mix-ups and Quality Issues The sex check (A), heterozygosity (B), relatedness (C), and ancestry (not shown; see Figure 4B) plots are interlinked such that clicking in a single point in one plot will highlight all points germane to the selected individual in the other plots. Moreover, the sample information table (D) can be sorted, filtered, and selected to focus the visualization and interpretation to desired subsets of individuals or families.
Figure 3
Figure 3
Using Peddy to Visualize a Manufactured Error in a CEPH Pedigree Two individuals (red) where the sex stated in the PED file does not match that inferred from the rate of heterozygous calls on the non-pseudo autosomal region of the X chromosome are shown in (A). In the relatedness plot (B), we can see that the swap has caused unexpected relationships (or lack thereof) for both individuals. In (C) and (D), these errors have been resolved by switching the names of the sample in the PED.
Figure 4
Figure 4
Depth, Heterozygosity, and Ancestry (A) Outlier individuals with unexpectedly high and low proportions of heterozygous (HET) genotypes. (B) A PCA analysis is conducted and an SVM trained on the 1000 Genomes samples (small background points) is used to predict the ancestry of each of the individuals in a study (large square points).
Figure 5
Figure 5
Relatedness with IBS2 or CoR We compare plots with IBS2 (A) or the coefficient of relatedness (B) for the same data. The coefficient of relatedness provides an intuitive metric with which to validate that, for example, siblings have a CoR of 0.5 and unrelated pairs have a CoR of around 0. However, IBS2 often provides better visual separation of clusters even with lower-quality data. The cluster of blue points with an IBS0 around 500 and IBS2 around 12K are clearly unrelated in the IBS2 plot (A), but in the relatedness plot, they appear to cluster almost with the cluster of sibling-sibling pairs (green triangles). This blue cluster is all from a single sample with a high rate of heterozygote calls that skews the relatedness calculation.
Figure 6
Figure 6
Sex Plot and Sample Selection Upon observing a potential sample-swap in (A) with two members from the same family, we can leverage the table selection tool (not shown) to highlight solely the relevant family in the relatedness plot (B). In so doing, we verify that this is a husband-wife pair where both have the expected relation to their child. This allows one to infer that the husband and wife labels have been swapped.

References

    1. Purcell S., Neale B., Todd-Brown K., Thomas L., Ferreira M.A.R., Bender D., Maller J., Sklar P., de Bakker P.I.W., Daly M.J., Sham P.C. PLINK: a tool set for whole-genome association and population-based linkage analyses. Am. J. Hum. Genet. 2007;81:559–575. - PMC - PubMed
    1. Miller C.A., Qiao Y., DiSera T., D’Astous B., Marth G.T. bam.iobio: a web-based, real-time, sequence alignment file inspector. Nat. Methods. 2014;11:1189. - PMC - PubMed
    1. Li H., Handsaker B., Wysoker A., Fennell T., Ruan J., Homer N., Marth G., Abecasis G., Durbin R., 1000 Genome Project Data Processing Subgroup The Sequence Alignment/Map format and SAMtools. Bioinformatics. 2009;25:2078–2079. - PMC - PubMed
    1. Manichaikul A., Mychaleckyj J.C., Rich S.S., Daly K., Sale M., Chen W.-M. Robust relationship inference in genome-wide association studies. Bioinformatics. 2010;26:2867–2873. - PMC - PubMed
    1. Heinrich V., Kamphans T., Mundlos S., Robinson P.N., Krawitz P.M. A likelihood ratio-based method to predict exact pedigrees for complex families from next-generation sequencing data. Bioinformatics. 2017;33:72–78. - PMC - PubMed

LinkOut - more resources