. 2017 Feb 21;46(2):205-219.
doi: 10.1016/j.immuni.2017.01.003. Epub 2017 Feb 9.

CD8+ T Cells Orchestrate pDC-XCR1+ Dendritic Cell Spatial and Functional Cooperativity to Optimize Priming

Affiliations

CD8+ T Cells Orchestrate pDC-XCR1+ Dendritic Cell Spatial and Functional Cooperativity to Optimize Priming

Anna Brewitz et al. Immunity. .

Abstract

Adaptive cellular immunity is initiated by antigen-specific interactions between T lymphocytes and dendritic cells (DCs). Plasmacytoid DCs (pDCs) support antiviral immunity by linking innate and adaptive immune responses. Here we examined pDC spatiotemporal dynamics during viral infection to uncover when, where, and how they exert their functions. We found that pDCs accumulated at sites of CD8+ T cell antigen-driven activation in a CCR5-dependent fashion. Furthermore, activated CD8+ T cells orchestrated the local recruitment of lymph node-resident XCR1 chemokine receptor-expressing DCs via secretion of the XCL1 chemokine. Functionally, this CD8+ T cell-mediated reorganization of the local DC network allowed for the interaction and cooperation of pDCs and XCR1+ DCs, thereby optimizing XCR1+ DC maturation and cross-presentation. These data support a model in which CD8+ T cells upon activation create their own optimal priming microenvironment by recruiting additional DC subsets to the site of initial antigen recognition.

Keywords: CCL3; CCL4; CCR5; CXCR3; XCL1; chemokine; cooperation; migration; spatiotemporal; viral infection.


Figures

Figure 1
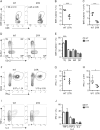
Figure 1. pDC maximize CD8+ T cell responses
(A–E) Analysis of B8R20 specific CD8+ T cell responses d8 p.i. (MVA OVA f.p.), comparing WT and Clec4c+/DTR animals treated with DTX (0.1 μg/day; d-2 to d3), showing (A) representative B8R20 multimer staining, (B) relative and (C) absolute numbers of CD8+ T cells specific for B8R20. (D, E) Relative distribution of B8R20-specific memory subsets indicated by the markers KLRG1 and CD127, shown as representative original plots (D) and as relative numbers (E). (F–J) Cytokine production of CD8+ T cells upon in vitro restimulation with B8R20 peptide showing (F) representative plots, (G) relative and (H) absolute numbers of IFN-γ-producing CD8+ T cells. (I, J) Polyfunctionality of CD8+ T cells (gated on IFN-γ+) shown as (I) representative plot or (J) relative numbers. TE – terminal effector cells, DN – double negative cells, MP – memory precursor cells, DP – double positive cells. Data are shown as mean ± standard deviation and are representative of four independent experiments analyzing at least 3 mice per group. *** = p≤0.001, * = p≤0.05. See also Figure S1.
Figure 2
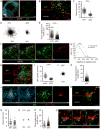
Figure 2. pDC are recruited to infected macrophages and CD8+ T cell priming sites
(A) Immunofluorescent (IF) images of the popliteal lymph node (pLN) from a SiglechGFP/GFP mouse showing the distribution of pDC in the steady state. (B) Image from intravital microscopy (IVM), see also Movie S1. (C–E) Steady state migration analysis of pDC and OT-I T cells in the interfollicular area showing the speed (C), translated tracks (D) and track displacement (E). (F) IF images of the subcapsular sinus (SCS) area 10hrs p.i. (G) Spatial frequency distribution of pDC in the LN before and after infection. (H) Image from IVM showing pDC and infected macrophages 9hrs p.i., see also Movie S2. (I) Migration analysis of pDC at the SCS showing speed (I), translated tracks (J) and track displacement (K) p.i. (L) IF images of the LN paracortex 10hrs p.i. showing OT-I T cell and pDC co-cluster. (M) Image from IVM showing pDC co-clustering with OT-I T cells, see also Movie S3. (N–P) Migration analysis of pDC and OT-I co-cluster 9hrs after infection showing the speed (N), translated tracks (O) and track displacement (P). (Q) Images from IVM showing pDC migration towards an OT-I cluster, see also Movie S2. Mice were infected with MVA OVA or MVA OVA tdTomato. Data are representative of more than four independent experiments analyzing at least 3 mice per group. Red bars indicate mean values. Scale bars: 200 μm (A), 50μm (B, H), 30μm (F, M), 20μm (L), 15μm (Q). Data are shown as mean ± standard deviation. *** = p≤0.001. See also Figure S2, Movie S1, S2 and S3.
Figure 3
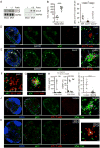
Figure 3. pDC accumulate at the SCS in an CXCR3-dependent manner
(A, B) IF images showing pDC localization 7–10hrs p.i. in (A) WT and (B) Cxcr3−/− mice; dashed line indicates SCS area. (C) Spatial frequency distribution of pDC comparing WT (SiglechGFP/GFP) and Cxcr3−/− (SiglechGFP/GFP) mice 10hrs p.i. (D) Image from IVM showing Cxcr3−/− (SiglechGFP/GFP) pDC 7hrs p.i. (E) Analysis of the mean velocity of pDC in WT (SiglechGFP/GFP) and Cxcr3−/− (SiglechGFP/GFP) mice. (F, G) Quantification of CXCL9 and CXCL10 from WT and Clec4c+/DTR animals treated with DTX using pLN homogenates from mock treated or infected conditions showing dot plots (F) and ELISA (G). Ratios indicate relative intensities adjusted to controls (HSP60). Mice were infected with MVA OVA tdTomato. Data are representative of (A–E) five independent experiments (n≥3), (F) one experiment from pooled samples (n=9) or (G) two independent experiments (n=3). Red bars indicate mean values. Scale bars: 150μm (A, B), 30μm (C). *** = p≤0.001. Please see also Figure S3 and Movie S4.
Figure 4
Figure 4. pDC are recruited to CD8+ T cell priming sites via CCR5
Dot blot detecting CCL3, CCL4 and CCL5 (A) and ELISA detecting CCL3 (B) using LN homogenates from mock treated and infected (8hrs) animals. Ratio indicates relative intensities normalized to controls (HSP60). (C) Quantification of pDC in proximity to OT-I T cell clusters in WT, Ccr5−/− and Cxcr3−/− animals (all mice SiglechGFP/GFP) 10hrs p.i. (D) IF image from Ccr5−/− (SiglechGFP/GFP) mice showing pDC and OT-I T cells 10hrs p.i. (E) IF image from Cxcr3−/− (SiglechGFP/GFP) mice showing pDC and OT-I T cells 10hrs p.i. (F, G) Image from IVM of pLN showing OT-I T cell cluster and pDC from Ccr5−/− (SiglechGFP/GFP) (F) and Cxcr3−/− (SiglechGFP/GFP) mice (G). (H) CCL3 ELISA from supernatants of activated (αCD3 and αCD28 – 8hrs) or non-activated, purified naïve (CD44low) CD4+ and CD8+ T cells. CD69 indicates extent of T cell activation within cultures. (I–K) IF images and quantification of OT-I T cells and pDC localization 8hrs p.i., comparing isotype- with αCCL3 and αCCL4 treated animals. Mice were infected with MVA OVA. Data are representative of (A) one experiment from pooled samples (n=9), or (C–G and H–K) at least three independent experiments (n=3) or (B, H) two independent experiments (n=3). Scale bars: D (150μm and 15μm), E (150μm and 20μm), F and G (20μm), J (150μm and 10μm), K (200μm and 10μm). Data are shown as mean ± standard deviation. Red bars indicate mean values. *** = p≤0.001, * = p≤0.05, ns = non-significant. Please see also Figure S4, Movie S5 and S6.
Figure 5
Figure 5. pDC function and target cells of IFN I
(A) IFNα ELISA from LN homogenates from DTX-treated WT and Clec4c+/DTR mice treated 8hrs p.i.. (B–M) Analysis of immune response on d8 p.i., comparing Ifnar−/− and Ifnar−/− x Clec4c+/DTR animals (B–E), CD4 Cre x Ifnarflox/flox with littermates (F–I), CD11c Cre x Ifnarflox/flox with littermates (J–M). (B, F, J) Representative FACS plots of IFNγ-producing CD8+ T cells. (C, G, K) Absolute numbers of IFN-γ-producing CD8+ T cells. (D, H, L) Representative FACS plots showing TNF-α and IL-2 production (gated on CD8+ and IFNγ+). (E, I, M) Quantitative analysis of TNF-α and IL-2 producing CD8+ T cells (gated on CD8+, IFN-γ+). Mice were infected with MVA OVA. Data are representative of (A) three (n=3) independent and (B–M) four (n=4) independent experiments analyzing at least 4 animals per group. (G, I) Show pooled data from four independent experiments (n=16). Data are shown as mean ± standard deviation. ** = p≤0.01, * = p≤0.05. Please see also Figure S5.
Figure 6
Figure 6. pDC optimize XCR1+ DC maturation and cross-presentation
(A) Phenotypic analysis of GFP positive splenic DC and their maturation comparing Ifnar1flox/flox (WT) and CD11c Cre x Ifnar1flox/flox mice 8hrs p.i. (MVA OVA GFP i.v.). (B, C) Representative histograms and quantitative analysis of splenic DC subsets comparing Ifnarflox/flox (WT) and CD11c Cre x Ifnar1flox/flox mice 36hrs p.i. (MVA OVA i.v.). (D, E) Representative histograms and quantitative analysis of splenic DC subsets comparing DTX-treated WT and Clec4c+/DTR animals (36hrs MVA OVA i.v.). (F, G) Proliferation profile and quantitative analysis of OT-I T cells in pLN 3d post transfer into infected (60hrs MVA OVA f.p.), DTX-treated WT, Clec4c+/DTR and Ccr5−/− animals (all groups SiglechGFP/GFP). Data are representative of at least three independent experiments (n≥3). Data are shown as mean ± standard deviation. *** = p≤0.001, ** = p≤0.01, * = p≤0.05, ns = non-significant. Please see also Figure S6.
Figure 7
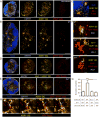
Figure 7. Activated CD8+ T cells recruit XCR1+ DC via XCL1
(A–E) IF images showing OT-I T cell and XCR1+ DC localization in (A) the steady state, or (B–E) 10hrs p.i. (MVA OVA) in (B, C) WT (XCR1+/venus) and (D) XCR1-deficient animals (XCR1venus/venus) or (E) using Xcl1/ OT-I T cells. (F) IF images showing OT-I T cell cluster and XCL1 staining 10hrs p.i. (G) Analysis of 3D spatial correlation between OT-I T cells and XCR1+ DC. (H) IVM images of XCR1+/venus mice showing directed XCR1+ DC migration towards an OT-I T cell cluster. Scale bars: 250μm (B), 150μm (D, E), 100μm (A), 20μm (C, H), 10μm (F). Data are representative of at least three independent experiments (n=3). Data are shown as mean ± standard deviation. *** = p≤0.001. Please see also Movie S7 and S8.

Comment in

References

    1. Ang DK, Oates CV, Schuelein R, Kelly M, Sansom FM, Bourges D, Boon L, Hertzog PJ, Hartland EL, van Driel IR. Cutting edge: pulmonary Legionella pneumophila is controlled by plasmacytoid dendritic cells but not type I IFN. J Immunol. 2010;184:5429–5433. - PubMed
    1. Asselin-Paturel C, Boonstra A, Dalod M, Durand I, Yessaad N, Dezutter-Dambuyant C, Vicari A, O’Garra A, Biron C, Briere F, et al. Mouse type I IFN-producing cells are immature APCs with plasmacytoid morphology. Nat Immunol. 2001;2:1144–1150. - PubMed
    1. Asselin-Paturel C, Brizard G, Chemin K, Boonstra A, O’Garra A, Vicari A, Trinchieri G. Type I interferon dependence of plasmacytoid dendritic cell activation and migration. J Exp Med. 2005;201:1157–1167. - PMC - PubMed
    1. Bachem A, Hartung E, Guttler S, Mora A, Zhou X, Hegemann A, Plantinga M, Mazzini E, Stoitzner P, Gurka S, et al. Expression of XCR1 Characterizes the Batf3-Dependent Lineage of Dendritic Cells Capable of Antigen Cross-Presentation. Front Immunol. 2012;3:214. - PMC - PubMed
    1. Barchet W, Krug A, Cella M, Newby C, Fischer JA, Dzionek A, Pekosz A, Colonna M. Dendritic cells respond to influenza virus through TLR7- and PKR-independent pathways. Eur J Immunol. 2005;35:236–242. - PubMed

Publication types