. 2017 Feb 20;27(4):569-575.
doi: 10.1016/j.cub.2016.12.057. Epub 2017 Feb 9.

The Macronuclear Genome of Stentor coeruleus Reveals Tiny Introns in a Giant Cell

Affiliations

The Macronuclear Genome of Stentor coeruleus Reveals Tiny Introns in a Giant Cell

Mark M Slabodnick et al. Curr Biol. .

Abstract

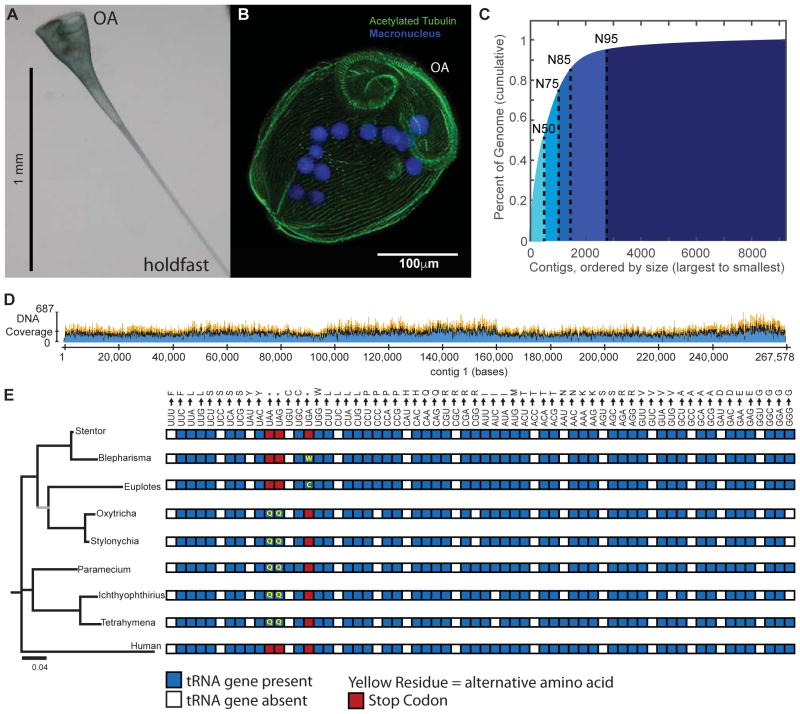
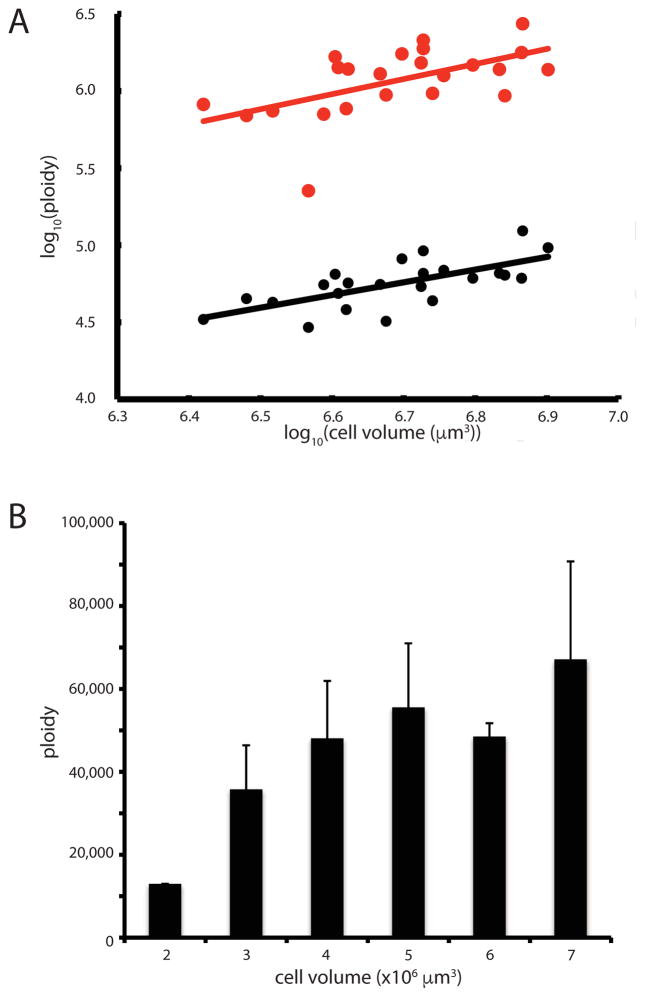
The giant, single-celled organism Stentor coeruleus has a long history as a model system for studying pattern formation and regeneration in single cells. Stentor [1, 2] is a heterotrichous ciliate distantly related to familiar ciliate models, such as Tetrahymena or Paramecium. The primary distinguishing feature of Stentor is its incredible size: a single cell is 1 mm long. Early developmental biologists, including T.H. Morgan [3], were attracted to the system because of its regenerative abilities-if large portions of a cell are surgically removed, the remnant reorganizes into a normal-looking but smaller cell with correct proportionality [2, 3]. These biologists were also drawn to Stentor because it exhibits a rich repertoire of behaviors, including light avoidance, mechanosensitive contraction, food selection, and even the ability to habituate to touch, a simple form of learning usually seen in higher organisms [4]. While early microsurgical approaches demonstrated a startling array of regenerative and morphogenetic processes in this single-celled organism, Stentor was never developed as a molecular model system. We report the sequencing of the Stentor coeruleus macronuclear genome and reveal key features of the genome. First, we find that Stentor uses the standard genetic code, suggesting that ciliate-specific genetic codes arose after Stentor branched from other ciliates. We also discover that ploidy correlates with Stentor's cell size. Finally, in the Stentor genome, we discover the smallest spliceosomal introns reported for any species. The sequenced genome opens the door to molecular analysis of single-cell regeneration in Stentor.

Keywords: U2 snRNA; cell size; ciliate; genetic code; heterotrichidae; intron evolution; macronucleus; ploidy; regeneration; splicing.


Figures

Figure 1
Figure 1. Shotgun sequencing the Stentor coeruleus macronuclear genome
(A) Brightfield image of a live Stentor cell in its extended, feeding form. The oral apparatus is at the top of the image and the hold fast is at the bottom, as indicated. (B) Fluorescence micrograph of a fixed and stained Stentor cell in its contracted form (cells contract upon fixation). The macronucleus is stained by DAPI. Cilia and the longitudinal bundles of microtubules which run in parallel along the whole length of the cell are marked by an antibody against acetylated tubulin. The cilia which comprise the oral apparatus are indicated by OA. (C) Cumulative distribution depicting the N50 (50kb) of the assembled Stentor genome. The largest percentage of the genome is accounted for by the longest contigs. (D) Sequencing coverage for the first contig in the assembly. (E) Phylogenetic comparison of 18S RNA (left) for ciliates using Homo sapiens as an outgroup. The tree was built using an HKY substitution model based on a ClustalW multiple sequence alignment. All bootstrap values are > 90 with the exception of that marked in gray which has a bootstrap value of 53. Right: A comparison of the genetic codes for ciliates and human. A blue box indicates the presence of a tRNA gene, while white indicates its absence. Red boxes indicate codons used as termination signals, while yellow residues indicate alternative amino acid encodings. Blepharisma and Stentor both belong to the ciliate class Heterotrichea; Euplotes, Oxytricha and Stylonychia represent class Spirotrichea; Paramecium, Tetrahymena and Ichthyophthirius represent class Oligohymenophorea. See also Figure S1 and Table S1.
Figure 2
Figure 2. Stentor gene duplications and orthology groups
(A) Genome duplication events in the genomes of Stentor coeruleus, Paramecium tetraurelia, and Tetrahymena thermophila. To generate coordinates on the perimeter of each circle, contigs/scaffolds were arranged from longest to shortest and then continuously numbered from 1 to the end of the assemblies. Red lines connect paralogous windows (see methods) between two scaffolds and indicate putative genome duplication events. (B) Venn diagram showing numbers of orthologous gene groups in Stentor that are also found in other ciliates, apicomplexans, or metazoans. Shaded regions indicate gene groups that are exclusive to those taxa; for example, the ciliate only region of the diagram represents gene groups that aren’t found in any other taxa. An additional 555 curated groups are shared with other organisms but not pictured in this diagram. See also Figure S2 and Table S2.
Figure 3
Figure 3. Intron sequences and splicing in Stentor
(A) Nearly all identified introns in Stentor are 15nts (94.5%, top) or 16nts (5.5%, bottom), displaying an abbreviated 5′ splice site motif, atypical internal TA dinucleotide (asterisk), and potential stop codons (brackets). Weblogos were generated and normalized to neutral base frequencies in intergenic regions. (B) Greater splicing efficiency of 15nt introns. Graph shows a histogram of the distribution of introns in each size class (15–17nts) showing a given level of splicing efficiency, defined as the number of spliced RNA-seq reads divided by the total number of spliced and unspliced reads for each intronic locus. (C) Avoidance of intron-like motifs in protein-coding regions. Occurrence within protein-coding regions of intron-like motifs is shown, revealing stronger underrepresentation of intron-like GTAN(5)TAN(3)AG motifs (red) compared to similar motifs (other combinations of GTAN(1–9)TAN(1–5)AG). x indicates the number of the bases (N=ATCG) preceding the T before the branchpoint and y indicates the number of bases following the branchpoint A (thus the intronic motif is x=5, y=3). (D) Avoidance of alternative 3′ splice sites. Downstream AG dinucleotides near the 3′ AG splice site are less common than expected, particularly for distances that do not induce a frameshift (multiples of three nucleotides, striped bars). The trendline is a linear fit to all data shown. See also Figure S3 and Tables S3 and S5.
Figure 4
Figure 4. Macronuclear ploidy scales with cell volume
(A) Scaling of two contigs with cell volume. Graph depicts the log10 of contig copy number versus the log10 of cell volume, based on droplet digital PCR of individual cells. (Red) copy number of rDNA-containing contig and (Black) a large contig that does not contain rDNA. Each point represents a single cell. Ploidy data used two different y axis scales because the average ploidy is approximately 20 times greater for the contig containing the rDNA locus. Lines represent best fit power law relation. (B) Average ploidy for five contigs spanning a size range of 42,000 – 230,000 bp, not including the rDNA contig. Error bars indicate standard deviation. See also Table S4.

Comment in

References

    1. Slabodnick MM, Marshall WF. Stentor coeruleus. Curr Biol. 2014;24:R783–4. - PMC - PubMed
    1. Tartar V. The biology of Stentor. New York: Pergammon Press; 1961.
    1. Morgan TH. Regeneration of proportionate structures in Stentor. The Biol Bull. 1901;2:311–328.
    1. Wood DC. Parametric studies of the response decrement produced by mechanical stimuli in the protozoan, Stentor coeruleus. J Neurobiol. 1969;1:345–60. - PubMed
    1. Li R, Zhu H, Ruan J, Qian W, Fang X, Shi Z, Li Y, Li S, Shan G, Kristiansen K, et al. De novo assembly of human genomes with massively parallel short read sequencing. Genome Res. 2010;20:265–72. - PMC - PubMed