. 2017 Mar 7;25(3):727-738.
doi: 10.1016/j.cmet.2017.01.005. Epub 2017 Feb 9.

β Cells that Resist Immunological Attack Develop during Progression of Autoimmune Diabetes in NOD Mice

Affiliations

β Cells that Resist Immunological Attack Develop during Progression of Autoimmune Diabetes in NOD Mice

Jinxiu Rui et al. Cell Metab. .

Abstract

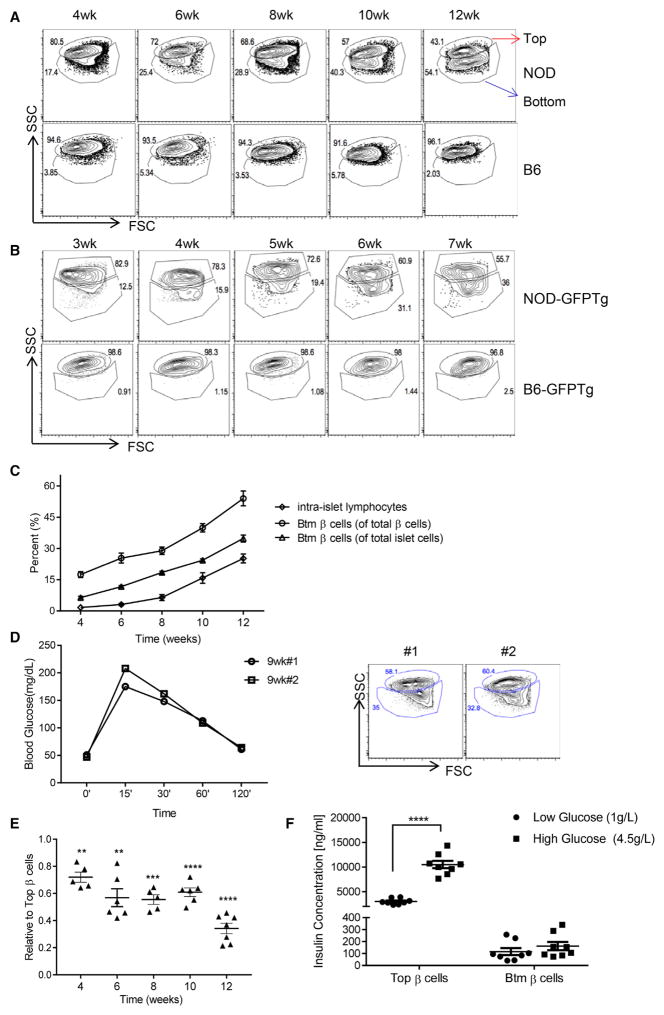
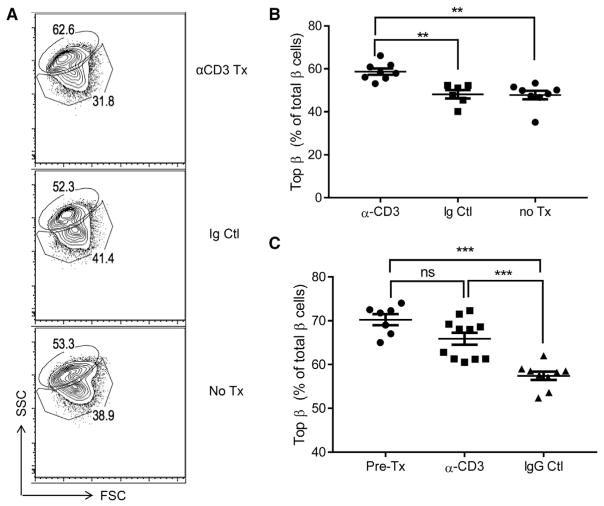
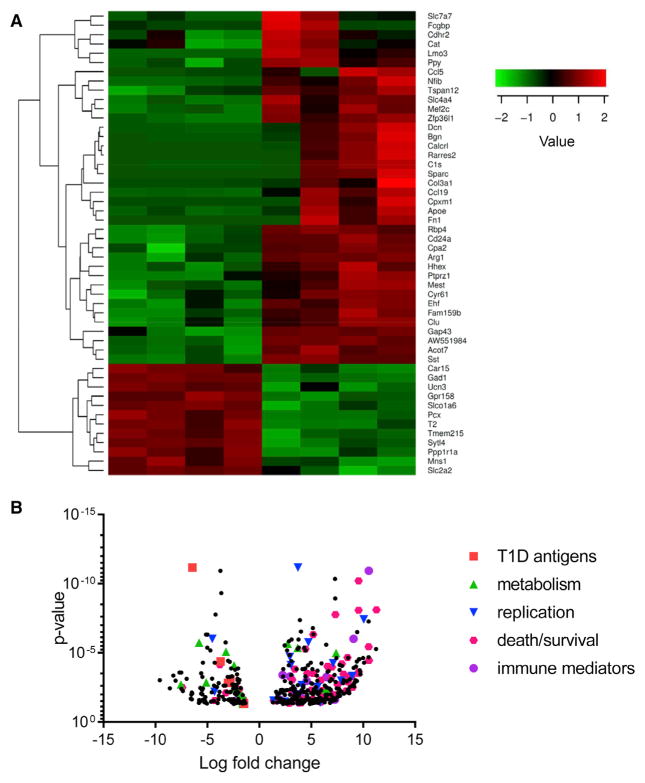
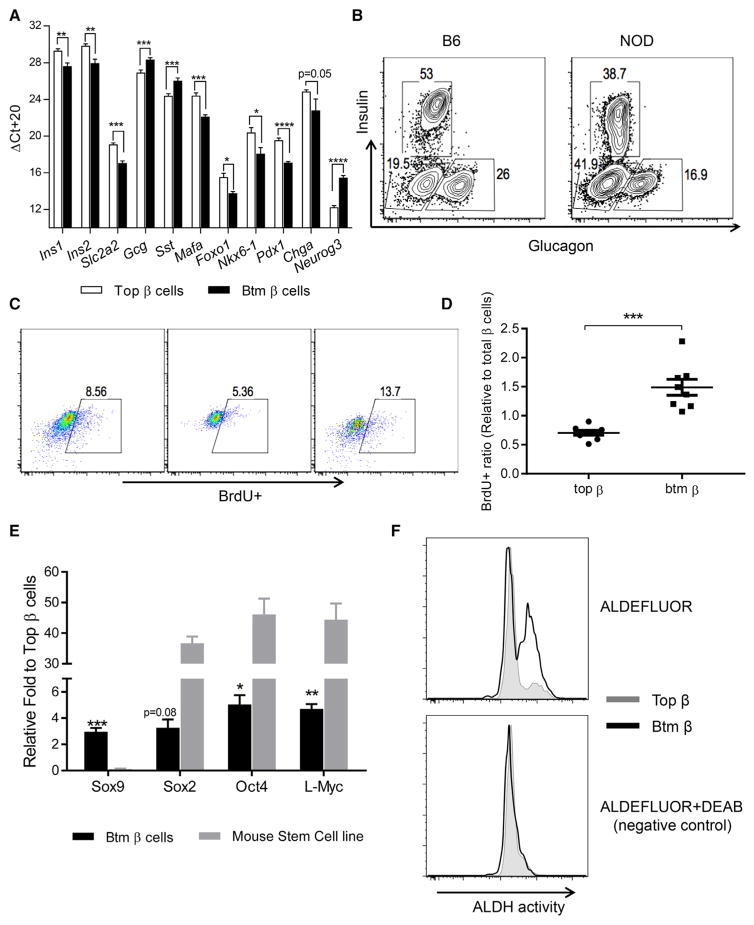
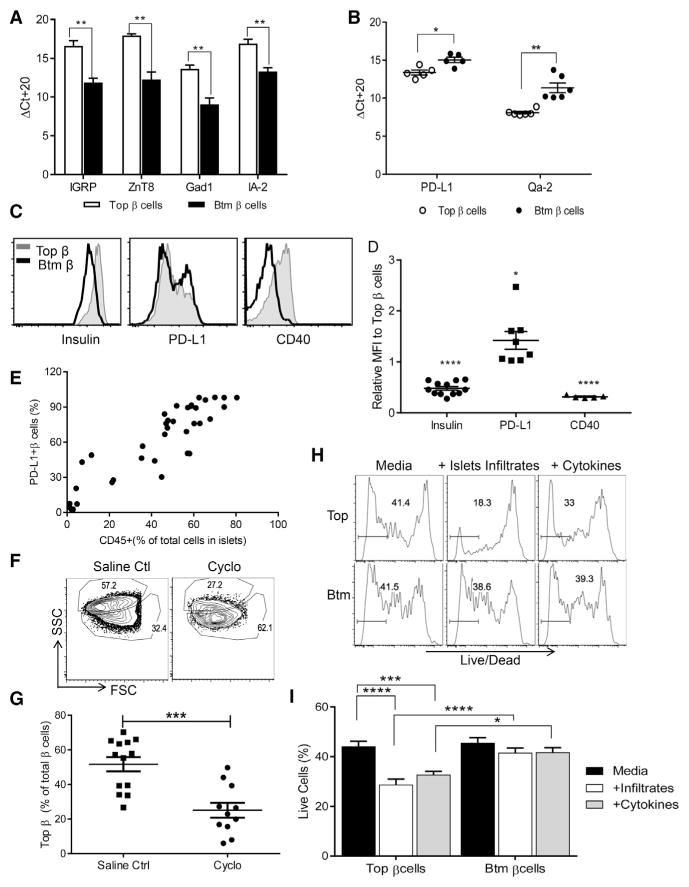
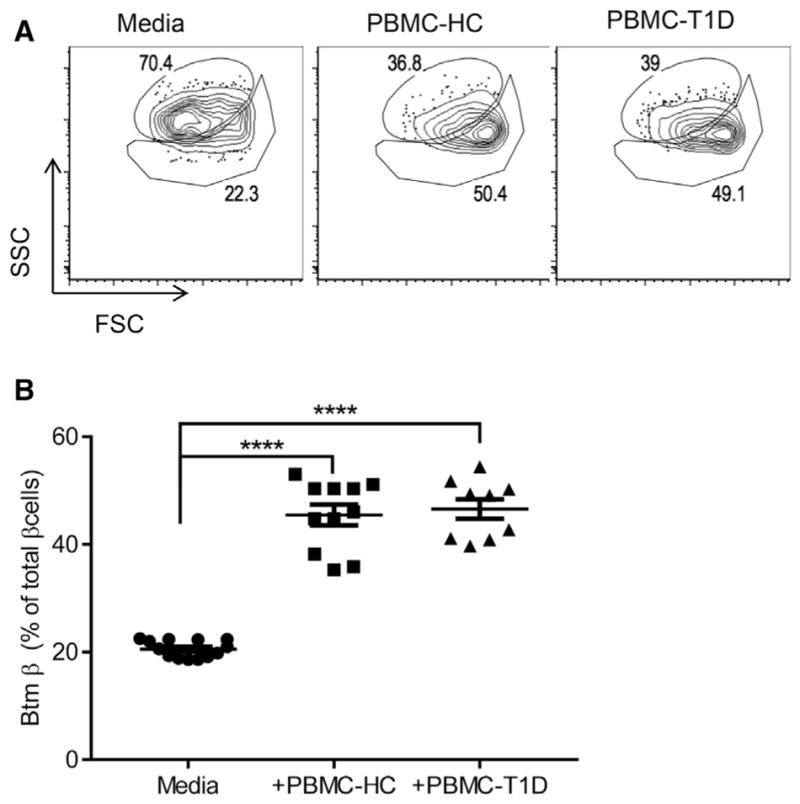
Type 1 diabetes (T1D) is a chronic autoimmune disease that involves immune-mediated destruction of β cells. How β cells respond to immune attack is unknown. We identified a population of β cells during the progression of T1D in non-obese diabetic (NOD) mice that survives immune attack. This population develops from normal β cells confronted with islet infiltrates. Pathways involving cell movement, growth and proliferation, immune responses, and cell death and survival are activated in these cells. There is reduced expression of β cell identity genes and diabetes antigens and increased immune inhibitory markers and stemness genes. This new subpopulation is resistant to killing when diabetes is precipitated with cyclophosphamide. Human β cells show similar changes when cultured with immune cells. These changes may account for the chronicity of the disease and the long-term survival of β cells in some patients.

Keywords: autoimmunity; immune regulation; stem cell; β cell.


Figures

Figure 1
Figure 1. Changes in β Cell Composition during Diabetes Progression in NOD Mice<
br>(A) Islets from non-obese diabetic (NOD) and B6 mice of different age were hand-picked, dispersed into single cells, and stained with FluoZin and tetramethylrhodamine ethyl ester perchlorate (TMRE) to identify viable β cells. Top and bottom (Btm) β cells were detected by differences in side scatter (SSC) and forward scatter (FSC) (numbers refer to the percentage of total Zn+TMRE+ cells). Shown are representative FACS profiles from one of three independent experiments, each with three to five mice at each time point. (B) FACS side/forward scatter (SSC/FSC) profiles of GFP+ β cells from either mouse insulin-promoter (MIP) NOD-GFP or age-matched B6-GFP transgenic mice. Numbers refer to the percentage of either Top or Btm β cells among all GFP+ cells. Data are from one individual experiment representative of three individual experiments with three or four mice for each time point. (C) The frequency of intra-islet lymphocytes and Btm β cells as a proportion of β cells or total islet endocrine cells increased over time. The lines show Btm β cells as a proportion of insulin-positive islet cells (○) (Pearson r2 = 0.9537, p = 0.0043) and as a proportion of total islet cells (Δ) (i.e., CD45, Pearson r2 = 0.984, p = 0.0009). The frequency of islets infiltrates (i.e., CD45+) increased over time (⋄) (Pearson r2 = 0.9083, p = 0.0121). Data represent mean ± SEM (n = 6 mice each time point). There was a close relationship between the frequency of intra-islet lymphocytes and bottom (Btm) cells (Pearson r2 = 0.987, p = 0.002). (D) The results of IPGTT and FACS profiles of β cells from two 9-week-old NOD mice are shown. (E) The ratio of the mean fluorescence intensity (MFI) of FACS-sorted Top and Btm β cell islets of NOD mice of different ages, stained with anti-insulin-APC (Allophycocyanin) antibody, is shown. Column statistics refer to a one-sample t test compared to a mean of 1. Data represent mean ± SEM from individual mice (**p < 0.01, ***p < 0.001, and ****p < 0.0001). (F) Top and Btm β cells were sorted from islets from six mice, and insulin was measured in cultures with 1 g/L or 4.5 g/L glucose for 8 hr. Top cells made more insulin (p < 0.0001) than Btm cells and responded to high glucose. Data represent individual wells (50,000 cells in each well) from pools of three to four mice (p < 0.0001, two-way ANOVA, multiple comparisons).
Figure 2
Figure 2. Immune Therapy with Anti-CD3 mAb Arrests Changes in β Cells
F(ab′)2 fragments of anti-CD3 mAb 145-2C11 or control Ig were given to 9-week-old NOD mice (n = 6–9 mice each experiment). The mice were sacrificed after 9 days, and β cell subpopulations were analyzed by flow cytometry. (A) Representative data showing SSC/FCS of β cells are shown from a single experiment representative of three independent experiments. The numbers indicate the percentage of Top and Btm β cells. (B) The percentage of Top β cells was compared between anti-CD3 Tx mice and those in the immunoglobulin control and untreated groups (Kruskal-Wallis test, **p < 0.01). (C) Human immunoglobulin (hIg) or anti-CD3 mAb was given to 7-week-old NOD mice, and these mice were followed for 3 weeks after treatment (Kruskal-Wallis, pre-treatment [Pre-Tx] or hIg versus anti-CD3, ***p < 0.001). Ig, immunoglobulin; IgG, immunoglobulin G; Tx, treatment. Data from individual mice are shown. Bars are mean ± SEM.
Figure 3
Figure 3. RNA-Seq Analysis of the Subpopulations of β Cells from NOD Mice
Top and Btm β cells, sorted from 8- to 10-week-old NOD mice, were used for RNA-seq. (A) Heatmap generated from 50 genes with the smallest false discovery rate (FDR) is shown. (B) Volcano plot of the 457 differentially affected genes categorized by pathway (n = 4 separate sortings with islet cells from five or six mice in each). Column headings refer to individual sortings.
Figure 4
Figure 4. Transcription Profiles of the Two β Cell Subpopulations by Real-Time qPCR
(A) Top and Btm β cells were sorted from 8- to 10-week-old NOD mice. RNA was recovered, and the transcription levels of the β cell genes shown were measured by real-time qPCR. The Ct values were normalized to Actb mRNA levels (ΔCt = Ct of Actb-Ct of target gene + 20). Data represent mean ± SEM of three experiments, each with pools of four to six mice. Student’s t tests were performed with an FDR of 5% (*p < 0.05, **p < 0.01, ***p < 0.001, ****p < 0.0001). (B) FACS analysis of insulin and glucagon expression in islet cells pooled from 10-week-old NOD and B6 mice (numbers refer to the percent of the cells gated on CD45 cells). Data are from a single experiment representative of three experiments. (C) Eight-week-old NOD mice were given bromodeoxyuridine (BrdU) in drinking water for 9 days, followed by normal water for another week before sacrifice. The incorporation of BrdU was studied in unsorted or sorted Top and Btm β cells. The number refers to the percentage of BrdU+ cells of total β cells. Data are from pooled cells from two or three mice per experiment and are representative of three independent experiments. (D) Data points represent pools of two or three mice from three experiments. Values represent mean ± SEM (***p = 0.0002, Mann-Whitney test). (E) The transcription levels of Sox9 and the stem cell factors Sox2, Oct4, and L-Myc were studied by real-time qPCR in Top and Btm β cells from 8- to 10-week-old NOD mice. RNA input was normalized to Actb. Data represent mean ± SEM of three experiments, with β cells sorted from four to six mice. Btm and Top cells from the same isolation were compared using a single-sample t test to a mean of 1 (n = 4; *p < 0.05, **p < 0.01, and ***p < 0.001). Comparisons were also made between the stem cell line SCRC-1002 and Top β cells (p < 0.0001, two-way ANOVA). (F) Top and Btm β cells were sorted from 8- to 10-week-old NOD mice, and ALDH activity was measured by FACS and compared between Top and Btm β cells. One paired sample from three independent experiments is shown (n = 6–8 mice per experiment). ALDH, aldehyde dehydrogenase. DEAB is an inhibitor of ALDH.
Figure 5
Figure 5. Immune Features of Btm β Cells
(A and B) Top and Btm β cells were sorted from 8- to 10-week-old NOD mice, and the transcription level of the autoantigens IGRP, ZnT8, GAD1, and IA-2 (A) and the immunomodulatory ligands PD-L1 and Qa-2 (B) were measured by RT-PCR. Ct values were normalized to Actb (ΔCt = Ct of Actb-Ct of target gene + 20). Data points are from pooled samples analyzed from four to six mice analyzed in four independent experiments. Values represent mean ± SEM (Student’s t test in A with an FDR of 5%; *p < 0.05 and **p < 0.01). (C and D) Top and Btm β cells from NOD mice at Q1 8–10 weeks of age were sorted and stained for insulin, PD-L1, and CD40 and analyzed by FACS. Histogram overlay of each protein in Btm versus Top β cells is shown. A representative result from a single experiment of two and four experiments is shown. The MFIs of insulin, PD-L1, and CD40 in Btm versus Top β cells in each paired sample are shown. The ratios were compared in a one-sample t test to a value of 1 (*p < 0.05 and ****p < 0.0001). Each point represents data from four, three, and two independent experiments, each with a pool of three to six mice. (E) The correlation between PD-L1-expression on total β cells and the CD45+ islets infiltrates. Data points represent individual mice from six experiments (total n = 38; Pearson r2 = 0.822, p < 0.0001). (F–I) Increased killing of the Top subpopulation of β cells: 9-week-old NOD mice were given a single dose of cyclophosphamide (250 mg/kg, i.p.). (F) Twelve days after treatment, β cell composition was compared with saline controls by flow cytometry. Representative plots are from one of three experiments. The numbers indicate the percentage of cells in each gate after gating on TMRE+CD45 cells. (G) The frequency of Top β cells is shown (mean ± SEM). Data from individual mice from four separate experiments are shown (Mann Whitney test, ***p < 0.0008). (H) Histogram of FACS Live/Dead staining of Top and Btm β cells that were sorted and cultured with CD45+ islet-infiltrating cells at a 1:5 ratio or with IL-1β, IFN-γ, and IL-6 for 24 hr. The numbers show the percentage live cells from a single experiment representative of five experiments. (I) Percentage of live cells after 24 hr in culture (n = 5–8 per group, two-way ANOVA, multiple comparison; *p < 0.05, ***p < 0.001, and ****p < 0.0001).
Figure 6
Figure 6. Changes in Human β Cells in Culture with Allogeneic Lymphoid Cells from Patients with T1D
PBMCs from patients with T1D or healthy control subjects (HC) were cultured with human islets for 4 days. Single β cell composition was analyzed by FACS after staining with FluoZin and TMRE. Representative data showing SSC/FSC from one of four experiments are shown. The numbers indicate the percentage of Top and Btm β cells (A). (B) The percentage of Btm β cells from each well from four independent experiments was calculated and compared. Each data point represents a pool of islet cells from four separate experiments (mean ± SEM; ****p = 0.0001, Dunnett’s multiple comparison test).

Comment in

  • Autoimmunity: Death-defying β cells.
    Holmes D. Holmes D. Nat Rev Endocrinol. 2017 Apr;13(4):189. doi: 10.1038/nrendo.2017.23. Epub 2017 Feb 24. Nat Rev Endocrinol. 2017. PMID: 28232664 No abstract available.

References

    1. Akirav E, Kushner JA, Herold KC. Beta-cell mass and type 1 diabetes: going, going, gone? Diabetes. 2008;57:2883–2888. - PMC - PubMed
    1. Akirav EM, Baquero MT, Opare-Addo LW, Akirav M, Galvan E, Kushner JA, Rimm DL, Herold KC. Glucose and inflammation control islet vascular density and beta-cell function in NOD mice: control of islet vasculature and vascular endothelial growth factor by glucose. Diabetes. 2011;60:876–883. - PMC - PubMed
    1. Atkinson MA, Bluestone JA, Eisenbarth GS, Hebrok M, Herold KC, Accili D, Pietropaolo M, Arvan PR, Von Herrath M, Markel DS, Rhodes CJ. How does type 1 diabetes develop?: the notion of homicide or β-cell suicide revisited. Diabetes. 2011;60:1370–1379. - PMC - PubMed
    1. Bader E, Migliorini A, Gegg M, Moruzzi N, Gerdes J, Roscioni SS, Bakhti M, Brandl E, Irmler M, Beckers J, et al. Identification of proliferative and mature β-cells in the islets of Langerhans. Nature. 2016;535:430–434. - PubMed
    1. Benjamini Y, Hochberg Y. Controlling the false discovery rate: a practical and powerful approach to multiple testing. J R Stat Soc Series B Stat Methodol. 1995;57:289–300.

Publication types

MeSH terms