

The translation of lipid profiles to nutritional biomarkers in the study of infant metabolism
- PMID: 28190990
- PMCID: PMC5272886
- DOI: 10.1007/s11306-017-1166-2
The translation of lipid profiles to nutritional biomarkers in the study of infant metabolism
Abstract
Introduction: Links between early life exposures and later health outcomes may, in part, be due to nutritional programming in infancy. This hypothesis is supported by observed long-term benefits associated with breastfeeding, such as better cognitive development in childhood, and lower risks of obesity and high blood pressure in later life. However, the possible underlying mechanisms are expected to be complex and may be difficult to disentangle due to the lack of understanding of the metabolic processes that differentiate breastfed infants compared to those receiving just formula feed.
Objective: Our aim was to investigate the relationships between infant feeding and the lipid profiles and to validate specific lipids in separate datasets so that a small set of lipids can be used as nutritional biomarkers.
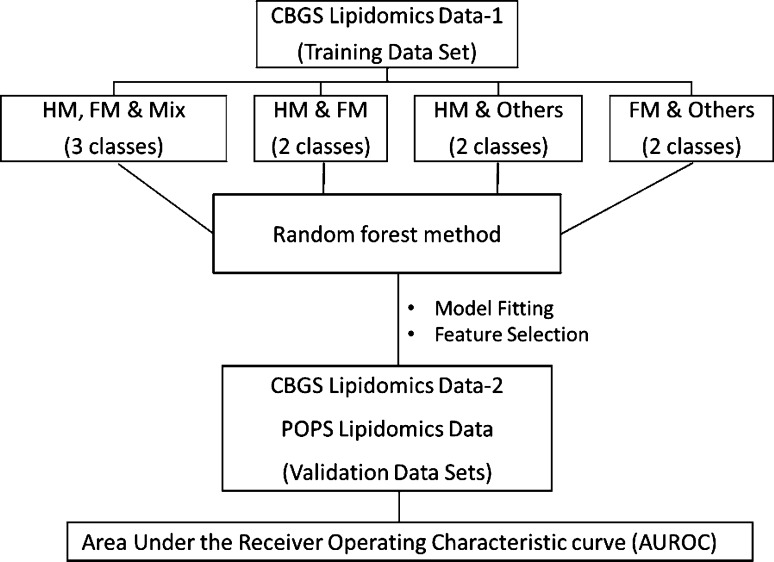
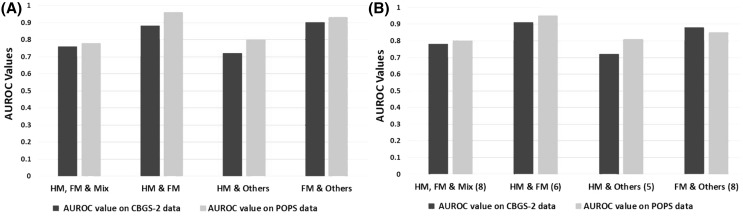
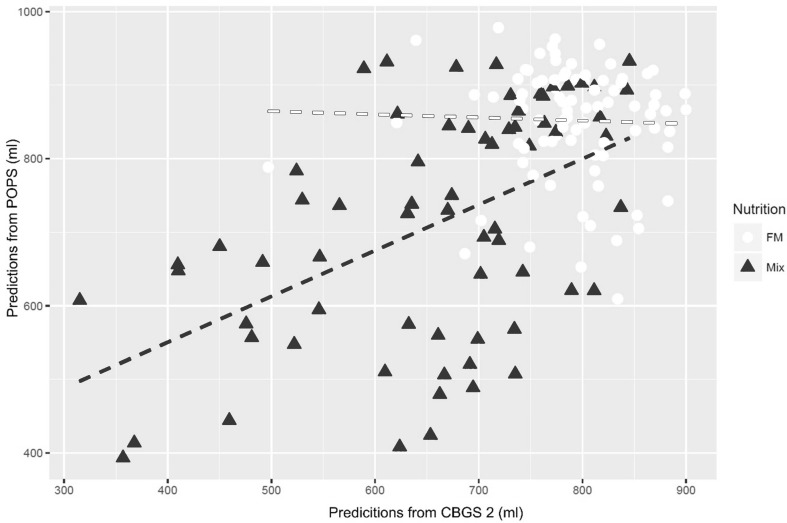
Method: We utilized a direct infusion high-resolution mass spectrometry method to analyse the lipid profiles of 3.2 mm dried blood spot samples collected at age 3 months from the Cambridge Baby Growth Study (CBGS-1), which formed the discovery cohort. For validation two sample sets were profiled: Cambridge Baby Growth Study (CBGS-2) and Pregnancy Outcome Prediction Study (POPS). Lipidomic profiles were compared between infant groups who were either exclusively breastfed, exclusively formula-fed or mixed-fed at various levels. Data analysis included supervised Random Forest method with combined classification and regression mode. Selection of lipids was based on an iterative backward elimination procedure without compromising the class error in the classification mode.
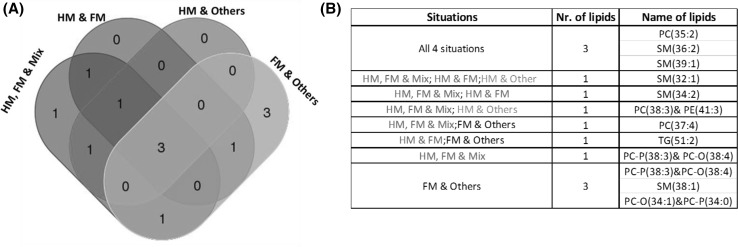
Conclusion: From this study, we were able to identify and validate three lipids: PC(35:2), SM(36:2) and SM(39:1) that can be used collectively as biomarkers for infant nutrition during early development. These biomarkers can be used to determine whether young infants (3-6 months) are breast-fed or receive formula milk.
Keywords: Biomarker discovery; Infant nutrition; Lipidomics; Random Forest.
Conflict of interest statement
The authors declare that they have no competing interests. Ethical approval All procedures performed in studies involving human participants were in accordance with the ethical standards of the institutional and/or national research committee and with the 1964 Helsinki declaration and its later amendments or comparable ethical standards.
Figures
References
-
- Breiman L. Random Forests. Machine Learning. 2001;45(1):5–32. doi: 10.1023/A:1010933404324. - DOI
-
- Chace DH, Millington DS, Terada N, Kahler SG, Roe CR, Hofman LF. Rapid diagnosis of phenylketonuria by quantitative analysis for phenylalanine and tyrosine in neonatal blood spots by tandem mass spectrometry. Clinical Chemistry. 1993;39(1):66–71. - PubMed
Grants and funding
LinkOut - more resources
Full Text Sources
Other Literature Sources
Molecular Biology Databases