

Comparison of Functional Connectivity Estimated from Concatenated Task-State Data from Block-Design Paradigm with That of Continuous Task
- PMID: 28191030
- PMCID: PMC5278200
- DOI: 10.1155/2017/4198430
Comparison of Functional Connectivity Estimated from Concatenated Task-State Data from Block-Design Paradigm with That of Continuous Task
Abstract
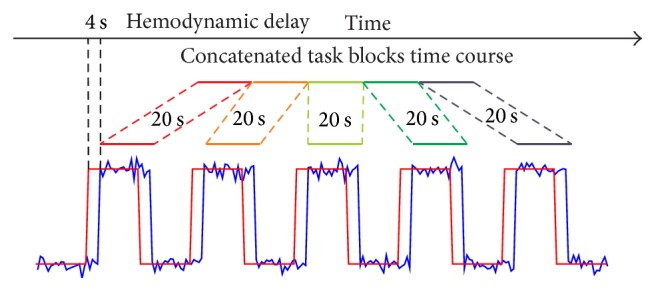
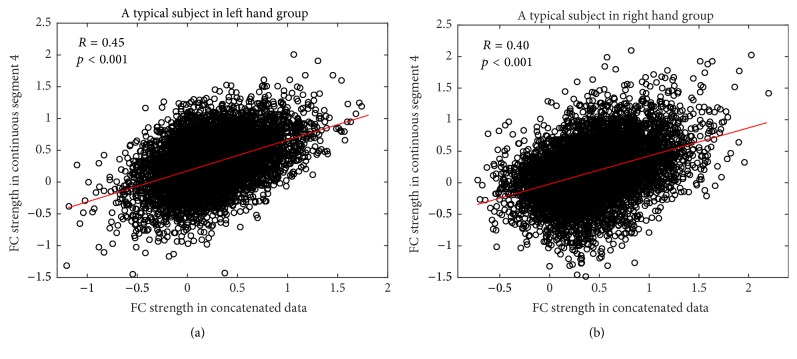
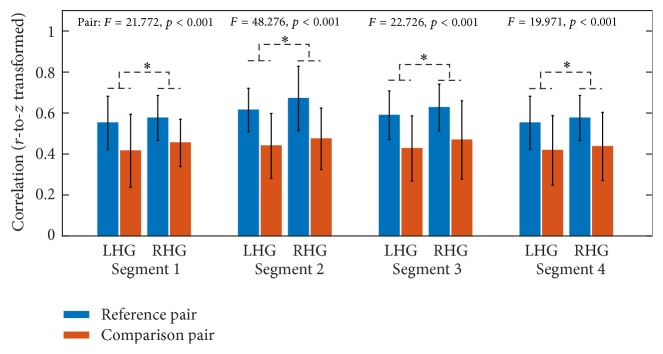
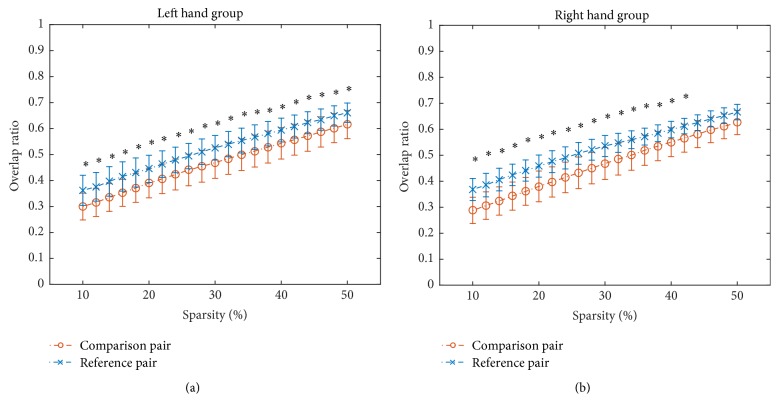
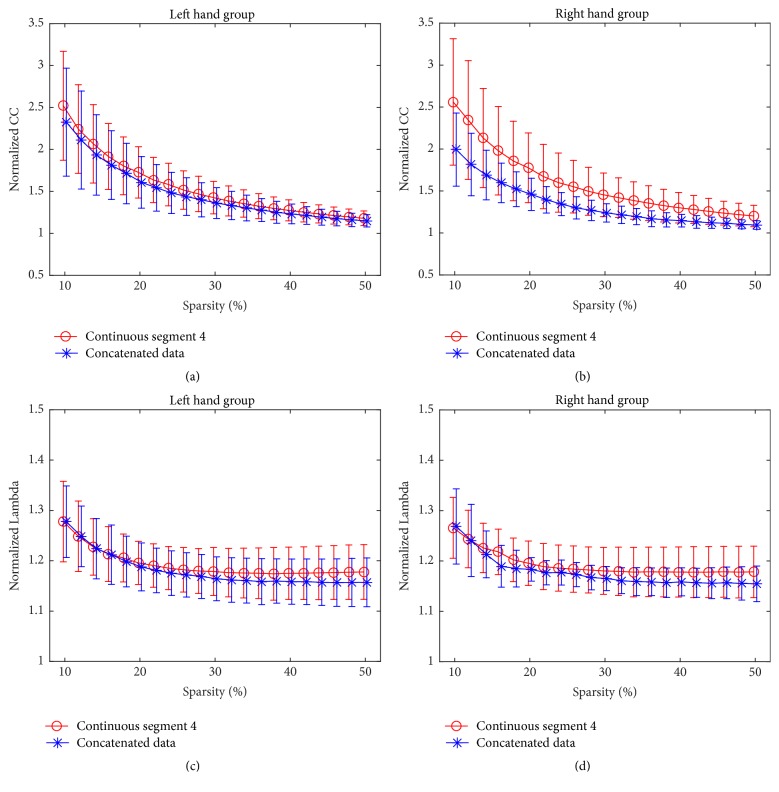
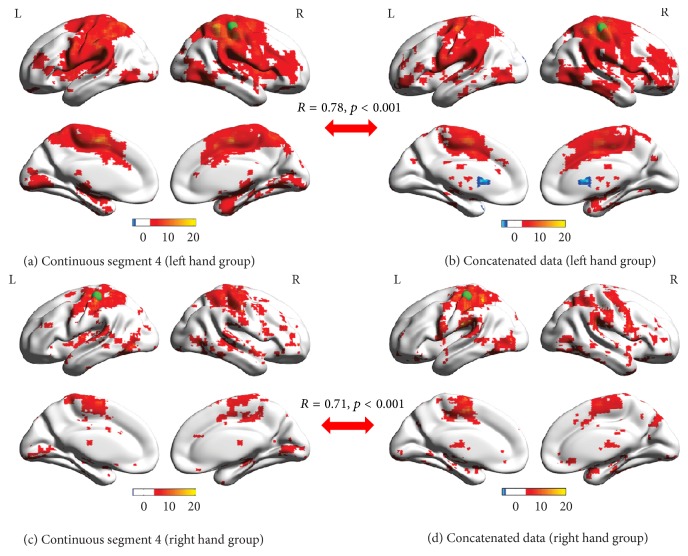
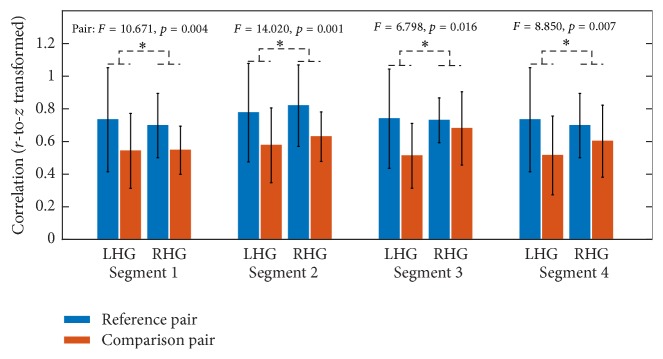
Functional connectivity (FC) analysis with data collected as continuous tasks and activation analysis using data from block-design paradigms are two main methods to investigate the task-induced brain activation. If the concatenated data of task blocks extracted from the block-design paradigm could provide equivalent FC information to that derived from continuous task data, it would shorten the data collection time and simplify experimental procedures, and the already collected data of block-design paradigms could be reanalyzed from the perspective of FC. Despite being used in many studies, such a hypothesis of equivalence has not yet been tested from multiple perspectives. In this study, we collected fMRI blood-oxygen-level-dependent signals from 24 healthy subjects during a continuous task session as well as in block-design task sessions. We compared concatenated task blocks and continuous task data in terms of region of interest- (ROI-) based FC, seed-based FC, and brain network topology during a short motor task. According to our results, the concatenated data was not significantly different from the continuous data in multiple aspects, indicating the potential of using concatenated data to estimate task-state FC in short motor tasks. However, even under appropriate experimental conditions, the interpretation of FC results based on concatenated data should be cautious and take the influence due to inherent information loss during concatenation into account.
Conflict of interest statement
The authors declare that they have no competing interests.
Figures
References
-
- Belliveau J., Kennedy D. N., Jr., McKinstry R. C., et al. Functional mapping of the human visual cortex by magnetic resonance imaging. Science. 1991;254(5032):716–719. - PubMed
-
- Ogawa S., Tank D. W., Menon R., et al. Intrinsic signal changes accompanying sensory stimulation: functional brain mapping with magnetic resonance imaging. Proceedings of the National Academy of Sciences of the United States of America. 1992;89(13):5951–5955. doi: 10.1073/pnas.89.13.5951. - DOI - PMC - PubMed
-
- Biswal B. B., Van Kylen J., Hyde J. S. Simultaneous assessment of flow and BOLD signals in resting-state functional connectivity maps. NMR in Biomedicine. 1997;10(4-5):165–170. - PubMed
Publication types
MeSH terms
Substances
LinkOut - more resources
Full Text Sources
Other Literature Sources
