

The phosphoinositide-3 kinase signaling is involved in neuroinflammation in hypertensive rats
- PMID: 28191736
- PMCID: PMC6492662
- DOI: 10.1111/cns.12679
The phosphoinositide-3 kinase signaling is involved in neuroinflammation in hypertensive rats
Abstract
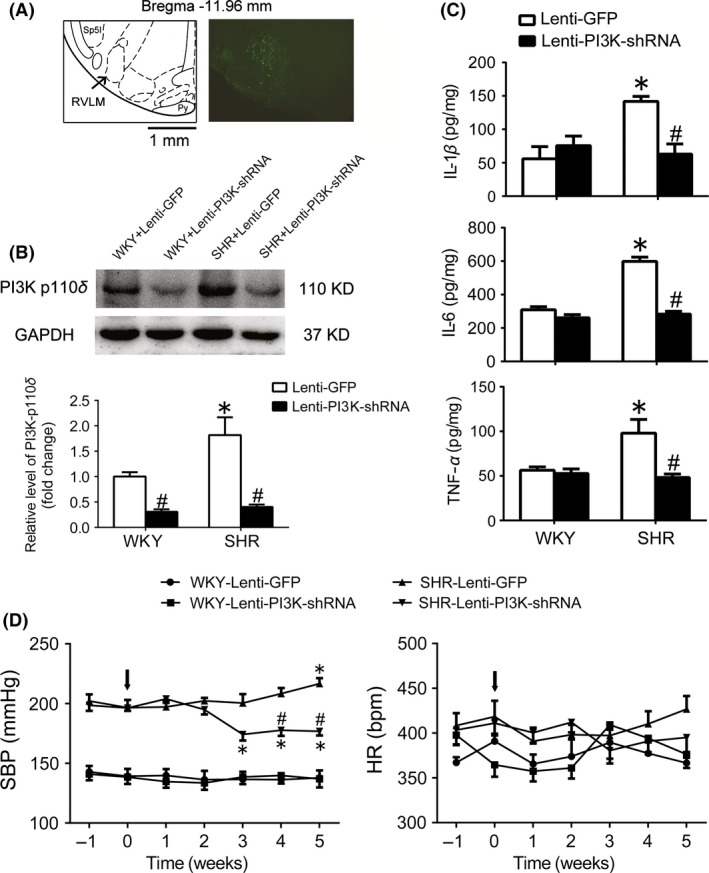
Aims: It has been demonstrated that neuroinflammation is associated with cardiovascular dysfunction. The phosphoinositide-3 kinase (PI3K) signaling in the rostral ventrolateral medulla (RVLM), a key region for sympathetic outflow, is upregulated and contributes to increased blood pressure (BP) and sympathetic outflow in hypertension. This study was designed to determine the role of the PI3K signaling in neuroinflammation in the RVLM of hypertension.
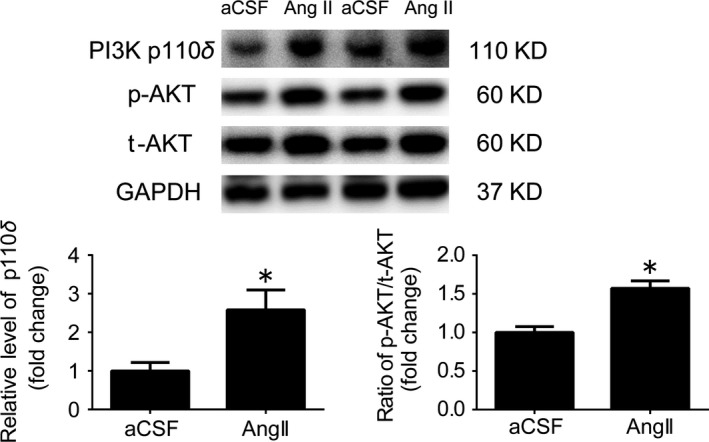
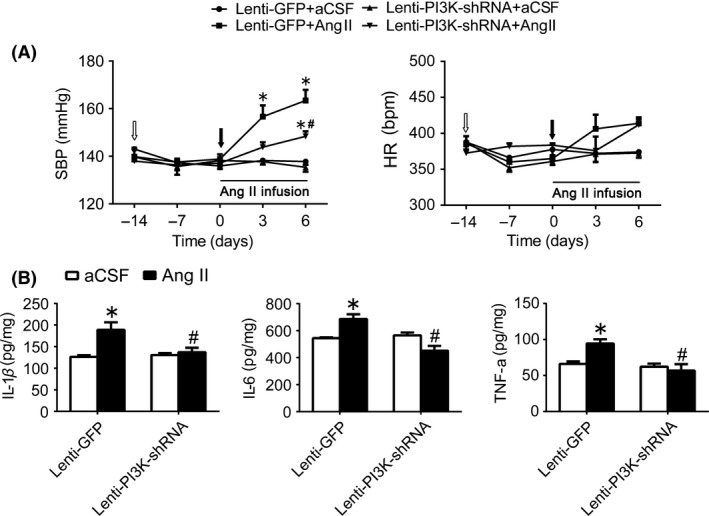
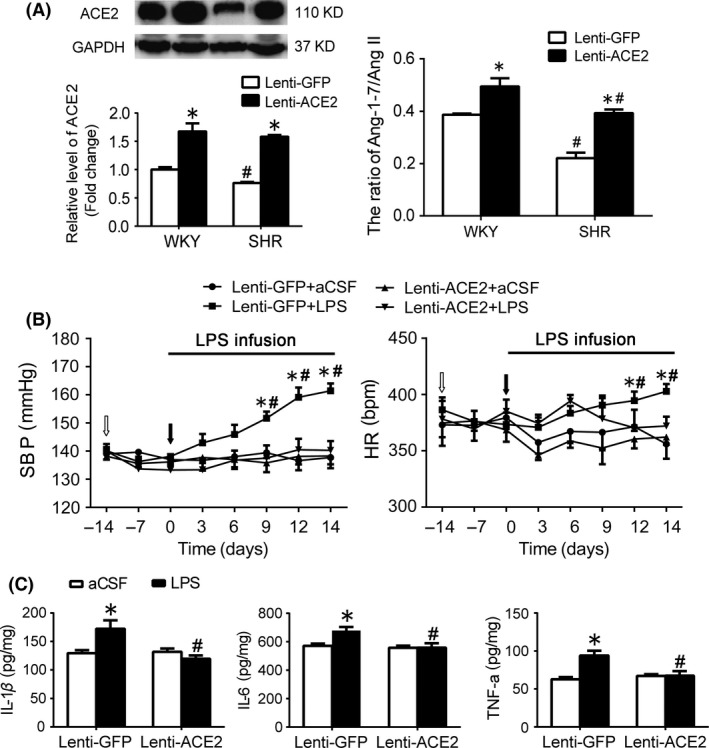
Methods: The normotensive WKY rats were performed by intracisternal infusion of lipopolysaccharide (LPS) or angiotensin II (Ang II) for inducing neuroinflammation. Elisa was used to determine the level of proinflammatory cytokines. Western blot was employed to detect the protein expression of PI3K signaling pathway. Gene silencing of PI3K p110δ subunit and overexpression of angiotensin-converting enzyme 2 (ACE2) were realized by injecting related lentivirus into the RVLM.
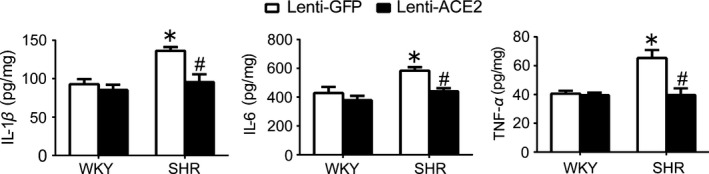
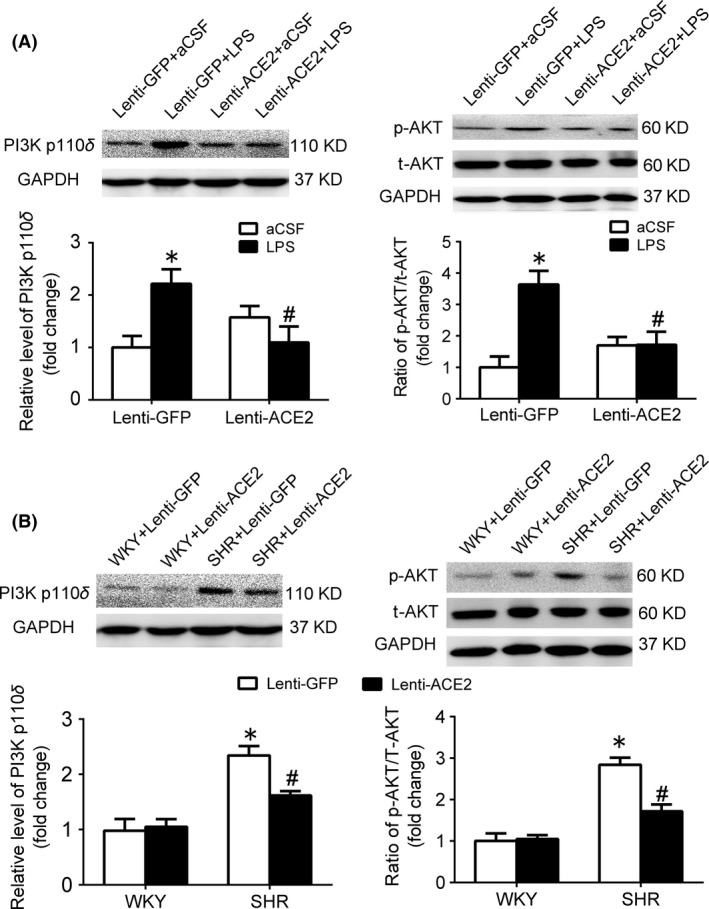
Results: In the spontaneously hypertensive rats (SHR), the PI3K signaling in the RVLM was upregulated compared with WKY, gene silencing of PI3K in the RVLM significantly reduced BP and renal sympathetic nerve activity (RSNA), but also decreased the levels of proinflammatory cytokines. In the WKY rats, central infusion of LPS and Ang II significantly elevated BP and RSNA, but also increased the levels of proinflammatory cytokines and PI3K signaling activation in the RVLM. These changes in the Ang II-induced hypertension were effectively prevented by gene silencing of PI3K in the RVLM. Furthermore, overexpression of ACE2 in the RVLM significantly attenuated high BP and neuroinflammation, as well as decreased the activation of PI3K signaling in hypertensive rats.
Conclusion: This study suggests that the PI3K signaling in the RVLM is involved in neuroinflammation in hypertension and plays an important role in the renin-angiotensin system-mediated changes in neuroinflammation in the RVLM.
Keywords: RVLM; ACE2; Hypertension; PI3K signaling; neuroinflammation.
© 2017 John Wiley & Sons Ltd.
Conflict of interest statement
The authors declare no conflict of interest.
Figures
Similar articles
-
Cannabinoid type 2 receptor agonist JWH133 decreases blood pressure of spontaneously hypertensive rats through relieving inflammation in the rostral ventrolateral medulla of the brain.J Hypertens. 2020 May;38(5):886-895. doi: 10.1097/HJH.0000000000002342. J Hypertens. 2020. PMID: 32238784
-
Overexpression of angiotensin-converting enzyme 2 in the rostral ventrolateral medulla causes long-term decrease in blood pressure in the spontaneously hypertensive rats.Hypertension. 2007 Apr;49(4):926-31. doi: 10.1161/01.HYP.0000259942.38108.20. Epub 2007 Feb 26. Hypertension. 2007. PMID: 17325232
-
Acupuncture modulation of the ACE/Ang II/AT1R and ACE2/Ang(1-7)/MasR pathways in the rostral ventrolateral medulla reduces sympathetic output and prevents cardiac injury caused by SHR hypertension.Neuroreport. 2024 Sep 4;35(13):839-845. doi: 10.1097/WNR.0000000000002073. Epub 2024 Jun 29. Neuroreport. 2024. PMID: 38973500
-
Brain renin-angiotensin system dysfunction in hypertension: recent advances and perspectives.Br J Pharmacol. 2003 May;139(2):191-202. doi: 10.1038/sj.bjp.0705262. Br J Pharmacol. 2003. PMID: 12770924 Free PMC article. Review.
-
Cardiovascular effects of angiotensin II in the rostral ventrolateral medulla: the push-pull hypothesis.Curr Hypertens Rep. 2007 Jun;9(3):222-7. doi: 10.1007/s11906-007-0040-4. Curr Hypertens Rep. 2007. PMID: 17519129 Review.
Cited by
-
Influence of hypertension classification on hypertensive intracerebral hemorrhage location.J Clin Hypertens (Greenwich). 2021 Nov;23(11):1992-1999. doi: 10.1111/jch.14367. Epub 2021 Oct 5. J Clin Hypertens (Greenwich). 2021. PMID: 34608743 Free PMC article.
-
Activation of Cannabinoid Type 2 Receptor in Microglia Reduces Neuroinflammation through Inhibiting Aerobic Glycolysis to Relieve Hypertension.Biomolecules. 2024 Mar 11;14(3):333. doi: 10.3390/biom14030333. Biomolecules. 2024. PMID: 38540753 Free PMC article.
-
Advances in the study of exosomes in cardiovascular diseases.J Adv Res. 2024 Dec;66:133-153. doi: 10.1016/j.jare.2023.12.014. Epub 2023 Dec 18. J Adv Res. 2024. PMID: 38123019 Free PMC article.
-
β-Arrestin1 Reduces Oxidative Stress via Nrf2 Activation in the Rostral Ventrolateral Medulla in Hypertension.Front Neurosci. 2021 Apr 7;15:657825. doi: 10.3389/fnins.2021.657825. eCollection 2021. Front Neurosci. 2021. PMID: 33897365 Free PMC article.
-
The Release of Nitric Oxide Is Involved in the β-Arrestin1-Induced Antihypertensive Effect in the Rostral Ventrolateral Medulla.Front Physiol. 2021 Jun 18;12:694135. doi: 10.3389/fphys.2021.694135. eCollection 2021. Front Physiol. 2021. PMID: 34220554 Free PMC article.
References
-
- Coffman TM. Under pressure: the search for the essential mechanisms of hypertension. Nat Med. 2011;17:1402–1409. - PubMed
-
- Salles GF, Fiszman R, Cardoso CR, Muxfeldt ES. Relation of left ventricular hypertrophy with systemic inflammation and endothelial damage in resistant hypertension. Hypertension. 2007;50:723–728. - PubMed
-
- El‐Bassossy HM, Shaltout HA. Allopurinol alleviates hypertension and proteinuria in high fructose, high salt and high fat induced model of metabolic syndrome. Transl Res. 2015;165:621–630. - PubMed
MeSH terms
Substances
LinkOut - more resources
Full Text Sources
Other Literature Sources
Medical
Miscellaneous
