

Noninvasive Assessment of an Engineered Bioactive Graft in Myocardial Infarction: Impact on Cardiac Function and Scar Healing
- PMID: 28191775
- PMCID: PMC5442807
- DOI: 10.5966/sctm.2016-0063
Noninvasive Assessment of an Engineered Bioactive Graft in Myocardial Infarction: Impact on Cardiac Function and Scar Healing
Abstract
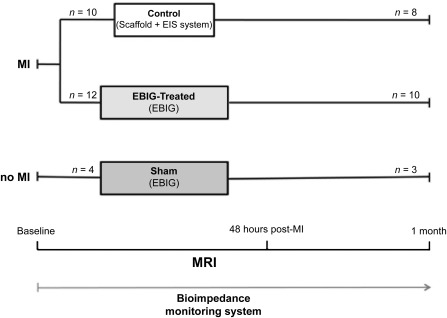
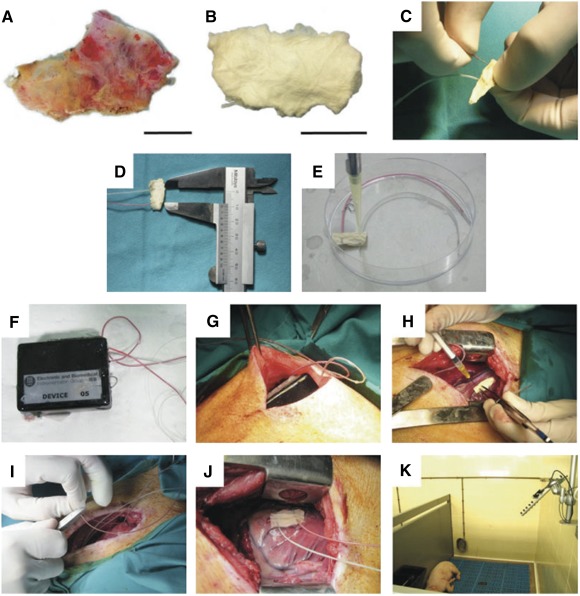
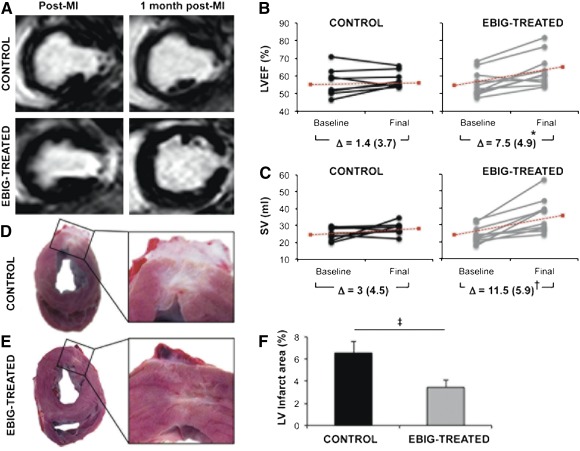
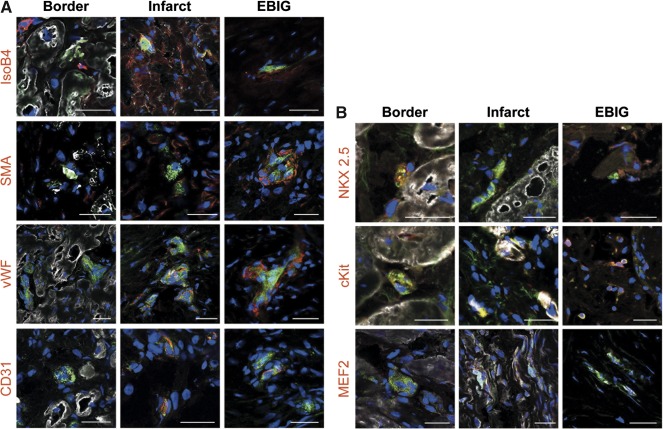
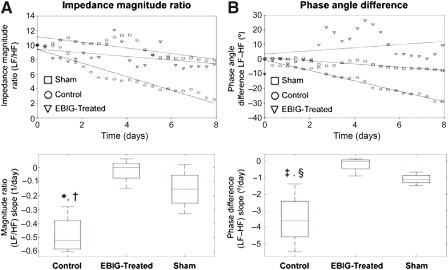
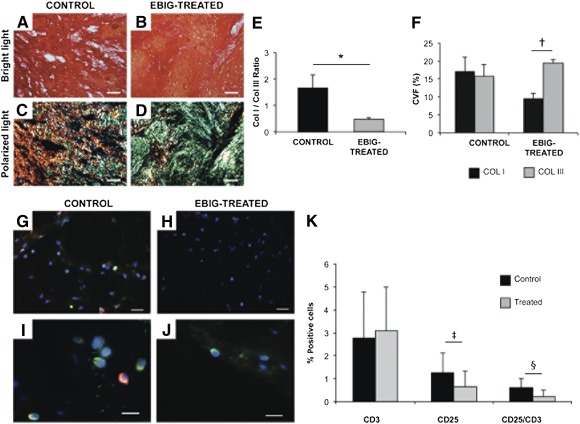
Cardiac tissue engineering, which combines cells and biomaterials, is promising for limiting the sequelae of myocardial infarction (MI). We assessed myocardial function and scar evolution after implanting an engineered bioactive impedance graft (EBIG) in a swine MI model. The EBIG comprises a scaffold of decellularized human pericardium, green fluorescent protein-labeled porcine adipose tissue-derived progenitor cells (pATPCs), and a customized-design electrical impedance spectroscopy (EIS) monitoring system. Cardiac function was evaluated noninvasively by using magnetic resonance imaging (MRI). Scar healing was evaluated by using the EIS system within the implanted graft. Additionally, infarct size, fibrosis, and inflammation were explored by histopathology. Upon sacrifice 1 month after the intervention, MRI detected a significant improvement in left ventricular ejection fraction (7.5% ± 4.9% vs. 1.4% ± 3.7%; p = .038) and stroke volume (11.5 ± 5.9 ml vs. 3 ± 4.5 ml; p = .019) in EBIG-treated animals. Noninvasive EIS data analysis showed differences in both impedance magnitude ratio (-0.02 ± 0.04 per day vs. -0.48 ± 0.07 per day; p = .002) and phase angle slope (-0.18° ± 0.24° per day vs. -3.52° ± 0.84° per day; p = .004) in EBIG compared with control animals. Moreover, in EBIG-treated animals, the infarct size was 48% smaller (3.4% ± 0.6% vs. 6.5% ± 1%; p = .015), less inflammation was found by means of CD25+ lymphocytes (0.65 ± 0.12 vs. 1.26 ± 0.2; p = .006), and a lower collagen I/III ratio was detected (0.49 ± 0.06 vs. 1.66 ± 0.5; p = .019). An EBIG composed of acellular pericardium refilled with pATPCs significantly reduced infarct size and improved cardiac function in a preclinical model of MI. Noninvasive EIS monitoring was useful for tracking differential scar healing in EBIG-treated animals, which was confirmed by less inflammation and altered collagen deposit. Stem Cells Translational Medicine 2017;6:647-655.
Keywords: Angiogenesis; Bioimpedance; Magnetic resonance imaging; Myocardial infarction; Progenitor cells.
© 2016 The Authors Stem Cells Translational Medicine published by Wiley Periodicals, Inc. on behalf of AlphaMed Press.
Figures
Similar articles
-
Large Cardiac Muscle Patches Engineered From Human Induced-Pluripotent Stem Cell-Derived Cardiac Cells Improve Recovery From Myocardial Infarction in Swine.Circulation. 2018 Apr 17;137(16):1712-1730. doi: 10.1161/CIRCULATIONAHA.117.030785. Epub 2017 Dec 12. Circulation. 2018. PMID: 29233823 Free PMC article.
-
Apoptosis-Resistant Cardiac Progenitor Cells Modified With Apurinic/Apyrimidinic Endonuclease/Redox Factor 1 Gene Overexpression Regulate Cardiac Repair After Myocardial Infarction.Stem Cells Transl Med. 2016 Aug;5(8):1067-78. doi: 10.5966/sctm.2015-0281. Epub 2016 Jun 22. Stem Cells Transl Med. 2016. PMID: 27334489 Free PMC article.
-
Magnetic Resonance Imaging of Cardiac Strain Pattern Following Transplantation of Human Tissue Engineered Heart Muscles.Circ Cardiovasc Imaging. 2016 Nov;9(11):e004731. doi: 10.1161/CIRCIMAGING.116.004731. Circ Cardiovasc Imaging. 2016. PMID: 27903535 Free PMC article.
-
New Insights into the Role of Exosomes in the Heart After Myocardial Infarction.J Cardiovasc Transl Res. 2019 Feb;12(1):18-27. doi: 10.1007/s12265-018-9831-z. Epub 2018 Sep 2. J Cardiovasc Transl Res. 2019. PMID: 30173401 Review.
-
Material-based engineering strategies for cardiac regeneration.Curr Pharm Des. 2014;20(12):2057-68. doi: 10.2174/13816128113199990582. Curr Pharm Des. 2014. PMID: 23886381 Review.
Cited by
-
Wharton's Jelly Mesenchymal Stromal Cells and Derived Extracellular Vesicles as Post-Myocardial Infarction Therapeutic Toolkit: An Experienced View.Pharmaceutics. 2021 Aug 26;13(9):1336. doi: 10.3390/pharmaceutics13091336. Pharmaceutics. 2021. PMID: 34575412 Free PMC article. Review.
-
Acellular cardiac scaffolds enriched with MSC-derived extracellular vesicles limit ventricular remodelling and exert local and systemic immunomodulation in a myocardial infarction porcine model.Theranostics. 2022 Jun 6;12(10):4656-4670. doi: 10.7150/thno.72289. eCollection 2022. Theranostics. 2022. PMID: 35832072 Free PMC article.
-
Recent advances in soluble decellularized extracellular matrix for heart tissue engineering and organ modeling.J Biomater Appl. 2023 Nov;38(5):577-604. doi: 10.1177/08853282231207216. J Biomater Appl. 2023. PMID: 38006224 Free PMC article. Review.
-
Sources, Characteristics, and Therapeutic Applications of Mesenchymal Cells in Tissue Engineering.Tissue Eng Regen Med. 2022 Apr;19(2):325-361. doi: 10.1007/s13770-021-00417-1. Epub 2022 Jan 29. Tissue Eng Regen Med. 2022. PMID: 35092596 Free PMC article. Review.
-
Decellularized extracellular matrix materials for treatment of ischemic cardiomyopathy.Bioact Mater. 2023 Nov 29;33:460-482. doi: 10.1016/j.bioactmat.2023.10.015. eCollection 2024 Mar. Bioact Mater. 2023. PMID: 38076651 Free PMC article. Review.
References
-
- Gálvez‐Montón C, Prat‐Vidal C, Roura S et al. Update: Innovation in cardiology (IV). Cardiac tissue engineering and the bioartificial heart. Rev Esp Cardiol (Engl Ed) 2013;66:391–399. - PubMed
-
- Badylak SF, Freytes DO, Gilbert TW. Extracellular matrix as a biological scaffold material: Structure and function. Acta Biomater 2009;5:1–13. - PubMed
-
- Midwood KS, Williams LV, Schwarzbauer JE. Tissue repair and the dynamics of the extracellular matrix. Int J Biochem Cell Biol 2004;36:1031–1037. - PubMed
Publication types
MeSH terms
LinkOut - more resources
Full Text Sources
Other Literature Sources
Medical
Molecular Biology Databases
