. 2017 Apr;49(4):537-549.
doi: 10.1038/ng.3790. Epub 2017 Feb 13.

Mutations in DONSON disrupt replication fork stability and cause microcephalic dwarfism

Affiliations

Mutations in DONSON disrupt replication fork stability and cause microcephalic dwarfism

John J Reynolds et al. Nat Genet. 2017 Apr.

Abstract

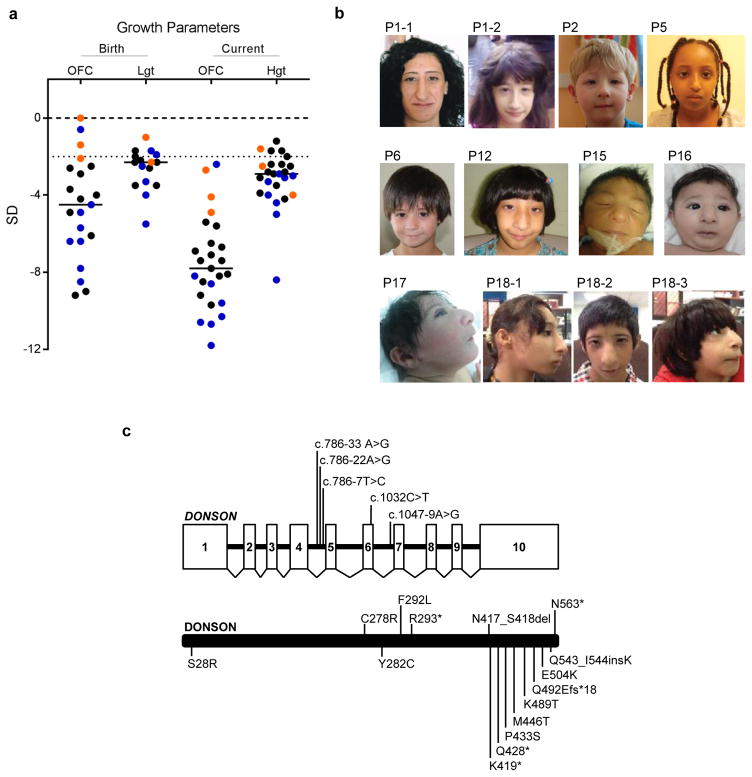
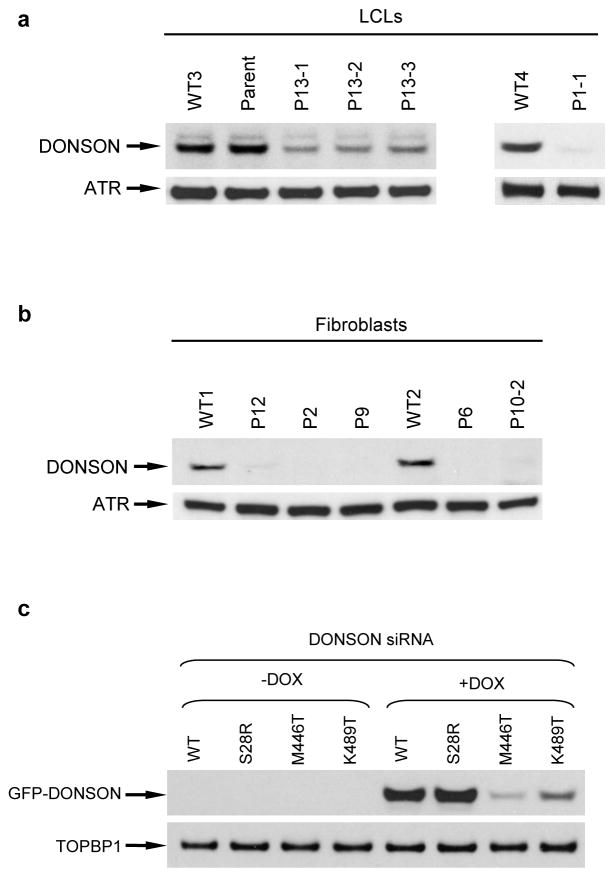
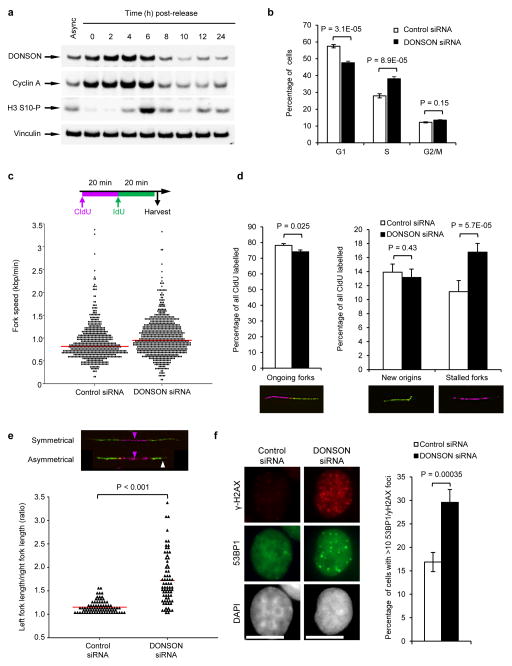
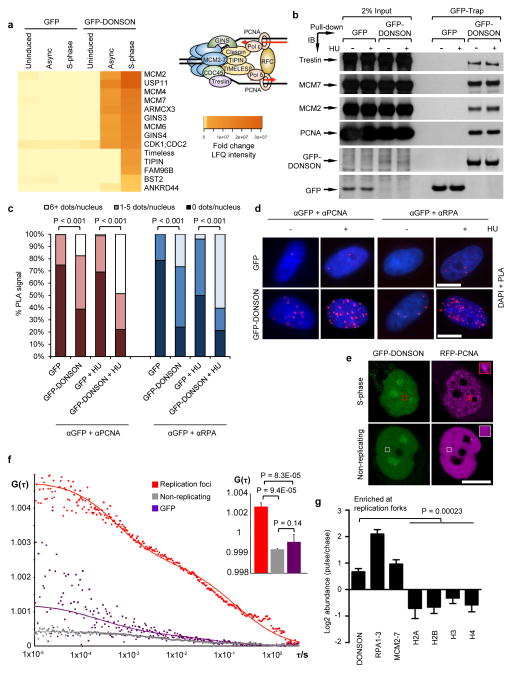
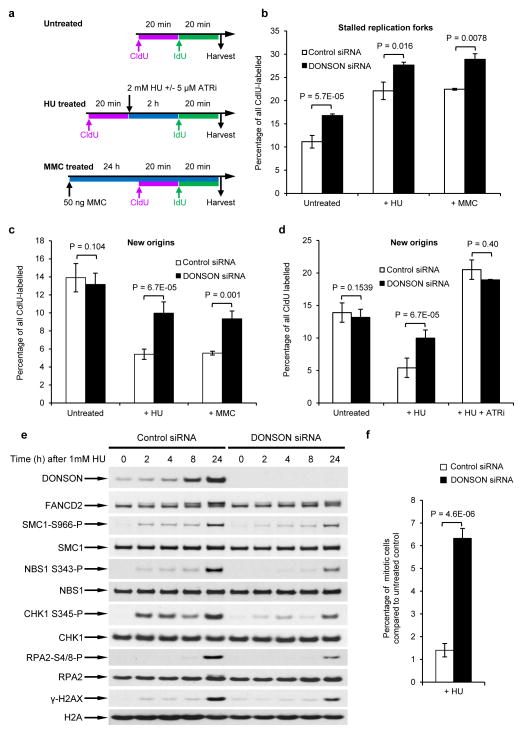
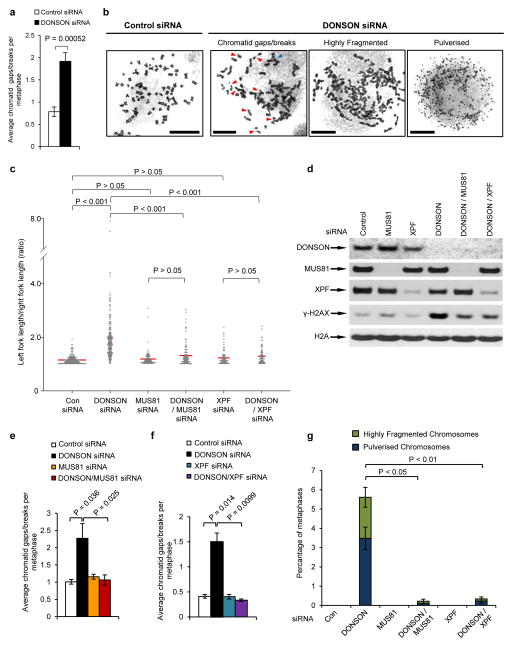
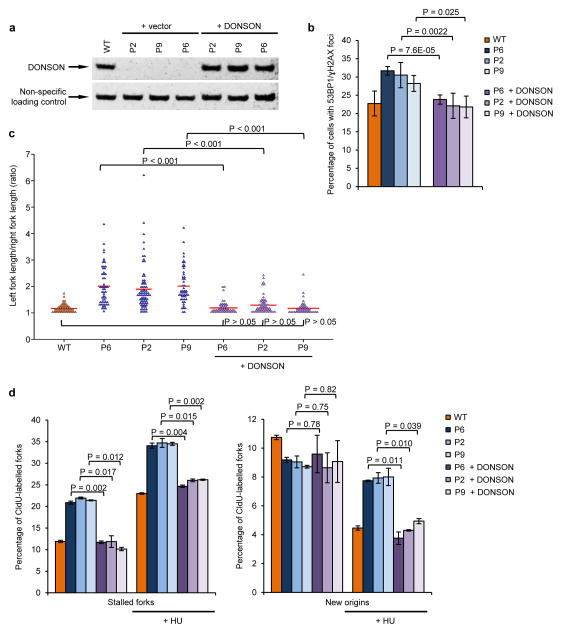
To ensure efficient genome duplication, cells have evolved numerous factors that promote unperturbed DNA replication and protect, repair and restart damaged forks. Here we identify downstream neighbor of SON (DONSON) as a novel fork protection factor and report biallelic DONSON mutations in 29 individuals with microcephalic dwarfism. We demonstrate that DONSON is a replisome component that stabilizes forks during genome replication. Loss of DONSON leads to severe replication-associated DNA damage arising from nucleolytic cleavage of stalled replication forks. Furthermore, ATM- and Rad3-related (ATR)-dependent signaling in response to replication stress is impaired in DONSON-deficient cells, resulting in decreased checkpoint activity and the potentiation of chromosomal instability. Hypomorphic mutations in DONSON substantially reduce DONSON protein levels and impair fork stability in cells from patients, consistent with defective DNA replication underlying the disease phenotype. In summary, we have identified mutations in DONSON as a common cause of microcephalic dwarfism and established DONSON as a critical replication fork protein required for mammalian DNA replication and genome stability.


Conflict of interest statement

Competing Financial Interests Statement

The authors declare no competing financial interests.

Figures

Figure 1
Figure 1. DONSON mutations cause severe microcephaly and short stature
(a) DONSON mutations result in severe prenatal-onset microcephaly, often associated with short stature. Length at birth (Lgt), current height (Hgt) and head circumference (OFC) plotted as z-scores (SD from population mean for age and sex). Black horizontal bars indicate mean values. Dashed line at −2 SD indicates cut-off for normal population distribution. Patients from the three independently identified DONSON patient cohorts are denoted by black (P1–P12 and P20), orange (P13), and blue (P14–19 and P21) circles. (b) Photographs of affected individuals with DONSON mutations demonstrating facial similarities. Written consent to publish photographs was obtained from the affected families. P, patient. (c) Schematics of the DONSON gene and protein indicating position of the identified mutations. DONSON mutations comprised a range of mutation classes (nonsense, frameshift, essential splice site, missense and intronic). The genomic structure is based on the longest ORF containing ten coding exons (white rectangles) (NM_017613.3). The positions of identified mutations affecting splicing are shown on the gene structure (top) and missense and truncating variants on the encoded protein (bottom).
Figure 2
Figure 2. Mutations in DONSON affect protein levels
(a–b) DONSON mutations result in severely reduced levels of DONSON protein. Immunoblotting of cell extracts from lymphoblastoid (a) and fibroblast (b) cell lines derived from patients with mutations in DONSON. ATR was used as a loading control. The two blots from (a) originate from two independent gels. (c) The K489T, but not the S28R variant, associated with the DONSON haplotype affects protein levels. Cells were treated with doxycycline 48 h post siRNA transfection, and harvested for Western blot analysis 24 h later (n=2). Exogenous DONSON were detected using an anti-GFP antibody respectively. TOPBP1 was used as a loading control. Depletion of endogenous DONSON in these cells was confirmed by immunoblotting (Supplementary Fig. 2).
Figure 3
Figure 3. Loss of DONSON results in spontaneous replication fork stalling and increased genome instability
(a) DONSON protein levels are increased during S-phase. HeLa cells were synchronised in S-phase using a double thymidine block, released, harvested at the indicated time points, and immunoblotting was performed (n=2). Cyclin A and phospho-histone H3 Ser-10 are markers of S/G2 and M phase respectively. Vinculin represents a loading control. (b) S-phase is prolonged upon DONSON depletion. HeLa cells transfected with the indicated siRNAs were pulsed with BrdU, fixed and analysed by FACS (n=4; error bars indicate SD). (c–e) Replication fork analysis of HeLa cells transfected with control or DONSON siRNA and pulsed with CldU and IdU. (c) Top: Schematic of DNA fibre analysis. Bottom: loss of DONSON does not decrease replication fork velocity. Replication fork speed (kb/min) was determined (n=5). (d) DONSON depletion results in spontaneous fork stalling. Percentages of ongoing replication forks, new origins and stalled replication forks in cells from (c) were quantified (n=3). (e) DONSON depletion leads to replication fork asymmetry. Top: example images; magenta arrows indicate origins of replication; white arrow denotes fork asymmetry. Bottom: plot indicates the ratio of left/right fork track lengths of bidirectional replication forks in cells from (c). Red lines denote median ratios (n=3). (f) Loss of DONSON increases spontaneous γH2AX/53BP1 foci formation. HeLa cells transfected with the indicated siRNAs were immunostained with antibodies to 53BP1 and γH2AX (left panel), and the percentage of cells with >10 53BP1 and γH2AX foci were quantified using fluorescence microscopy (right panel; n=5; >300 cells per sample per independent experiment). Scale bar; 10 μm.
Figure 4
Figure 4. DONSON localizes to the replication fork
(a–d) DONSON interacts with multiple components of the replication machinery. (a) GFP or GFP-DONSON was precipitated by GFP-Trap, from asynchronous cells or cells accumulated in S-phase with 2 mM HU treatment for 24 h. Heatmap denotes significant interactions identified by mass spectrometry (n=3). Inset: Schematic of the mammalian replisome with selected replication factors. (b) 293FT cells were transfected with the indicated expression vectors in the presence/absence of HU. GFP or GFP-DONSON were isolated by GFP-Trap and co-precipitating proteins visualised by immunoblotting (n=2). Benzonase Nuclease was included to exclude DNA-mediated interactions. The bottom two panels are scanned images of Ponceau S-stained nitrocellulose membrane. (c–d) DONSON localises in close proximity to replication forks. (c–d) PLA was carried out on cells from (a) using the indicated antibodies in the presence/absence of HU (n=2). (c) Quantification of PLA signals. (d) Representative PLA images. (e–f) DONSON interacts with PCNA at replication foci in live cells. (e) Representative confocal images of live cells expressing GFP-DONSON and RFP-PCNA. Boxes indicate representative regions used for FCCS analysis. (f) FCCS measurements of GFP-DONSON and RFP-PCNA reveal significant cross-correlation at replication foci at similar concentrations. Average cross-correlation curves are shown from cells expressing GFP-DONSON in replication foci (red) or non-replicating (grey) cells, or GFP-expressing S-phase nuclei (purple). Inset: Mean cross-correlation amplitude values from multiple cells (error bars indicate SD; n=4, 3 and 5). Increased G(τ) values indicate higher degree of cross-correlation between GFP-DONSON and RFP-PCNA in replication foci. See also Supplementary Fig. 11. (g) iPOND was performed on 293T (n=3), HeLa (n=2) and HCT116 (n=2) cells, and EdU-coprecipitates analysed by mass spectrometry. Data represents the combination of all seven experiments. Log2 abundance denotes the ratio of proteins at nascent DNA compared to mature chromatin. Values >0 represent proteins enriched at forks, whilst values ≤ 0 denote chromatin-bound factors. Scale bars; 10 μm.
Figure 5
Figure 5. Depletion of DONSON compromises activation of cell cycle checkpoints
(a–c) Loss of DONSON results in replication fork instability that is exacerbated by replication stress. (a) HeLa cells transfected with either control or DONSON siRNA were pulsed with CldU, exposed to 2 mM HU for 2 h, and then pulsed with IdU. Alternatively, cells were exposed to 50 ng/ml MMC for 24 h, and pulsed with sequential pulses of CldU and IdU (see schematic). DNA fibres were quantified, and the percentage of (b) stalled forks and (c) new origins are displayed (in all cases n=3). (d) Loss of DONSON is epistatic with ATR inhibition. Replication fork analysis of HeLa cells transfected with either control or DONSON siRNA. Cells were pulsed with CldU, exposed to 2 mM HU +/− 5μM ATR inhibitor for 2 h, and then pulsed with IdU (n=3). New origins (2nd label origin) were counted as an indicator of intra-S phase checkpoint activation. (e) Cells lacking DONSON exhibit defective or delayed ATR activation in response to replication stress. Whole cell extracts of HeLa cells transfected with either control or DONSON siRNA were subjected to immunoblot analysis using the indicated antibodies following treatment with 1 mM HU (n=2). (f) The percentage of mitotic cells following exposure to 1 mM HU for 24 h (from (e)) was determined by flow cytometry, using antibodies to phosphorylated histone H3-Ser10 (a marker of mitosis) (n=5).
Figure 6
Figure 6. Increased spontaneous chromosome breakage and fragmentation of mitotic chromosomes in DONSON-depleted cells
(a,b) Metaphases chromosomes from DONSON or control siRNA transfected HeLa cells were visualised by Giemsa staining and light microscopy. (a) Quantification of average numbers of chromatid gaps/breaks per metaphase (n=6; >50 metaphases per sample per experiment). (b) Representative images of normal chromosomes, chromosomes containing gaps/breaks, highly fragmented and pulverized chromosomes. Red arrows denote chromatid gaps/breaks; blue arrows indicate chromosomal exchanges. Scale bar; 10 μm. (c–g) Loss of the structure-specific nucleases MUS81 or XPF significantly reduces the spontaneous replication fork asymmetry and genome instability in DONSON-depleted cells. (c) Cells transfected with the indicated siRNAs were pulsed with CldU and IdU. Replication fork asymmetry was measured as in (Fig. 3e). The red lines denotes median ratios (n=3). (d) Co-depletion of MUS81 or XPF with DONSON reduces levels of spontaneous DNA damage. Extracts from cells transfected with the indicated siRNAs were subjected to SDS-PAGE and immunoblotting using the antibodies indicated. (e–f) Co-depletion of MUS81 (e) or XPF (f) reduces chromosomal aberrations in cells lacking DONSON. Quantification of the average number of chromatid gaps/breaks per metaphase in cells transfected with control, DONSON, MUS81 and/or XPF siRNA. At least 50 metaphases per experiment were counted (n=3). (g) Quantification of the average percentage of metaphases containing highly fragmented chromosomes or pulverized chromosomes in cells transfected with the indicated siRNAs. At least 50 metaphases per experiment were counted (n=3).
Figure 7
Figure 7. DONSON patient cells have spontaneous defects in replication fork progression that result in DNA damage
(a) Complementation of patient-derived fibroblasts with WT DONSON. Fibroblasts derived from DONSON patients P2, P6 and P9 were infected with retroviruses encoding either WT DONSON or an empty vector. DONSON expression was determined by immunoblotting. A non-specific cross-reactive protein represents a loading control. (b) Expression of WT DONSON in patient fibroblasts rescues elevated levels of spontaneous DNA damage. The percentage of cells from (a) with 53BP1/γH2AX foci was quantified by immunostaining (n=3). (c) DNA fibre analysis of complemented DONSON patient fibroblasts pulsed with CldU and IdU. Fork asymmetry was quantified. Plot indicates ratios of left/right fork track lengths of bidirectional replication forks. The red lines denote median ratios. (n=3). (d) The percentage of stalled forks and new origins from cells in (c) was quantified (n=3). Ongoing forks are shown in (Supplementary Fig. 19).

References

    1. Klingseisen A, Jackson AP. Mechanisms and pathways of growth failure in primordial dwarfism. Genes Dev. 2011;25:2011–24. - PMC - PubMed
    1. O’Driscoll M, Ruiz-Perez VL, Woods CG, Jeggo PA, Goodship JA. A splicing mutation affecting expression of ataxia-telangiectasia and Rad3-related protein (ATR) results in Seckel syndrome. Nat Genet. 2003;33:497–501. - PubMed
    1. Ogi T, et al. Identification of the first ATRIP-deficient patient and novel mutations in ATR define a clinical spectrum for ATR-ATRIP Seckel Syndrome. PLoS Genet. 2012;8:e1002945. - PMC - PubMed
    1. German J. Bloom’s syndrome. I. Genetical and clinical observations in the first twenty-seven patients. Am J Hum Genet. 1969;21:196–227. - PMC - PubMed
    1. Harley ME, et al. TRAIP promotes DNA damage response during genome replication and is mutated in primordial dwarfism. Nat Genet. 2016;48:36–43. - PMC - PubMed

Substances