

Core dimensions of anxiety and depression change independently during adolescence
- PMID: 28192011
- PMCID: PMC5308556
- DOI: 10.1037/abn0000222
Core dimensions of anxiety and depression change independently during adolescence
Abstract
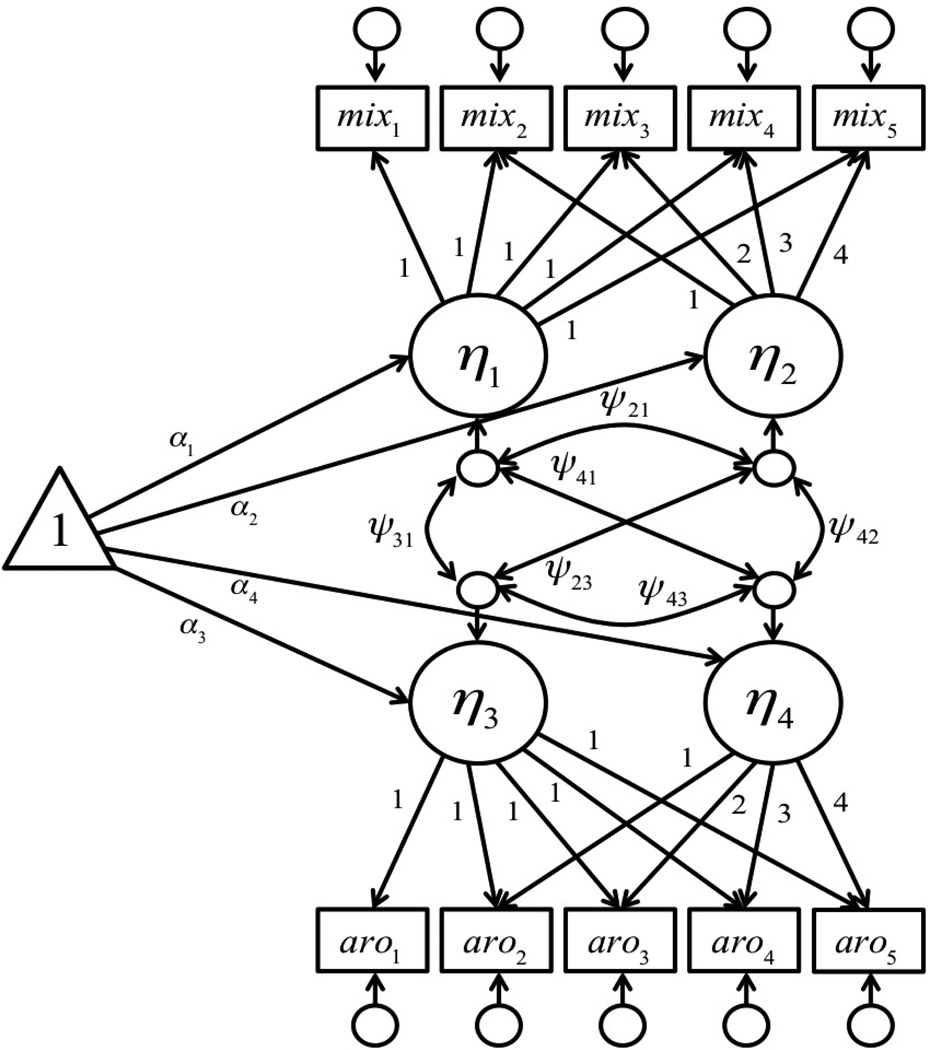
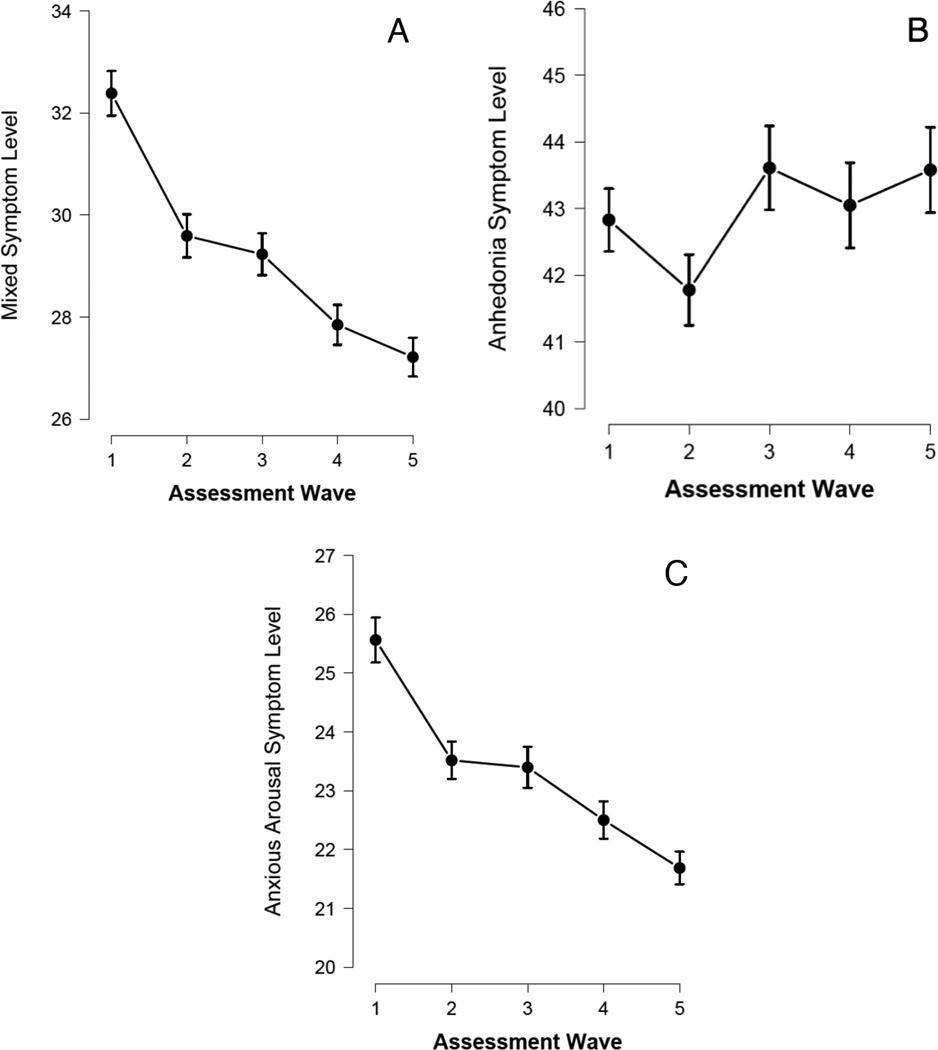
The developmental trajectories of emotional disorder symptoms during adolescence remain elusive, owing in part to a shortage of intensive longitudinal data. In the present study, we charted the temporal course of the tripartite model of anxiety and depression-which posits an overarching negative affect dimension and specific anhedonia and anxious arousal dimensions-over adolescence and emerging adulthood to construct a developmental map of the core dimensions of emotional disorders. We recruited 604 high school juniors, overselecting those at high risk for emotional disorders, and assessed the tripartite symptom domains 5 times annually. Latent curve modeling revealed that negative affect and anxious arousal declined over follow up, whereas anhedonia did not. Moreover, the correlation in rate of change varied across pairs of symptom domains. Change in negative affect was moderately correlated with change in anxious arousal, but change in anhedonia was not significantly related to change in any other domain. Symptom trajectories, and the pattern of covariation among trajectories, were equivalent across gender and comorbidity status. We discuss implications of these findings for developmental models of anxiety and depression, as well as transdiagnostic frameworks for emotional disorders. (PsycINFO Database Record
(c) 2017 APA, all rights reserved).
Figures
Similar articles
-
[Affectivity and alexithymia: two dimensions explicative of the relationship between anxiety and depressive symptoms].Encephale. 2012 Jun;38(3):187-93. doi: 10.1016/j.encep.2011.03.006. Epub 2011 Oct 7. Encephale. 2012. PMID: 22726406 French.
-
Neuroticism and the longitudinal trajectories of anxiety and depressive symptoms in older adolescents.J Abnorm Psychol. 2021 Feb;130(2):126-140. doi: 10.1037/abn0000638. Epub 2020 Dec 14. J Abnorm Psychol. 2021. PMID: 33315412
-
Testing a tripartite model: I. Evaluating the convergent and discriminant validity of anxiety and depression symptom scales.J Abnorm Psychol. 1995 Feb;104(1):3-14. doi: 10.1037//0021-843x.104.1.3. J Abnorm Psychol. 1995. PMID: 7897050
-
A review of the tripartite model for understanding the link between anxiety and depression in youth.Clin Psychol Rev. 2008 Feb;28(2):275-87. doi: 10.1016/j.cpr.2007.05.004. Epub 2007 May 25. Clin Psychol Rev. 2008. PMID: 17582665 Review.
-
Applying the tripartite model of anxiety and depression to cigarette smoking: an integrative review.Nicotine Tob Res. 2010 Dec;12(12):1183-94. doi: 10.1093/ntr/ntq174. Epub 2010 Oct 29. Nicotine Tob Res. 2010. PMID: 21036959 Free PMC article. Review.
Cited by
-
Development of Self-Reported Reward Responsiveness and Inhibitory Control and the Role of Clinical and Neural Predictors.J Pers. 2024 Nov 9:10.1111/jopy.12991. doi: 10.1111/jopy.12991. Online ahead of print. J Pers. 2024. PMID: 39520133
-
Temporal dynamics of affect in the brain: Evidence from human imaging and animal models.Neurosci Biobehav Rev. 2022 Feb;133:104491. doi: 10.1016/j.neubiorev.2021.12.014. Epub 2021 Dec 11. Neurosci Biobehav Rev. 2022. PMID: 34902442 Free PMC article. Review.
-
Anxiety in transition: Neuroendocrine mechanisms supporting the development of anxiety pathology in adolescence and young adulthood.Front Neuroendocrinol. 2019 Oct;55:100791. doi: 10.1016/j.yfrne.2019.100791. Epub 2019 Sep 19. Front Neuroendocrinol. 2019. PMID: 31542287 Free PMC article. Review.
-
Family Support Protocol for Adolescent Internalizing Disorders: Protocol for a Pre-Post Quantitative Treatment Development Study.JMIR Res Protoc. 2024 Sep 16;13:e64332. doi: 10.2196/64332. JMIR Res Protoc. 2024. PMID: 39284179 Free PMC article.
-
Temporal dynamics and longitudinal co-occurrence of depression and different anxiety syndromes in youth: Evidence for reciprocal patterns in a 3-year prospective study.J Affect Disord. 2018 Jul;234:20-27. doi: 10.1016/j.jad.2018.02.074. Epub 2018 Feb 27. J Affect Disord. 2018. PMID: 29522939 Free PMC article.
References
-
- Allison PD. Missing data techniques for structural equation modeling. Journal of Abnormal Psychology. 2003;112:545–557. - PubMed
-
- American Psychiatric Association. Diagnostic and Statistical Manual of Mental Disorders. 4th. Arlington, VA: American Psychiatric Association; 1994.
-
- Arnett JJ. Emerging adulthood: A theory of development from the late teens through the twenties. American Psychologist. 2000;55:469–480. - PubMed
-
- Beck AT, editor. Cognitive therapy of depression. Guilford press; 1979.
-
- Bollen KA, Curran PJ. Latent curve models: A structural equation perspective. John Wiley & Sons; 2006.
MeSH terms
Grants and funding
LinkOut - more resources
Full Text Sources
Other Literature Sources
Medical
