. 2017 Apr;20(4):550-558.
doi: 10.1038/nn.4498. Epub 2017 Feb 13.

Retinal origin of direction selectivity in the superior colliculus

Affiliations

Retinal origin of direction selectivity in the superior colliculus

Xuefeng Shi et al. Nat Neurosci. 2017 Apr.

Abstract

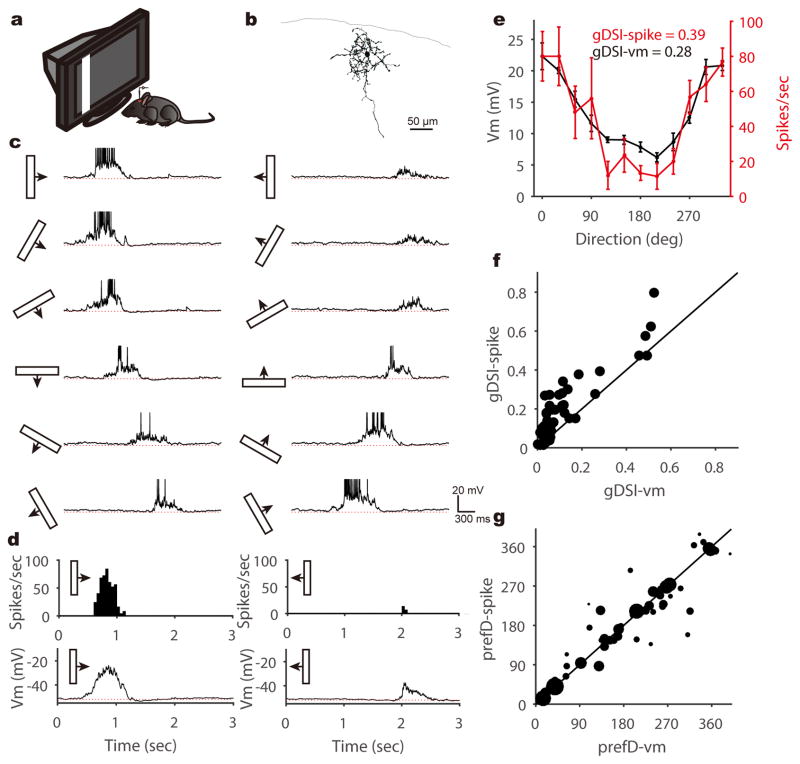
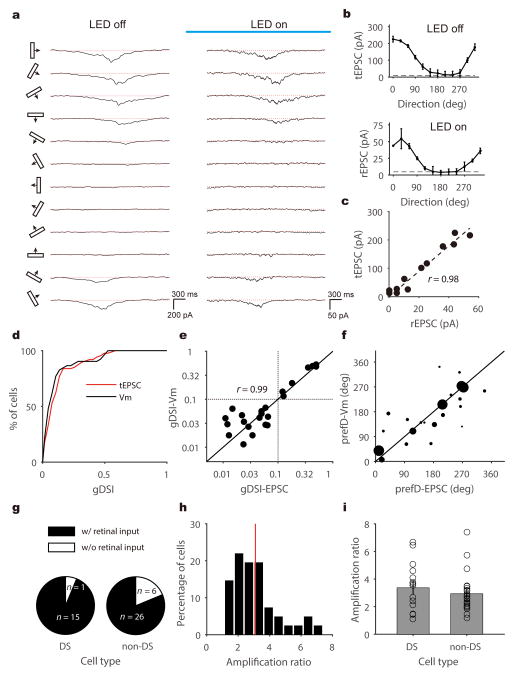
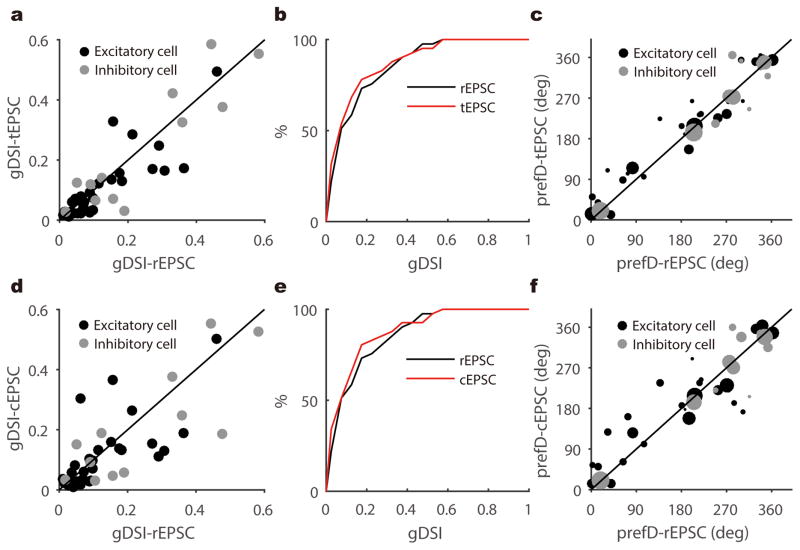
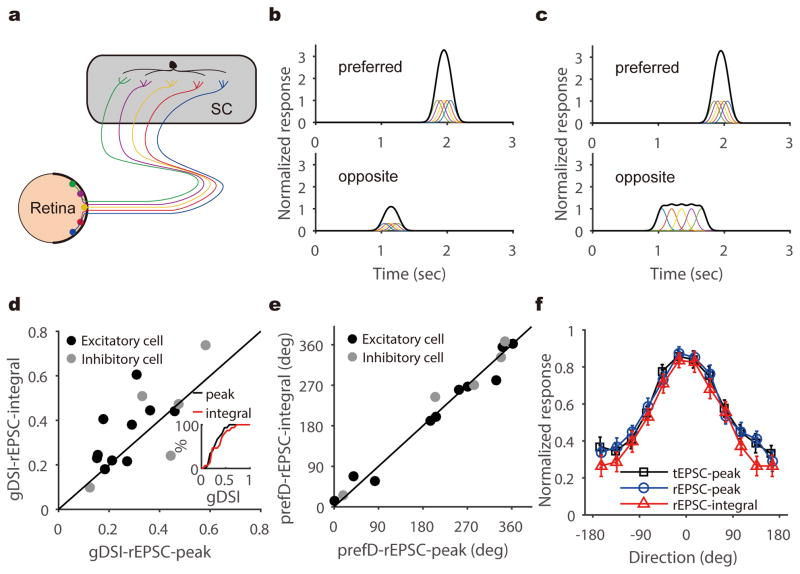
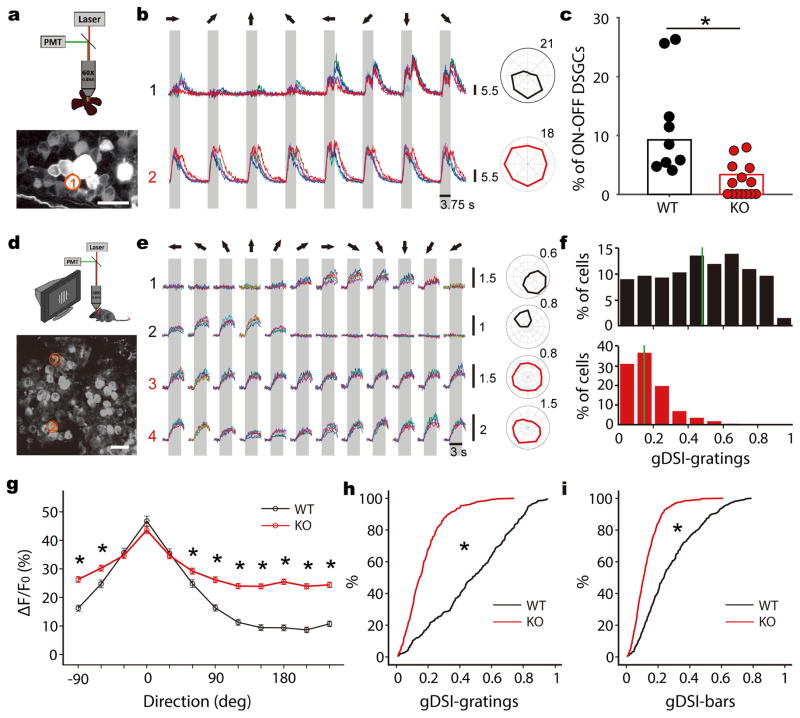
Detecting visual features in the environment, such as motion direction, is crucial for survival. The circuit mechanisms that give rise to direction selectivity in a major visual center, the superior colliculus (SC), are entirely unknown. We optogenetically isolate the retinal inputs that individual direction-selective SC neurons receive and find that they are already selective as a result of precisely converging inputs from similarly tuned retinal ganglion cells. The direction-selective retinal input is linearly amplified by intracollicular circuits without changing its preferred direction or level of selectivity. Finally, using two-photon calcium imaging, we show that SC direction selectivity is dramatically reduced in transgenic mice that have decreased retinal selectivity. Together, our studies demonstrate a retinal origin of direction selectivity in the SC and reveal a central visual deficit as a consequence of altered feature selectivity in the retina.


Conflict of interest statement

The authors declare no competing financial interests.

Figures

Figure 1
Figure 1. SGS neurons’ membrane potential responses to sweeping bars
a, A schematic of the experimental setup. b, Morphology of an example SGS neuron. c, This neuron’s membrane potential (Vm) traces in response to sweeping bars. The movement direction is diagramed by the bar and arrow to the left of each trace. Action potentials are truncated at −10mV to better reveal visually-evoked Vm responses. The red dotted lines indicate the resting membrane potential of −53 mV. d, This cell’s mean spike and Vm responses to bars moving along its preferred (left column) and opposite (right) directions. Peri-stimulus spike time histograms (top) and trial-averaged Vm (bottom) are shown. The red dotted lines indicate the resting Vm. e, This cell’s direction tuning curve for peak Vm (black, left axis) and spike rate (red, right axis). Note that the Vm tuning curve is slightly above the spike one around the non-preferred directions. Data are presented as mean ± SEM, and n = 5, 5, 5, 5, 5, 6, 6, 7, 6, 6, 5, 6 trials for the 12 directions, respectively. f, Scatter plot of gDSI for spikes (“gDSI-spike”) versus gDSI-Vm (n = 52 cells). Most cells’ gDSI-spike are greater than the gDSI-Vm, but some have nearly identical values (i.e., on the marked identity line). g, Scatter plot of the preferred direction (“prefD”) for spike versus that for Vm responses. The diameter of each dot is scaled to the gDSI-spike of that cell. The solid line is the line of identity. Note that the preferred directions are similar for spike and Vm responses, especially for highly selective cells.
Figure 2
Figure 2. Voltage clamp recording and optogenetic silencing to isolate retinal excitation to SGS neurons
a, Trial-averaged EPSC traces of an example SGS neuron to bars moving along 12 directions in the absence (left panel) or presence (right) of LED illumination (as indicated by the blue bar). The red dotted lines indicate the mean current level in the absence of visual stimulus. b, Direction tuning curves of this cell’s total EPSC (top panel, “tEPSC”) and retinal input (bottom, “rEPSC”). The dashed lines indicate the level that is 3 standard deviations above the mean current level as determined in the absence of visual stimulus. Data are presented as mean ± SEM, and n = 8, 7, 7, 7, 6, 7, 7, 7, 7, 7, 6, 6 trials in the top panel and n = 3 for all directions in the bottom panel. c, Scatter plot of this cell’s tEPSC versus its rEPSC. Peak rEPSC and tEPSC amplitudes are plotted for the responses to 12 directions of bars. The dotted line is the linear regression of the data points (R2 = 0.95, F(1,10) = 192.7, p < 0.001, linear regression; r = 0.98, p < 0.001, Pearson correlation). d, Cumulative distributions of gDSI for tEPSC (n = 87 cells from 58 mice, red) and for Vm (n = 52 cells from 41 mice, black), indicating that tEPSC and Vm have nearly identical gDSI distributions (p = 0.30 K-S stat = 0.17, K-S test). e, Scatter plot of gDSI values for tEPSC and Vm in the same cells (n = 23 cells from 21 mice). They are well correlated (r = 0.99, p < 0.001, Pearson correlation) and similar in values (p = 0.18, W = 90, Wilcoxon test). Note that the plot is shown in log-log axis to better illustrate the cells with low gDSI. The dotted lines indicate gDSI levels of 0.1. f, Scatter plot of the preferred direction (“prefD”) for Vm versus EPSC. The diameter of each dot is scaled to the gDSI- Vm of that cell. Note that the preferred directions are similar for EPSC and Vm responses, especially for highly selective cells. The solid lines in both panel e and f are the lines of identity. g, Percentage of cells that receive direct retinal input in DS (n = 15/16) and non-DS (n = 26/32) SGS neurons. h, Distribution of amplification ratio of all cells that receive direct retinal input (n = 41). The red line indicates the mean of the distribution. i, Similar amplification ratio between DS (3.37 ±0.46, n = 15 cells from 13 mice) and non-DS (2.94 ± 0.26, n = 26 cells from 20 mice) SGS neurons (p = 0.41, U = 164, Mann-Whitney U test). Data are presented as mean ± SEM.
Figure 3
Figure 3. Retinal excitation and total excitation are similarly tuned in SGS neurons
a, Scatter plot of gDSI of the peak tEPSC versus that of peak rEPSC, indicating their gDSI values were well correlated (n = 41 cells from 28 mice, r = 0.89, p < 0.001, Pearson correlation). The gDSI values for tEPSCs and rEPSC were similar in cells that receive DS excitation (i.e., cells whose gDSI-tEPSC or gDSI-rEPSC ≥ 0.1, n = 22/41 cells, p = 0.34, W = 61, Wilcoxon test). b, Cumulative distribution of data shown in a. c, The preferred direction (“prefD”) of the peak tEPSC versus that of peak rEPSC. The diameter of each dot is scaled to the gDSI of that cell’s tEPSC. d–f, Same as a–c, but comparing collicular EPSC (“cEPSC”) versus rEPSC. In panel d, n = 41 cells from 28 mice, r = 0.77, p < 0.001, Pearson correlation. n = 23 cells whose gDSI-cEPSC or gDSI-rEPSC ≥ 0.1, p = 0.30, W = 70, Wilcoxon test. In panel f, the diameter of each dot is scaled to the gDSI of that cell’s peak rEPSC. The solid lines in panel a, c, d and f are the lines of identity.
Figure 4
Figure 4. SGS direction selectivity originates from individually-tuned retinal inputs
a–c, Two different scenarios where retinal inputs could give rise to direction selectivity in the SGS. In one (b), individual retinal inputs, as indicated by traces of different colors, are selective for similar directions, thus resulting in larger excitation to the preferred (top) than to the opposite direction (bottom). In the other scenario (c), individual retinal inputs respond with similar amplitudes to all directions. These non-DS retinal inputs arrive at the postsynaptic cell synchronously in response to the preferred direction (top) and asynchronously to the opposite direction (bottom), thus resulting in different peak amplitudes. In this scenario, the total charge of rEPSC would be much less selective than their peaks. d, gDSI of rEPSC integral and peak were correlated (r = 0.71, p = 0.003, Pearson correlation) and similar for individual DS neurons (p = 0.11, W = 58, Wilcoxon test, n = 15 cells from 13 mice), supporting the scenario shown in (b). Inset shows the cumulative distribution of the two. e, The integral and peak of retinal EPSCs prefer similar directions in DS SGS neurons. The solid lines in both panel d and e are the lines of identity. f, Averaged tuning curves for tEPSC-peak (black), rEPSC-peak (blue), and rEPSC-integral (red) in DS SGS neurons (n = 15 cells from 13 mice). Individual curves were normalized by their maximum responses and aligned to their preferred directions. They were then averaged for plotting. Error bars represent SEM.
Figure 5
Figure 5. Genetic disruption of retinal direction selectivity reduces selectivity in the SGS
a, A schematic of 2-photon calcium imaging of retina (top). The bottom panel shows a max-intensity projection of GCaMP6 fluorescence in an example field of view. Scale bar is 25 μm. b, Top panel shows Ca2+ signals of the RGC circled in a to the presentation of moving bars in 8 directions (different colors represent separate trials). The gray shade corresponds to the time interval in which the bar stimulus sweeps across the field of view and the arrows represent the direction of movement in relation to the polar plot on the right. This cell showed DS responses to both leading and trailing edges of the moving bars, indicating that it was an On-Off DSGC. Bottom panel shows an On-Off cell from a Vgat conditional KO mouse. c, Summary plot showing the percentages of On-Off DSGCs in WT (black, n = 60/648 cells from 9 mice) and KO (red, n = 19/566 cells from 14 mice) retinas (p <0.001, χ2 = 17.3, χ2 test). Data points represent percentages of On-Off DSGCs in individual mice. d, A schematic of 2-photon imaging of the SGS (top) and an example field of view from a WT (bottom). Scale bar is 20 μm. e, Ca2+ signals of the two neurons (1 and 2) circled in d, and of two neurons from a Vgat KO (3 and 4), in response to drifting gratings. The gray boxes mark the duration of stimulation. The moving directions are represented by arrows on top. Corresponding polar plots are shown to the right. Scale bars for the Ca2+ signals and polar plots in b and e represent the change in fluorescence from baseline (ΔF/F0). f, gDSI distribution of WT (top, black) and KO (bottom, red) cells to drifting gratings. The solid green lines indicate the median of distributions. g, Average WT (black, n = 310 cells from 5 mice) and KO (red, n = 407 from 8 mice) tuning curves to gratings after aligning each cell’s preferred direction at 0. * indicate statistically significant difference between genotypes (all p-values < 0.001, Mann-Whitney U test). Data are presented as mean ± SEM. h, Cumulative distribution of the data shown in f (p < 0.001, K-S stat = 0.61, K-S test). i, Cumulative distribution of gDSI to sweeping bars (p < 0.001, K-S stat = 0.43, K-S test).

References

    1. Wei W, Feller MB. Organization and development of direction-selective circuits in the retina. Trends Neurosci. 2011;34:638–645. doi: 10.1016/j.tins.2011.08.002. - DOI - PMC - PubMed
    1. Vaney DI, Sivyer B, Taylor WR. Direction selectivity in the retina: symmetry and asymmetry in structure and function. Nat Rev Neurosci. 2012;13:194–208. doi: 10.1038/nrn3165. - DOI - PubMed
    1. Priebe NJ, Ferster D. Mechanisms of neuronal computation in mammalian visual cortex. Neuron. 2012;75:194–208. doi: 10.1016/j.neuron.2012.06.011. S0896-6273(12)00571-5 [pii] - DOI - PMC - PubMed
    1. Cang J, Feldheim DA. Developmental mechanisms of topographic map formation and alignment. Annu Rev Neurosci. 2013;36:51–77. - PubMed
    1. Gandhi NJ, Katnani HA. Motor functions of the superior colliculus. Annu Rev Neurosci. 2011;34:205–231. - PMC - PubMed

Substances

LinkOut - more resources