. 2017 Apr;18(4):456-463.
doi: 10.1038/ni.3680. Epub 2017 Feb 13.

Defining B cell immunodominance to viruses

Affiliations

Defining B cell immunodominance to viruses

Davide Angeletti et al. Nat Immunol. 2017 Apr.

Abstract

Immunodominance (ID) defines the hierarchical immune response to competing antigens in complex immunogens. Little is known regarding B cell and antibody ID despite its importance in immunity to viruses and other pathogens. We show that B cells and serum antibodies from inbred mice demonstrate a reproducible ID hierarchy to the five major antigenic sites in the influenza A virus hemagglutinin globular domain. The hierarchy changed as the immune response progressed, and it was dependent on antigen formulation and delivery. Passive antibody transfer and sequential infection experiments demonstrated 'original antigenic suppression', a phenomenon in which antibodies suppress memory responses to the priming antigenic site. Our study provides a template for attaining deeper understanding of antibody ID to viruses and other complex immunogens.


Figures
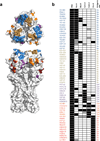
Figure 1
Figure 1. Characterization of Δ4 viruses
(a) Crystal structure of PR8 HA (PDB: 1RUZ) viewed from top and side with the five major globular domain antigenic sites in color Sa (blue), Sb (gold), Ca1 (purple), Ca2 (orange), Cb (red). (b) Antigenicity of the Δ4 viruses assessed by measuring the relative binding affinity by ELISA with a panel of 62 well characterized mAbs. Black: similar affinity to the parental PR8 virus, grey: >2 but <10 fold KD reduction, white: >10fold reduction in KD.
Figure 2
Figure 2. B cell kinetics and Ab immunodominance upon IAV infection
We infected C57BL/6 mice i.n. with 50 TCID50 PR8. (a) At the indicated time points MLN were collected and analyzed individually by ELISPOT on rHA derived from the different Δ viruses. Graph represent mean and s.e.m. (bars) of three independent experiments with 3 individual mice each. (b) Bar graph showing the frequency of antigenic site-specific germinal center B cells at different d.p.i.. Column represent mean and SEM (bars). S12 frequencies were considered baseline and subtracted from PR8 and Δ4 values. Shown are three independent experiments where MLN from 5 animals were pooled. (c) We tested serum collected 14, 21, 28, 40 d.p.i. by ELISA for recognition of PR8, Δ4 HAs. S12 AUC were considered baseline and subtracted from PR8 and Δ4 values. Graph represents mean and bars SEM of two independent experiments with 5 mice each. (d) Bar graph showing cumulative serum Abs response. After S12 AUC subtraction, the sum of the response to the 5 antigenic sites is close to equal to the PR8 response. Columns represent means and SEM (bars). (e) Scatter plot showing the correlation between ELISA recognition of the different HAs (as in c) and frequency of GC B cells (as in b). P<0.0001 r=0.8814. Circles represent 14 d p.i., squares 21 d p.i. and triangles 28 d p.i.. Dashed lines represent 95% confidence intervals.
Figure 3
Figure 3. Intraperitoneal and intramuscular immunizations elicit similar Ab immunodominance patterns distinct from infection
We immunized mice i.m with 6µg of UV-inactivated virus with Titermax adjuvant (a) or i.p. with 2500HAU of UV-inactivated-PR8 (b). We assayed serum collected 14 and 28 d p.i by ELISA for recognition of PR8 and Δ4 HAs. S12 AUC were considered baseline and subtracted from PR8 and Δ4 values. Graph represents mean and SEM (bars) of two independent experiments with 3 (a) or 4 mice (b) each. (c) Scatter plot shows correlation between the frequency of splenic GC B cells and ELISA recognition of the different HAs (as in b). Shown is the average from three independent experiments where three spleens were pooled. P=0.0021 r=0.7926. Circles are 14dpi, and triangles 28dpi. Dashed lines represent 95% confidence intervals.
Figure 4
Figure 4. CD4+ T cells positively modulate the magnitude and duration of Ab responses but not their immunodominance
We depleted CD4+ T cells by injecting GK1.5 mAb i.p. one d before infection/immunization, and subsequently every third day. We challenged mice by i.n. infection with 50 TCID50 of PR8 or i.p. injection with 2500 HAU of UV-inactivated-PR8. (a) We collected serum 14 and 28 d p.i. and tested by ELISA for recognition of PR8, Δ4 and S12 HAs. S12 AUCs were considered baseline and subtracted from PR8 and Δ4 values. Columns represent mean and SEM (bars). Two independent experiment of 5 mice each. (b, c) Scatter plot shows correlation between serum ELISA recognition of the different HAs in regular mice (as in Fig. 2c and 3b) versus CD4-depleted mice. P=0.0039 r=0.7623. Circles represent 14 d p.i., and triangles 28 d p.i.. Dashed lines represent 95% confidence intervals.
Figure 5
Figure 5. Ab immunodominance varies between mouse strains
We infected BALB/c mice i.n. with 50 TCID50 PR8 (a) or injected i.p. with 2500HAU of UV-inactivated-PR8 (b). We collected serum at 14 and 28 d p.i. and tested by ELISA for recognition of PR8, Δ4 HAs. S12 AUCs were considered baseline and subtracted from PR8 and Δ4 values Graph represents mean and SEM (bars) of two independent experiments with 4 (a) or 3 (b) mice each. (c) Scatter plot showing the correlation between ELISA recognition of the different HAs in C57BL/6 (as in Fig. 2c) and BALB/c mice (as in a) upon i.n. infection. P=0.0001 r=0.9027. (d) Scatter plot showing the correlation between ELISA recognition of the different HAs in C57BL/6 (as in Fig. 3b) and BALB/c mice (as in b) upon i.p. immunization. P=0.0002 r=0.8684. Circles represent 14 d p.i., and triangles 28 d p.i.. Dashed lines represent 95% confidence intervals.
Figure 6
Figure 6. Abs directed to different antigenic sites exhibit distinct functionalities
We infected mice i.n. with 50 TCID50 of either PR8, Δ4 virus or S12, and collected sera and MLN 21 d.p.i. for HI (a) and MN (b). Data are presented as a ratio between the HI or MN endpoint titer and the ELISA reactivity towards PR8 HA (not shown). Higher values represent higher serum efficacy. Line represent mean and SEM (bars). One-way ANOVA with post-hoc Tukey’s multiple comparison (p=0.0002 for a and p=0.012 for b) (n=4 for PR8, Sa, Ca1, Ca2; n=5 for Cb and n=8 for Sb) * p<0.05, **p<0.01, ***p<0.001, ****p<0.0001. (c) Titration curves of MLN GC B cells to rHAPR8 following i.n. infection with Δ4 viruses. rHA concentration (nM) necessary to reach 50% of the maximal binding was calculated for each titration curve (d). Line represent mean and SEM (bars). Data are from two independent experiments with pooled MLN from 5 mice each.
Figure 7
Figure 7. Pre-existing Abs influence immunodominance of recall responses
We immunized mice were i.p. with 2500HAU of UV-inactivated-PR8 premixed with Fabs from H28-E23, a Sb-site mAb. (a) We collected serum 1 d.p.i to assess the baseline Ab level and subsequently at 14 and 28 d.p.i and tested by ELISA for recognition of PR8, Δ4 and S12 -HAs. Presented are results after d 1 baseline Ab subtraction. S12 AUCs were considered baseline and subtracted from PR8 and Δ4 values. Columns represent mean and SEM (bars). Results are three technical replicates from five individual mice for each time point. (b) Scatter plot shows correlation between serum ELISA recognition of the different HAs after i.p. (as in Fig. 3b) versus virus+Fab i.p.. Aside from PR8 and Sb-specific responses, the general immunodominance pattern is maintained. P=0.0036 r=0.8684 are calculated excluding the Sb points. Circles represent 14 d p.i., and triangles 28 d p.i.. Dashed lines represent 95% confidence intervals. (c) We infected mice i.n. with 50 TCID50 Δ4Sb or Δ4Cb virus and challenged at 28 d.p.i. i.p. with 2000 HAU of PR8. We collected sera 7 d post challenge and tested by ELISA for recognition of PR8, Δ4 and S12 HAs. Shown is the AUC after subtracting the 28 d p.i. response. Arrows indicate the site corresponding to the primary virus. Data on graph represent mean and SEM (bars) of two independent experiments with 3 mice each.

Comment in

References

    1. Yewdell JW. Confronting complexity: real-world immunodominance in antiviral CD8+ T cell responses. Immunity. 2006;25:533–543. - PubMed
    1. Krammer F, Palese P. Advances in the development of influenza virus vaccines. Nat Rev Drug Discov. 2015;14:167–182. - PubMed
    1. Burton DR, Poignard P, Stanfield RL, Wilson IA. Broadly neutralizing antibodies present new prospects to counter highly antigenically diverse viruses. Science. 2012;337:183–186. - PMC - PubMed
    1. Wheatley AK, Kent SJ. Prospects for antibody-based universal influenza vaccines in the context of widespread pre-existing immunity. Expert Rev Vaccines. 2015;14:1227–1239. - PubMed
    1. Victora GD, Wilson PC. Germinal Center Selection and the Antibody Response to Influenza. Cell. 2015;163:545–548. - PMC - PubMed

METHODS ONLY REFERENCES

    1. Yewdell JW, Gerhard W. Antigenic characterization of viruses by monoclonal antibodies. Annual Review of Microbiology. 1981;35:185–206. - PubMed
    1. Pieri L, Sassoli C, Romagnoli P, Domenici L. Use of periodate-lysine-paraformaldehyde for the fixation of multiple antigens in human skin biopsies. Eur J Histochem. 2002;46:365–375. - PubMed

Publication types

MeSH terms

Substances