. 2017 Mar;19(3):177-188.
doi: 10.1038/ncb3474. Epub 2017 Feb 13.

G1 cyclins link proliferation, pluripotency and differentiation of embryonic stem cells

Affiliations

G1 cyclins link proliferation, pluripotency and differentiation of embryonic stem cells

Lijun Liu et al. Nat Cell Biol. 2017 Mar.

Abstract

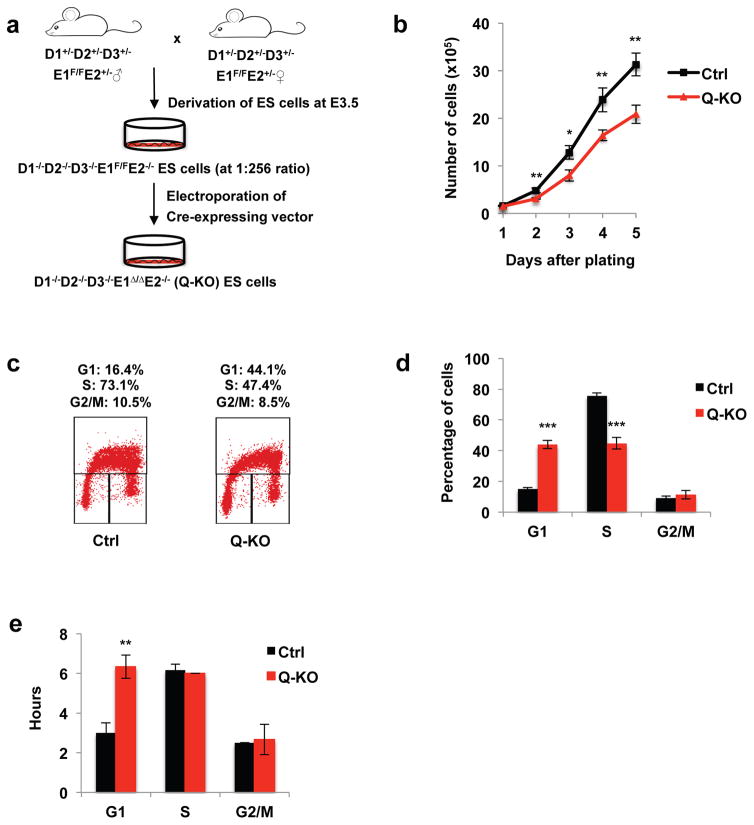
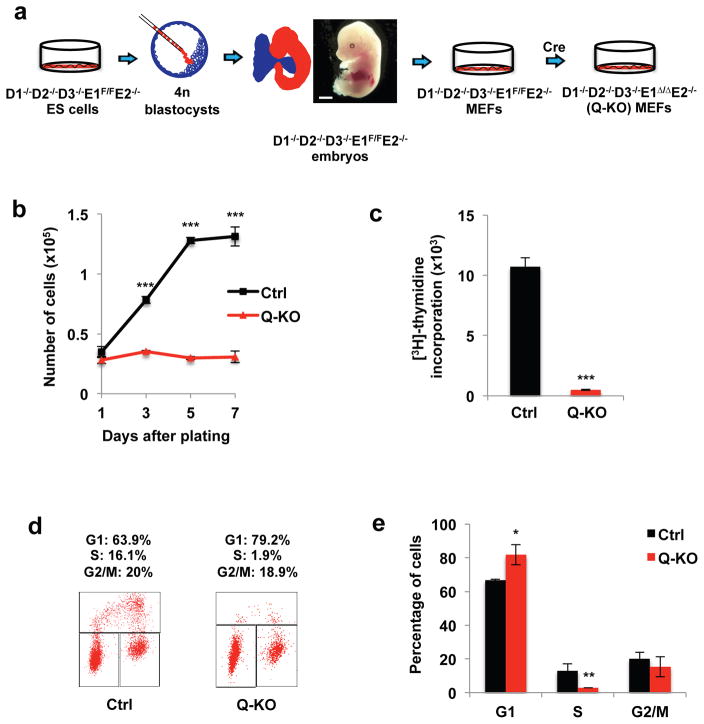
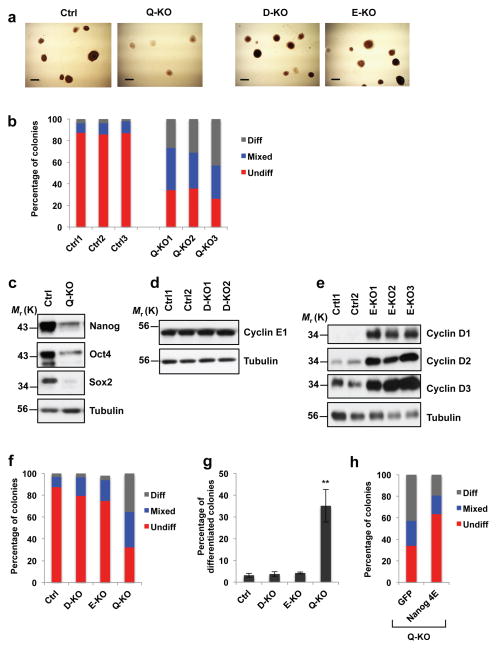
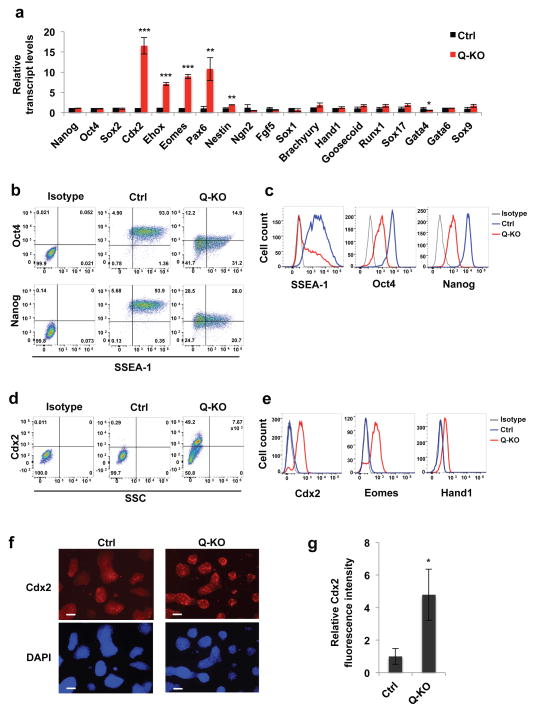
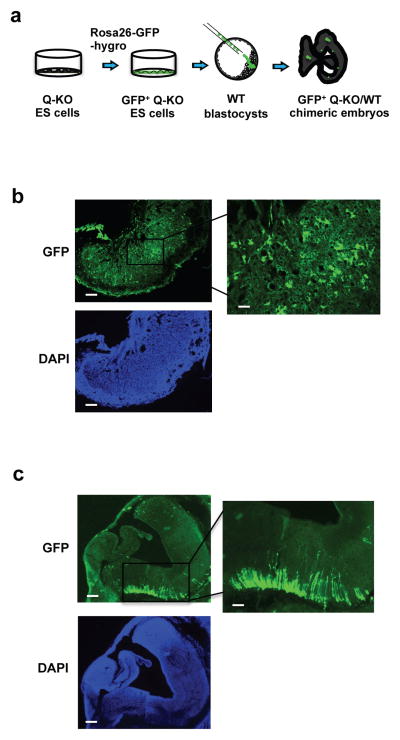
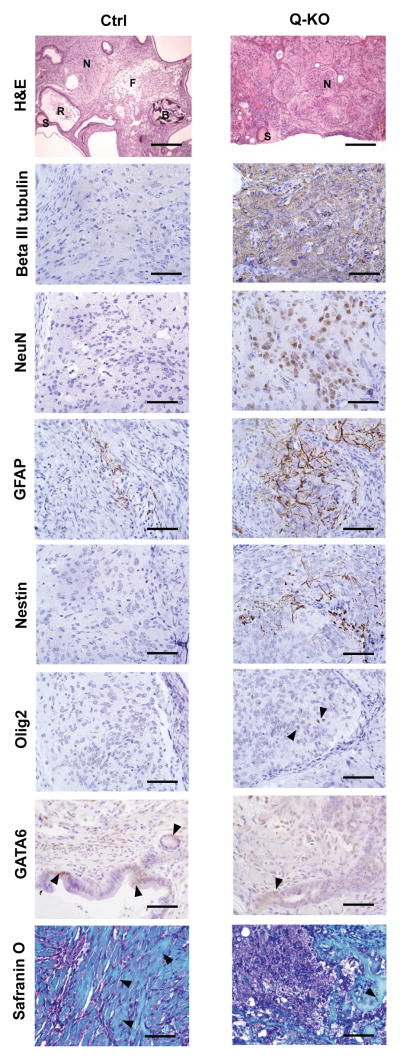
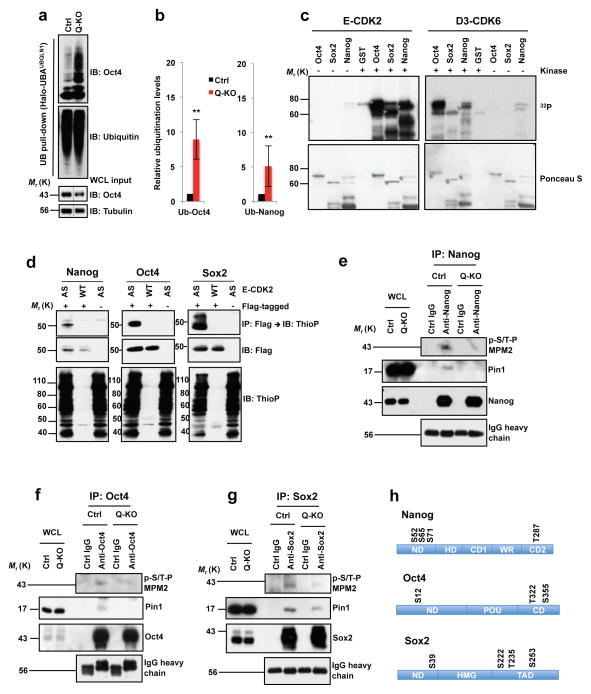
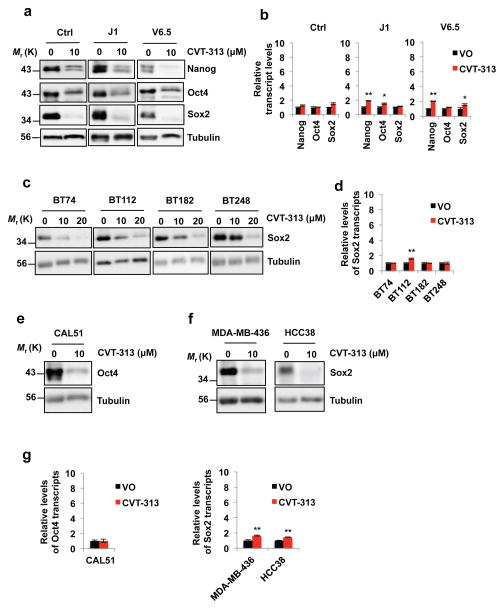
Progression of mammalian cells through the G1 and S phases of the cell cycle is driven by the D-type and E-type cyclins. According to the current models, at least one of these cyclin families must be present to allow cell proliferation. Here, we show that several cell types can proliferate in the absence of all G1 cyclins. However, following ablation of G1 cyclins, embryonic stem (ES) cells attenuated their pluripotent characteristics, with the majority of cells acquiring the trophectodermal cell fate. We established that G1 cyclins, together with their associated cyclin-dependent kinases (CDKs), phosphorylate and stabilize the core pluripotency factors Nanog, Sox2 and Oct4. Treatment of murine ES cells, patient-derived glioblastoma tumour-initiating cells, or triple-negative breast cancer cells with a CDK inhibitor strongly decreased Sox2 and Oct4 levels. Our findings suggest that CDK inhibition might represent an attractive therapeutic strategy by targeting glioblastoma tumour-initiating cells, which depend on Sox2 to maintain their tumorigenic potential.


Figures

Figure 1
Figure 1. Generation and cell cycle analyses of ES cells lacking all G1 cyclins
a, A strategy to generate cyclin D1−/−D2−/−D3−/−E1Δ/Δ E2−/− (Q-KO) ES cells. b, Growth curves of control (Ctrl) and Q-KO ES cells during in vitro culture, mean ± standard deviation (s.d.) of n=3 independent experiments. P=0.274, 0.004, 0.01, 0.009, 0.004. c, Cell cycle distribution of control (Ctrl) and Q-KO ES cells. Cells were pulsed with BrdU, stained with an anti-BrdU antibody and propidium iodide and analyzed by flow cytometry. The percentages of cells in the indicated cell cycle phases are shown, representative of n=4 independent experiments. d, Quantification of flow cytometric analyses performed as in c, mean ± s.d. of n=4 independent experiments. P<0.001, <0.001, =0.265. e, The mean length of G1, S and G2/M phases of the cell cycle in Ctrl and Q-KO ES cells. Cells were pulsed with BrdU, and progression of BrdU+ cells through the cell cycle was monitored over time by propidium iodide staining of BrdU+ cells at different time-points. Shown are mean ± s.d. of n=3 independent experiments. P=0.002, 0.374, 0.725. Two-tailed t-tests were used (*, p < 0.05; **, p < 0.01; ***, p < 0.001). Source data for b, d and e can be found in Supplementary Table 5.
Figure 2
Figure 2. Generation and analyses of Q-KO MEFs
a, Strategy to obtain Q-KO mouse embryonic fibroblasts (MEFs). Note normal appearance of a cyclin D1−/−D2−/−D3−/−E1F/FE2−/− embryo (representative of n=15 embryos), harvested at day 13.5 of gestation. Scale bar, 500 μm. b, Growth curves of Ctrl and Q-KO MEFs during in vitro culture, mean ± s.d. of n=3 independent experiments. P=0.093, <0.001, <0.001, <0.001. c, Ctrl and Q-KO MEFs were cultured in the presence of [3H]-thymidine, and incorporation into cells was determined by scintillation counting, mean ± s.d. of n=3 independent experiments. P<0.001. d, Cell cycle distribution of control (Ctrl) and Q-KO MEFs. Cells were pulsed with BrdU, stained with an anti-BrdU antibody and propidium iodide and analyzed by flow cytometry. The percentages of cells in the indicated cell cycle phases are shown representative of 3 independent experiments. e, Quantification of flow cytometric analyses performed as in d, mean ± s.d. of n=3 independent experiments. P=0.027, 0.016, 0.614. Two-tailed t-tests were used (*, p < 0.05; **, p < 0.01; ***, p < 0.001). Source data for b, c and e can be found in Supplementary Table 5.
Figure 3
Figure 3. Attenuation of ES cell pluripotency upon ablation of G1 cyclins
a, Alkaline phosphatase (AP) staining of Ctrl, D1−/−D2−/−D3−/−E1Δ/Δ E2−/− (Q-KO), D1−/−D2−/−D3−/− (D-KO) and E1Δ/Δ E2−/− (E-KO) ES cell colonies. Cells were analyzed 5 days after plating, representative of 5 independent experiments Scale bar, 250 μm. b, Bars show mean percentages of differentiated (Diff) AP-negative, mixed (some cells AP-positive, some -negative) and undifferentiated (Undiff) uniformly AP-positive ES cell colonies, 3 independent lines. c, Immunoblot analysis of Nanog, Oct4 and Sox2 protein levels in Ctrl and Q-KO ES cells, representative of 4 independent experiments. d, Immunoblot analysis of cyclin E1 protein levels in two independent lines of control (Ctrl1 and Ctrl2) and cyclin D-KO (D-KO1 and D-KO2) ES cells, representative of 3 independent experiments. e, Immunoblot analysis of the levels of D-type cyclins in independent lines of control (Ctrl1 and Ctrl2) and cyclin E-KO ES cells (E-KO1, E-KO2, and E-KO3), representative of 3 independent experiments. In ce tubulin served as a loading control. f, Same analysis as in b, showing mean percentages of differentiated, mixed and undifferentiated colonies, 3 independent lines. g, Mean percentages of differentiated (AP-negative) colonies in ES cells of the indicated genotypes, mean ± s.d. of n=3 independent experiments. P=0.388, 0.056, 0.002. Two-tailed t-tests were used (**, p < 0.01). h, Q-KO ES cells were transduced with lentiviruses encoding GFP, or encoding a Nanog mutant containing phospho-mimicking glutamic acid substitutions in all four cyclin E-CDK2-dependent phosphoresidues (Nanog 4E), and colonies were stained with alkaline phosphatase. Bars show mean percentages of differentiated (Diff), mixed, and undifferentiated (Undiff) colonies (as in b), 3 independent lines. Source data for b, f, g and h can be found in Supplementary Table 5. Unprocessed original scans of blots are shown in Supplementary Fig. 9.
Figure 4
Figure 4. Analyses of differentiation markers in Q-KO ES cells
a, Relative expression levels of the indicated transcripts in Ctrl and Q-KO ES cells, determined by reverse-transcription quantitative PCR. Shown are mean values ± s.d. of n=3 independent experiments. P=0.485, 0.612, 0.56, <0.001, <0.001, <0.001, =0.004, 0.001, 0.22, 0.091, 0.113, 0.06, 0.138, 0.061, 0.058, 0.145, 0.013, 0.142, 0.057. Mean expression levels observed in Ctrl ES cells were set as 1. b, c, Ctrl and Q-KO ES cells were permeabilized, stained with antibodies against SSEA-1, Oct4 or Nanog, and analyzed by flow cytometry. Panel c shows distribution of staining intensities. Isotype, isotype-specific IgG control. The mean percentages of SSEA-1+ cells for Ctrl and Q-KO cells were 95.4 ± 2.7 and 49.4 ± 6.5 (± s.d.), respectively, p < 0.001; for Oct4+ cells 94.7 ± 1.2 and 35.7 ± 9.7, respectively, p = 0.0025; and for Nanog+ cells 96.1 ± 2.8 and 44.3 ± 11.0, respectively, p < 0.001 (two-tailed t-test). d, e, Cells were permeabilized, stained with antibodies against Cdx2, Eomes or Hand1, and analyzed by flow cytometry. SSC, side scatter. Isotype, isotype-specific IgG control. Panel e shows distribution of staining intensities. The mean percentages of Cdx2+ cells were 1.3 ± 1.0 for control cells and 47.2 ± 14.1 for Q-KO cells (± s.d.), p < 0.0016 (two-tailed t-test). f, Immunostaining of Ctrl and Q-KO ES cell colonies for Cdx2 protein. Lower panels represent DAPI staining (to visualize cells). Scale bar, 100 μm. g, Quantification of immunofluorescence staining of Ctrl and Q-KO ES cell colonies for Cdx2, mean ± s.d. of n=3 independent experiments. P=0.016. Two-tailed t-tests were used (*, p < 0.05; **, p < 0.01; ***, p < 0.001). Shown in b–f are representatives of n=3 independent experiments Source data for a and g can be found in Supplementary Table 5.
Figure 5
Figure 5. Contribution of Q-KO ES cells to the developing embryo
a, Strategy used to gauge the contribution of Q-KO (GFP+) ES cells to different compartments of the developing embryos. b, Strong contribution of Q-KO (GFP+) ES cells to the embryonic part of placenta. Shown is a section of a placenta from a chimeric embryo, stained for GFP. Scale bar, 100 μm. Right panel shows higher magnification of the boxed area, scale bar, 400 μm. Lower panel represents DAPI staining (to visualize cells). c, A section of embryonic brain from a chimeric embryo stained for GFP. Scale bar, 100 μm. Right panel shows higher magnification of the boxed area, scale bar, 400 μm. Lower panel represents DAPI staining. Three Q-KO and one Ctrl GFP+ ES cell lines were injected, 10 Q-KO and 3 Ctrl embryos were analyzed. The imagines are representative of 10 Q-KO chimeric embryos.
Figure 6
Figure 6. Analyses of teratomas
Analyses of teratomas. Ctrl and Q-KO ES cells were injected subcutaneously into nude mice. Teratomas were collected and sections were stained with haematoxylin and eosin (H&E), or analysed by immunohistochemistry with antibodies against beta III tubulin (a marker of immature postmitotic neuronal precursors), NeuN (a marker of mature neurons), GFAP (astrocytes), nestin (neural stem cells), Olig2 (oligodendrocytes), GATA6 (endoderm), or stained with Safranin O (to highlight mesoderm-derived skeletal muscle, cartilage and bone). Arrowheads point to Olig2- and GATA6- positive cells, and in the Safranin O panel to mesoderm-derived muscle (Ctrl) and bone (Q-KO). S, squamous epithelium; R, respiratory epithelium; N, neural tissue; F, fat; B, bone. Scale bars, 250 μM in (H&E panel) and 50 μM (all other panels). 12 Ctrl and 12 Q-KO teratomas (derived from 3 independent ES cell lines per genotype) were analysed by histology; sections from 2 teratomas per genotype were used for immunohistochemical confirmation of the identity of the lineages.
Figure 7
Figure 7. Regulation of Nanog, Oct4 and Sox2 levels by G1 cyclins
a, Polyubiquitin affinity purification (UB pull-down), immunoblotted with Oct4 and ubiquitin antibodies. WCL input: Oct4 levels in whole cell lysates (WCL), prior to purification (same as lanes 2, 4 in Supplementary Fig. 4e; middle portion spliced out (dashed lines). b, Left panel: quantification of a, mean ± s.d. of n=4 independent experiments. P=0.001. Band intensities corresponding to polyubiquitinated Oct4 were normalized against Oct4 total levels in Ctrl or Q-KO lysates prior to purification. Ctrl ES cells value is set at 1. Right panel: similar analysis of Nanog polyubiquitination, mean ± s.d. of n=4 independent experiments. P=0.001. Two-tailed t-tests (**, p < 0.01). c, In vitro kinase reactions. Recombinant GST-Nanog, GST-Oct4, GST-Sox2, or GST incubated in presence (+) or absence (−) of E1-CDK2 or D3-CDK6 with 32PγATP. Lower panel: Ponceau S staining of membranes. Green stars mark full-length GST-Nanog, -Oct4 and -Sox2. d, In-cell kinase reactions. 293T cells transfected with cyclin E1 and analog-sensitive CDK2 (AS), or wild-type CDK2 (WT), and Flag-tagged Nanog, Oct4 or Sox2 (+Flag-tagged) or empty vectors (−), and incubated with N6-PhEt-ATPγS. Upper panels: Flag-tagged Nanog, Oct4 or Sox2 proteins were immunoprecipitated (IP) with anti-Flag, immunoblots probed (IB) with anti-thiophosphate ester (ThioP). Middle panels: anti-Flag. Lower panels: lysates immunoblotted with anti-ThioP. Control lanes 3 and 6 are the same. eg, ES cells were treated with MG132 to equalize Nanog, Oct4 and Sox2 levels in Ctrl and Q-KO cells. Endogenous Nanog, Oct4 or Sox2 proteins were immunoprecipitated (control: lysates treated with IgG), and immunoblotted with antibody against phosphorylated Ser/Thr-Pro (p-S/T-P MPM2, upper panel). Middle and third panels: anti-Pin1 and anti-Nanog/Oct4/Sox2. Bottom panel: IgG heavy chain control. Proteins levels in WCLs were analyzed. h, Cyclin E-CDK2-dependent phosphoresidues, mass spectrometric analysis. ND, N-terminal domain; HD, homeodomain; CD1, C-terminal domain 1; WR, tryptophan repeat; CD2, C-terminal domain 2; POU, POU-specific DNA-binding domain; CD, C-terminal domain; HMG, High mobility group DNA-binding domain; TAD, transactivation domain. Results representative of 3 (c–g) or 4 (a) independent experiments. Source data for c–e in Supplementary Table 5. Unprocessed blots in Supplementary Fig. 9.
Figure 8
Figure 8. Decreased levels of Nanog, Oct4 and Sox2 proteins upon treatment of ES cells and human cancer cells with a CDK Inhibitor CVT-313
a, In vitro cultured control ES cells derived from a mouse blastocyst of the mixed genetic background C57BL/6 × 129Sv (Ctrl), or wild-type J1 ES cells (from 129S4/SvJae strain), or wild-type V6.5 ES cells (from C57BL/6 × 129/Sv cross) were treated with vehicle only - DMSO (0) or with 10 μM CVT-313. The levels of Nanog, Oct4 and Sox2 proteins were assessed by immunoblotting. b, Reverse transcription-quantitative PCR (RT-qPCR) analysis of Nanog, Oct4 and Sox2 transcript levels, from ES cells treated with vehicle only (VO) or CVT-313, as in a, mean ± s.d. of n=3 independent experiments. P=0.053, 0.565, 0.550, 0.001, 0.020, 0.064, 0.002, 0.053, 0.016. c, Patient-derived glioblastoma cell lines were cultured as tumor-initiating cells in serum-free neural stem cell medium in the form of neurospheres. Cells were treated with the indicated concentrations of CVT-313 or vehicle only (0), and the levels of Sox2 protein were determined by immunoblotting. d, RT-qPCR analysis of Sox2 transcript levels, from glioblastoma cells treated with vehicle only (VO) or CVT-313, as in c, mean ± s.d. of n=3 independent experiments. P=0.627, 0.001, 0.962, 0.98. e and f, In vitro cultured human triple-negative breast cancer cell lines CAL51, MDA-MB-436 and HCC38 were treated with 10 μM CVT-313 or with vehicle only (0), and the levels of Oct4 (e), or Sox2 proteins (f) were determined by immunoblotting. g, RT-qPCR analysis of Oct4 or Sox2 transcript levels, from breast cancer cell lines treated with vehicle only (VO) or CVT-313, as in e and f, mean ± s.d. of n=3 independent experiments. P=0.928, 0.002, 0.001. In a, c, e, f, tubulin served as a loading control. Results are representative of n=3 independent experiments. Two-tailed t-tests were used (*, p < 0.05; **, p < 0.01). Source data for b, d and g can be found in Supplementary Table 5. Unprocessed original scans of blots are shown in Supplementary Fig. 9.

Comment in

  • G1 cyclins protect pluripotency.
    Arand J, Sage J. Arand J, et al. Nat Cell Biol. 2017 Mar 1;19(3):149-150. doi: 10.1038/ncb3480. Nat Cell Biol. 2017. PMID: 28248303 Free PMC article.

References

    1. Malumbres M. Cyclin-dependent kinases. Genome Biol. 2014;15:122. - PMC - PubMed
    1. Kozar K, et al. Mouse development and cell proliferation in the absence of D-cyclins. Cell. 2004;118:477–491. - PubMed
    1. Geng Y, et al. Cyclin E ablation in the mouse. Cell. 2003;114:431–443. - PubMed
    1. Parisi T, et al. Cyclins E1 and E2 are required for endoreplication in placental trophoblast giant cells. Embo J. 2003;22:4794–4803. - PMC - PubMed
    1. Martello G, et al. Esrrb is a pivotal target of the Gsk3/Tcf3 axis regulating embryonic stem cell self-renewal. Cell Stem Cell. 2012;11:491–504. - PMC - PubMed

Publication types

MeSH terms