. 2017 Feb 23;542(7642):479-483.
doi: 10.1038/nature21076. Epub 2017 Feb 13.

Metabolic gatekeeper function of B-lymphoid transcription factors

Affiliations

Metabolic gatekeeper function of B-lymphoid transcription factors

Lai N Chan et al. Nature. .

Erratum in

  • Author Correction: Metabolic gatekeeper function of B-lymphoid transcription factors.
    Chan LN, Chen Z, Braas D, Lee JW, Xiao G, Geng H, Cosgun KN, Hurtz C, Shojaee S, Cazzaniga V, Schjerven H, Ernst T, Hochhaus A, Kornblau SM, Konopleva M, Pufall MA, Cazzaniga G, Liu GJ, Milne TA, Koeffler HP, Ross TS, Sánchez-García I, Borkhardt A, Yamamoto KR, Dickins RA, Graeber TG, Müschen M. Chan LN, et al. Nature. 2018 Jun;558(7711):E5. doi: 10.1038/s41586-018-0164-5. Nature. 2018. PMID: 29849140

Abstract

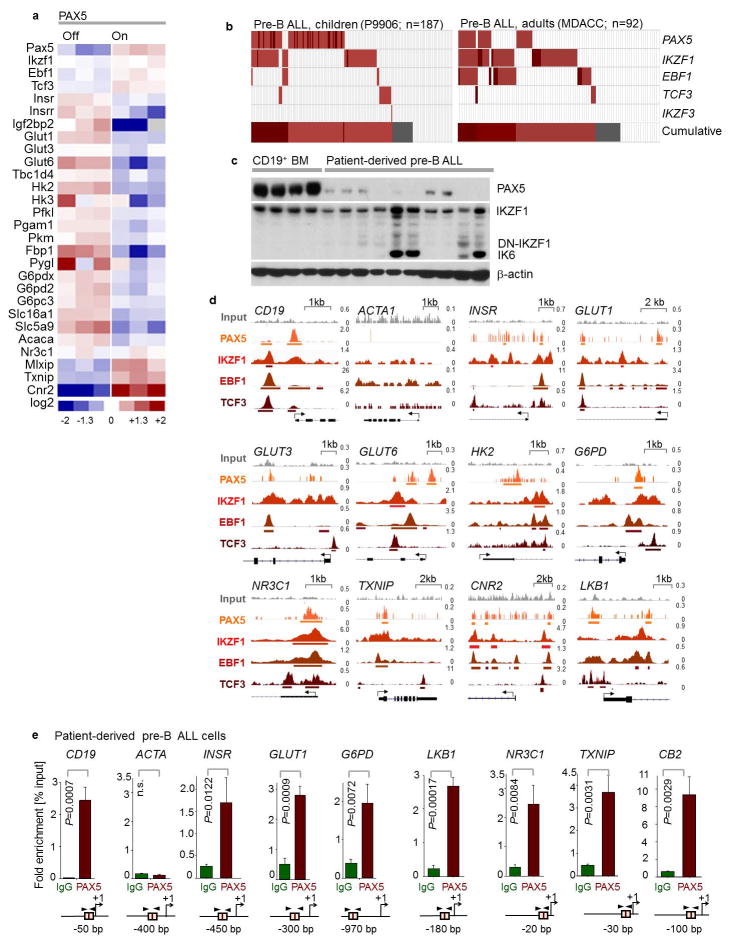
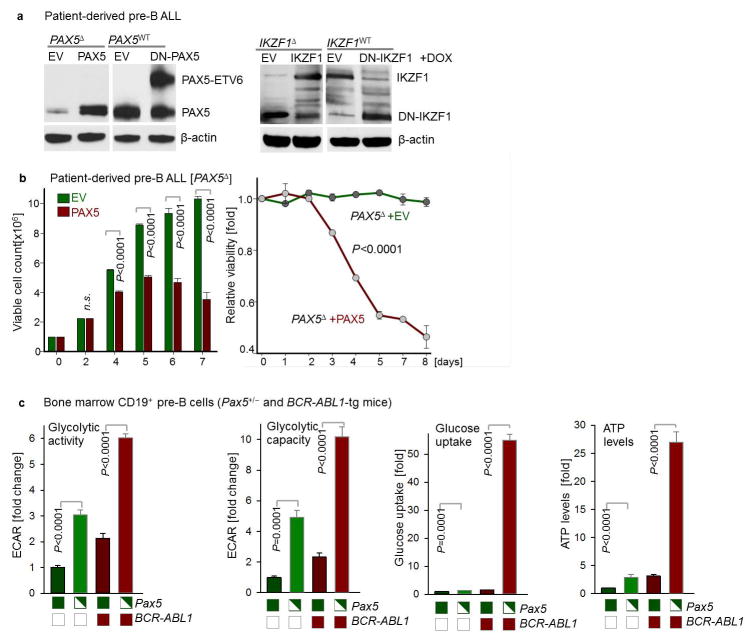
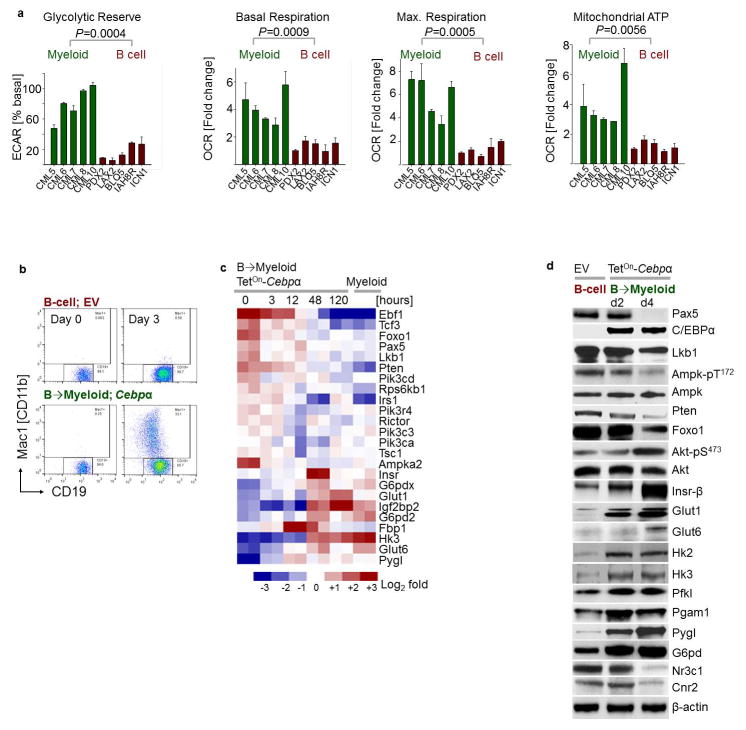
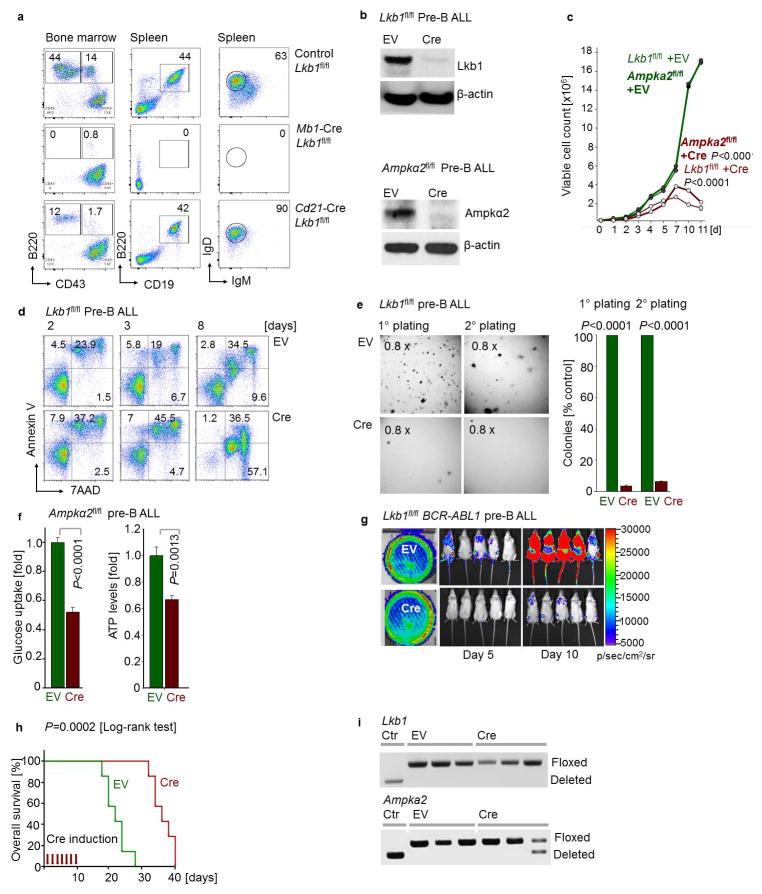
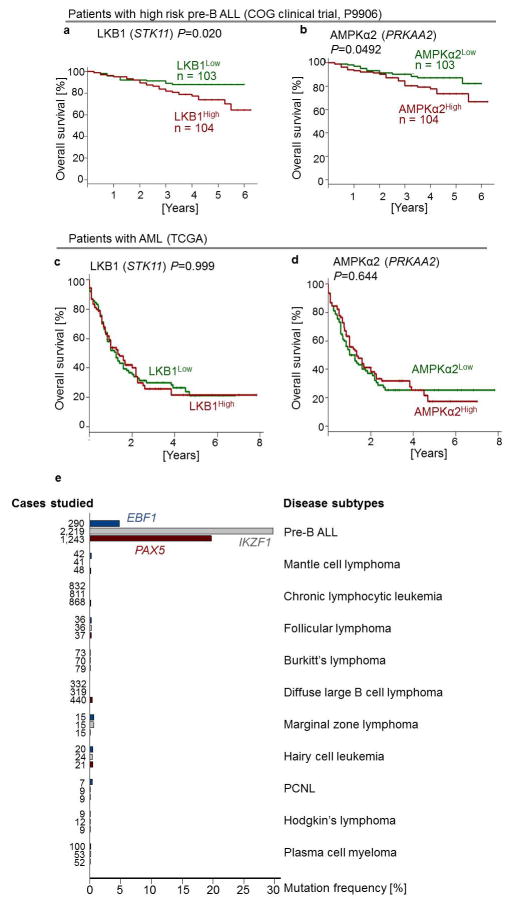
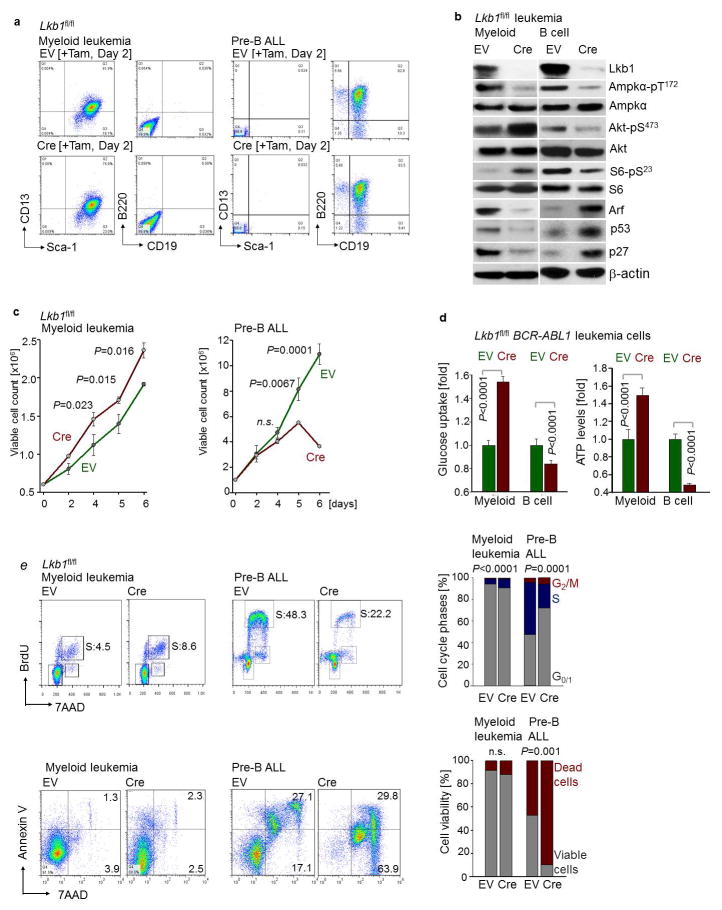
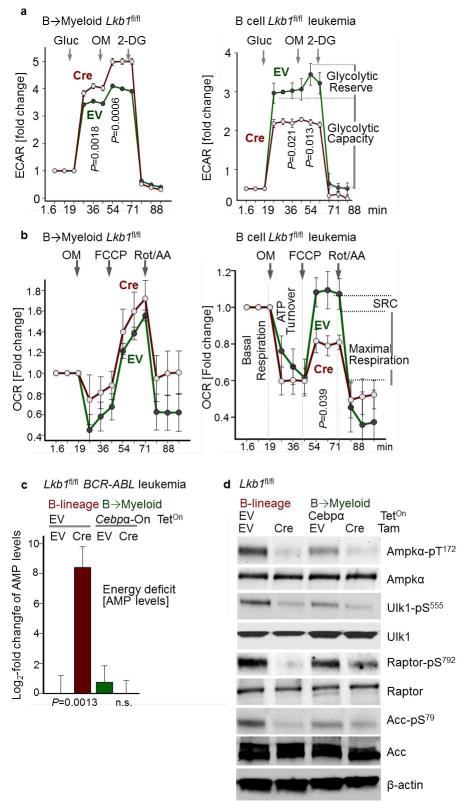
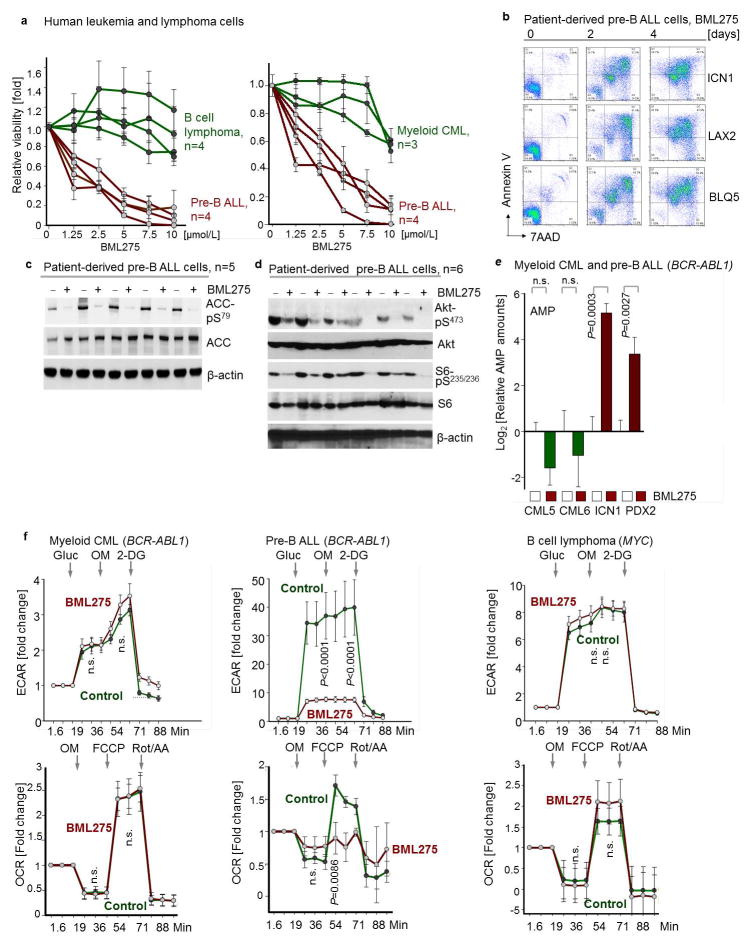
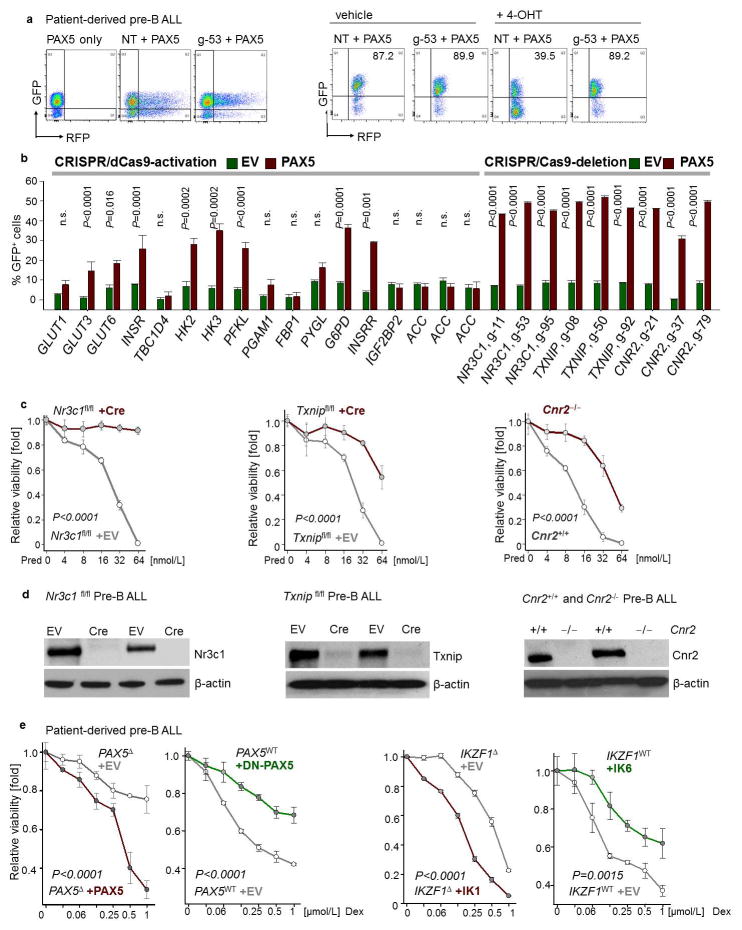
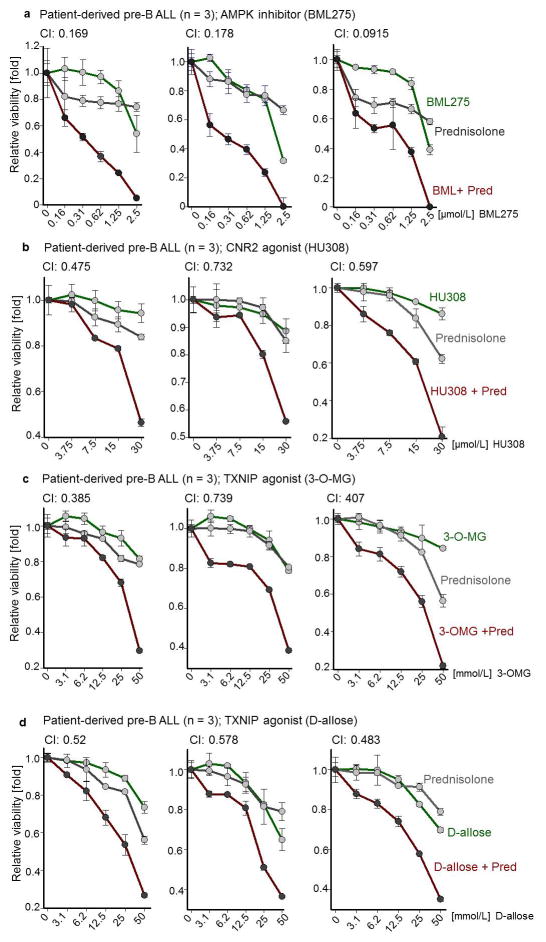
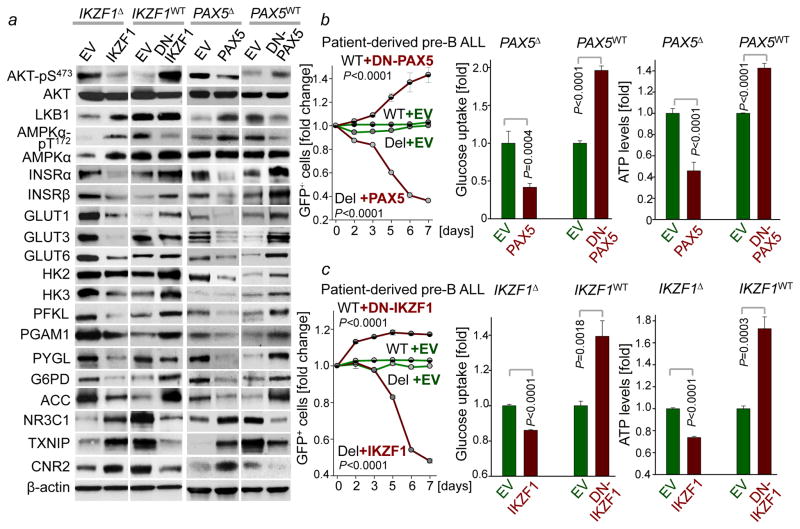
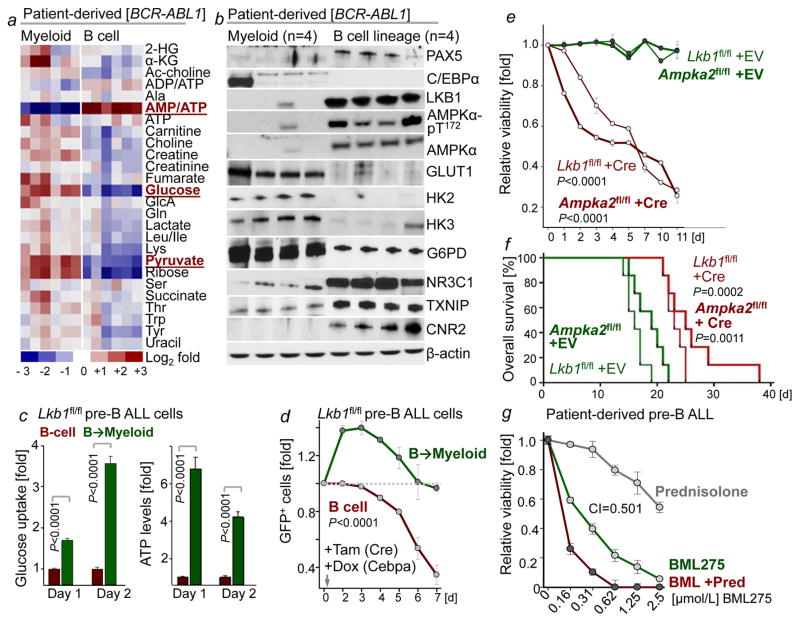
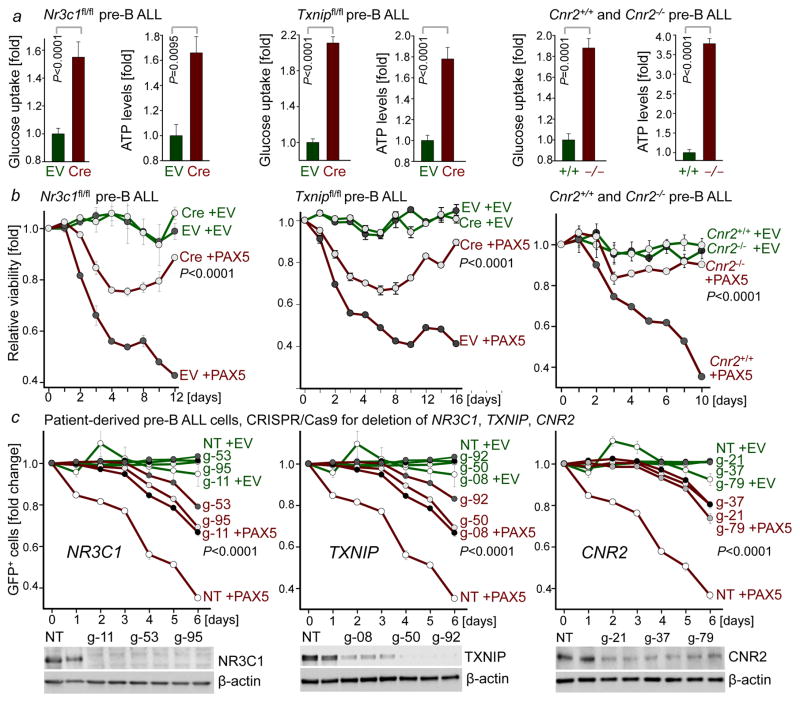
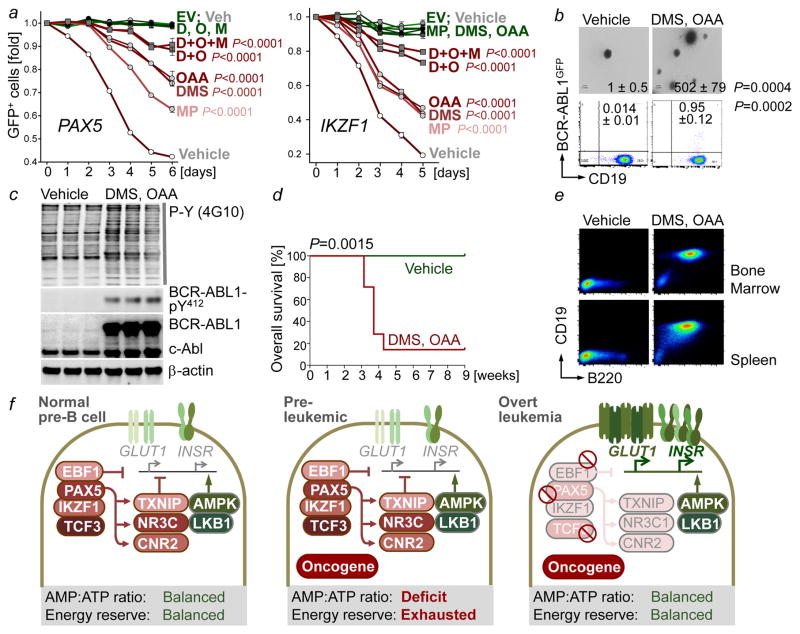
B-lymphoid transcription factors, such as PAX5 and IKZF1, are critical for early B-cell development, yet lesions of the genes encoding these transcription factors occur in over 80% of cases of pre-B-cell acute lymphoblastic leukaemia (ALL). The importance of these lesions in ALL has, until now, remained unclear. Here, by combining studies using chromatin immunoprecipitation with sequencing and RNA sequencing, we identify a novel B-lymphoid program for transcriptional repression of glucose and energy supply. Our metabolic analyses revealed that PAX5 and IKZF1 enforce a state of chronic energy deprivation, resulting in constitutive activation of the energy-stress sensor AMPK. Dominant-negative mutants of PAX5 and IKZF1, however, relieved this glucose and energy restriction. In a transgenic pre-B ALL mouse model, the heterozygous deletion of Pax5 increased glucose uptake and ATP levels by more than 25-fold. Reconstitution of PAX5 and IKZF1 in samples from patients with pre-B ALL restored a non-permissive state and induced energy crisis and cell death. A CRISPR/Cas9-based screen of PAX5 and IKZF1 transcriptional targets identified the products of NR3C1 (encoding the glucocorticoid receptor), TXNIP (encoding a glucose-feedback sensor) and CNR2 (encoding a cannabinoid receptor) as central effectors of B-lymphoid restriction of glucose and energy supply. Notably, transport-independent lipophilic methyl-conjugates of pyruvate and tricarboxylic acid cycle metabolites bypassed the gatekeeper function of PAX5 and IKZF1 and readily enabled leukaemic transformation. Conversely, pharmacological TXNIP and CNR2 agonists and a small-molecule AMPK inhibitor strongly synergized with glucocorticoids, identifying TXNIP, CNR2 and AMPK as potential therapeutic targets. Furthermore, our results provide a mechanistic explanation for the empirical finding that glucocorticoids are effective in the treatment of B-lymphoid but not myeloid malignancies. Thus, B-lymphoid transcription factors function as metabolic gatekeepers by limiting the amount of cellular ATP to levels that are insufficient for malignant transformation.


Conflict of interest statement

The authors declare no competing financial interests.

Figures

Extended Data Figure 1
Extended Data Figure 1. Frequent genetic lesions of B-lymphoid transcription factors in B cell lineage leukemia
a, Gene expression of B-lymphoid transcription factors (top) as well as positive (middle) and negative (bottom) regulators of glucose uptake and energy supply upon inducible restoration of Pax5 (GSE52870) in haploinsufficient pre-B leukemia cells. b, Lesions in PAX5, IKZF1, EBF1 and TCF3 were studied in clinical trials for B-lymphoid ALL in children (P9906; n = 187; top) and adults (MDACC; n = 92; bottom). Red and gray boxes denote patient samples with detected lesions. c, Protein expression of PAX5 and IKZF1 was examined by Western blot in 10 patient-derived pre-B ALL samples (control: CD19+ B cells from 4 healthy donors). d, ChIP-seq analysis for binding of B-lymphoid transcription factors in human B cells (ENCODE GM12878) to promoter regions of molecules implicated in positive (INSR, GLUT1, GLUT3, GLUT6, HK2, G6PD, LKB1) and negative (NR3C1, TXNIP, CNR2) regulation of glucose uptake and utilization. e, Recruitment of PAX5 was confirmed by qChIP in patient-derived pre-B ALL cells. Data shown as mean from 3 independent experiments (± s.d.) and assessed by two-tailed t-test. For gel source data, see Supplementary Fig. 1.
Extended Data Figure 2
Extended Data Figure 2. B-lymphoid transcription factor PAX5 functions as a metabolic gatekeeper
a, Protein levels of PAX5 and IKZF1 in haploinsufficient patient-derived pre-B ALL cells and pre-B ALL cells expressing functional PAX5 and IKZF1. b, Number of viable cells and cell viability upon inducible activation of PAX5 in haploinsufficient patient-derived pre-B ALL (PAX5Δ) cells. c, To test whether Pax5 functions as metabolic gatekeeper, BCR-ABL1-induced changes in glycolytic activity and capacity (ECAR), glucose uptake, and ATP levels (normalized to cell numbers) were studied in Pax5 wildtype and Pax5 haploinsufficient pre-B cells in the presence or absence of a BCR-ABL1-transgene. Data shown as mean from 3 independent experiments (± s.d.) and assessed by two-tailed t-test (b, left; c) or two-way ANOVA (b, right). For gel source data, see Supplementary Fig. 1.
Extended Data Figure 3
Extended Data Figure 3. Divergent metabolic characteristics of myeloid and B-lineage leukemia
a, Glycolytic reserve (ECAR) and mitochondrial functions (OCR) in patient-derived myeloid (CML) and B-lymphoid (Ph+ ALL) leukemia samples (n = 5, each in triplicate). Values were normalized to total protein and are shown as mean ± s.d., assessed by two-tailed t-test. b, Murine pre-B ALL cells were reprogrammed into myeloid differentiation using a Dox-inducible TetOn-Cebpa vector system, and characterized by flow cytometry (representative results from 3 independent experiments). c, Heatmap of gene expression of glucose uptake and metabolism regulators (GSE32330). d, Western blots of murine pre-B ALL cells upon B → myeloid reprogramming to verify gene expression changes. For gel source data, see Supplementary Fig. 1.
Extended Data Figure 4
Extended Data Figure 4. The energy stress sensor LKB1-AMPK plays a pro-survival role and modulates glucose uptake and energy supply in pre-B ALL
a, Lkb1fl/fl mice were crossed with Cre deleter strains for deletion at early pre-B cell stages (Mb1) and in fully mature B cells (Cd21). B cell populations in bone marrow and spleen (n = 3 litter mates) were characterized by flow cytometry analysis. b, The catalytic subunit of AMPK has two isoforms – α1 and α2. Analysis of published gene expression data (GSE38463)39 revealed that expression of the α1-form peaks at later stages of B cell development, whereas expression levels of both Lkb1 and the α2-form of Ampk peak in pre-B cells. For this reason, we studied here the consequences of inducible ablation of Lkb1 and Ampkα2 in murine models for BCR-ABL1-transformed pre-B ALL cells. Protein levels of Lkb1 and Ampkα2 were verified by Western blots. c, Viable cell counts upon Cre-mediated deletion of Lkb1 or Ampkα2. d, Apoptosis following Lkb1 deletion was monitored by Annexin V/7AAD staining. e, Colony forming ability was assessed by serial replating upon deletion of Lkb1 in pre-B ALL cells. f, Glucose uptake and ATP levels (normalized to cell numbers) were measured following Cre-mediated deletion of Ampka2. g, Luciferase bioimaging of transplant recipient mice injected with Lkb1fl/fl pre-B ALL cells transduced with 4-OHT-inducible Cre or EV and treated with Tam (0.4 mg/mouse; n = 7 per group). h, Overall survival was assessed by a Kaplan-Meier analysis (P-value calculated by Mantel-Cox log-rank test). i, Leukemia samples developed in recipient mice (Fig. 2d) were genotyped for the presence of either floxed or deleted Lkb1 and Ampka2 alleles (n = 3 mice). Representative FACS plots and images from 3 independent experiments are shown (a, d, e). Data shown as mean from 3 independent experiments (± s.d.) and assessed by two-way ANOVA (c) or two-tailed t-test (e, f). For gel source data, see Supplementary Fig. 1.
Extended Data Figure 5
Extended Data Figure 5. LKB1 and AMPK are independent predictors of poor clinical outcome for patients with pre-B ALL
a, b, Children with high risk pre-B ALL (COG clinical trial, P9906, n = 207) were divided into 2 groups based on higher or lower than the median mRNA levels of LKB1 (a) or AMPKα2 (b). c, d, Adults with acute myeloid leukemia (AML; the Cancer Genome Atlas, n = 184) were divided into 2 groups based on higher or lower than the median mRNA levels of LKB1 (c) or AMPKα2 (d). Overall survival of patients was assessed in the two groups by Kaplan-Meier analysis. Log rank test was used to assess statistical significance (a–d). e, Frequencies of somatic mutations in the coding regions of EBF1 (top, blue), IKZF1 (middle, gray) and PAX5 (bottom, red) from the Catalog of Somatic Mutations in Cancer (COSMIC) database are plotted for pre-B ALL and various subtypes of mature B cell lymphoma. Somatic mutations in 5′UTR regions of EBF1, IKZF1 and PAX5 frequently represent byproducts of somatic hypermutation during normal B cell development and are not included in this analysis. PCNL, primary central nervous system lymphoma.
Extended Data Figure 6
Extended Data Figure 6. Divergent functions of Lkb1 in BCR-ABL1-driven pre-B ALL and myeloid leukemia
a, Staining of Lkb1fl/fl BCR-ABL1 myeloid (CML-like) and B-lineage (Ph+ ALL-like) leukemia cells with (Cre) or without (EV) deletion of Lkb1 for surface markers CD19, B220 (B-lymphoid), Sca-1 and CD13 (myeloid). b, Phosphorylation of AMPKα-T172, AKT-S473 and S6-S235 and protein levels of cell cycle checkpoint molecules Arf, p53 and p27 following Lkb1-deletion. c, Viable cell counts upon deletion of Lkb1. d, Glucose uptake and ATP levels (normalized to cell numbers) in myeloid and B-lymphoid leukemia cells upon Lkb1-deletion (n = 6). Shown as mean ± s.d. e, Cell cycle analyses were performed by measuring BrdU incorporation in combination with 7AAD staining. Percentages of cells in the G0/1, S, and G2/M phases are shown. Viability following Lkb1 deletion was monitored by Annexin V/7AAD staining. Representative FACS plots from 3 independent experiments are shown (a, e). Data shown as mean (± s.d.) from 3 independent experiments (c, e). Significance assessed by two-tailed t-test (c, d, e). For gel source data, see Supplementary Fig. 1.
Extended Data Figure 7
Extended Data Figure 7. Activity of the energy-stress sensor LKB1 represents a specific vulnerability of B-lymphoid leukemia
a, b, Glycolytic profiles (ECAR; a) and mitochondrial functions (OCR; b) upon Lkb1-deletion in B-lymphoid leukemia cells with (left) or without (right) B→myeloid reprogramming. Values were normalized to total protein (n = 6). c, AMP levels in sorted B-lymphoid and B→myeloid reprogrammed cells are shown as log2-transformed relative amounts (amount in Lkb1-deleted cells/average amount in control), and data was baseline-centered (baseline = average amount in control; n = 3). d, Phosphorylation of Ampkα-T172, Ulk-S555, Raptor-S792 and Acc-S79 was assessed by Western blots. Data shown as mean (± s.d.) and assessed by two-tailed t-test (a–c). For gel source data, see Supplementary Fig. 1.
Extended Data Figure 8
Extended Data Figure 8. Small molecule inhibition of AMPK in human pre-B ALL
a, Human leukemia and lymphoma cells (n = 4 biological replicates for B cell lymphoma and pre-B ALL; n = 3 biological replicates for CML; each in triplicate) were treated with BML275 (72 hr), and relative viability was assessed. b, Apoptosis was examined by Annexin V/7AAD staining in patient-derived pre-B ALL samples (n = 3) upon treatment with BML275 (10 μmol/L). c, Phospho-ACC-S79 in patient-derived pre-B ALL samples (n = 5) following overnight treatment with control (−) or BML275 (+, 10 μmol/L) was assessed. d, Phosphorylation of S6-S235/236 and Akt-S473 in patient-derived pre-B ALL samples (n = 6) following overnight treatment with control (−) or BML275 (+, 10 μmol/L) was assessed. e, Levels of AMP (normalized to cell numbers) in patient-derived CML (CML5 and CML6) and Ph+ ALL (ICN1 and PDX2) cells following 12 h treatment with control or BML275 (10 μmol/L). Plotted is log2-transformed average relative amounts (amount in cells treated with BML275/average amount of in control; 2 cases per group; each in triplicate), and data were median-centered. Median-centering was performed separately for CML5, CML6, ICN1 and PDX2 samples. f, Patient-derived CML (left) and pre-B ALL (middle) cells as well as MYC-driven B cell lymphoma cell lines (right) were treated with BML275 (10 μmol/L) or vehicle control for 6 hr. Glycolytic profiles (ECAR) and mitochondrial functions (OCR) were measured (normalized to total protein; n = 6; f). Data shown as mean (± e.f.) and assessed by two-tailed t-test (e, f).
Extended Data Figure 9
Extended Data Figure 9. Mechanistic contribution of PAX5 targets
a, b, Representative FACS plots from CRISPR-based gene editing experiments (a). CRISPR complexes were delivered to patient-derived PAX5-haploinsufficient pre-B ALL cells along with RFP-tagged gRNAs to direct dCas9 (CRISPR-mediated gene activation) or Cas9 (CRISPR-mediated gene deletion) to specific PAX5 target genes (e.g. NR3C1; left). Upon inducible activation of GFP-tagged PAX5 or EV in patient-derived pre-B ALL cells, enrichment or depletion of GFP+ cells carrying RFP-tagged gRNAs (RFP+) was monitored by flow cytometry (right; NT: non-targeting; g-53: gRNA clone 53 for deletion of NR3C1). Changes in percentage of GFP+ cells carrying the indicated gRNAs following induction, as compared to cells carrying the NT gRNA (b). c, d, In murine pre-B ALL models for genetic loss of Nr3c1, Cnr2, and Txnip function, responses to prednisolone (Pred) were measured (c) and protein levels of Nr3c1, Txnip and Cnr2 were examined (d). (e) In a patient-derived PAX5-haploinsufficient pre-B ALL (PAX5Δ; left), Dex responses upon inducible activation of PAX5 or empty vector (EV) were measured. In a patient-derived PAX5-wildtype pre-B ALL (PAX5WT; right), effects of DN-PAX5 on Dex responses were measured. Likewise, dose-response curves for Dex were measured in two patient-derived pre-B ALL samples carrying either wildtype or deleted IKZF1 when DN-IKZF1 or IKZF1 were inducibly expressed, respectively. Data shown as mean from 3 independent experiments (± s.d.) and assessed by two-tailed t-test (b) or two-way ANOVA (c, e).
Extended Data Figure 10
Extended Data Figure 10. Targeting AMPK, CNR2 and TXNIP in combination with glucocorticoids
a, Three different patient-derived pre-B ALL samples were treated with AMPK inhibitor BML275 as indicated, prednisolone, or in combination for 72 hr. b, Three different patient-derived pre-B ALL cells were treated with CNR2 agonist HU308 as indicated, or prednisolone (Pred) alone, or in combination for 72 hr. c, d, Three different patient-derived pre-B ALL cells were treated with a TXNIP agonist 3-O-methylglucose (3-O-MG; c) or D-allose (d) as indicated, prednisolone alone, or in combination for 72 hr. Relative viability was assessed (a–d). Combination index (CI) values at ED50 are shown. Prednisolone concentrations used were 2-fold higher than BML275. All data shown as mean ± s.d. (n = 3 independent experiments).
Figure 1
Figure 1. A B-lymphoid transcriptional program to regulate factors of glucose uptake and utilization
a, Western blots of PAX5-, IKZF1-, DN-PAX5-, and DN-IKZF1-induced changes in patient-derived pre-B ALL cells. b, c, Enrichment or depletion (two-way ANOVA) of pre-B ALL cells carrying GFP-tagged PAX5 (b), IKZF1 (c), DN-PAX5 (b) or DN-IKZF1 (c). Glucose uptake and ATP levels were analyzed by two-tailed t-test. Data, mean ± s.d. (n = 3 independent experiments; b,c). For gel source data, see Supplementary Fig. 1.
Figure 2
Figure 2. LKB1-AMPK is required to balance glucose and energy metabolism in pre-B ALL
a, b, Heatmap of metabolomics (n = 2 per group, each in triplicate; a) and Western blots (n = 4; b) of patient-derived leukemia samples. c, Glucose uptake and ATP levels during B→ myeloid reprogramming (n = 4). d, Fold change of pre-B ALL cells carrying GFP-tagged Cre following Lkb1-deletion upon reprogramming (n = 6). e, Viability of pre-B ALL cells following deletion of Lkb1 or Ampkα2 (n = 3 independent experiments). f, Kaplan-Meier analysis (Mantel-Cox log-rank test) of recipient mice (n = 7 per group) injected with pre-B ALL cells following 4-OHT-induced deletion of Lkb1 or Ampkα2 (24 h). g, Patient-derived pre-B ALL cells treated with BML275 as indicated or in combination with prednisolone (n = 3), assessed by Combination Index (CI). Data, mean (± s.d), assessed by two-tailed t-test (c) or two-way ANOVA (d, e). For gel source data, see Supplementary Fig. 1.
Figure 3
Figure 3. Mechanistic contribution of PAX5 targets to regulation of glucose and energy metabolism in pre-B ALL
a, Glucose uptake and ATP levels upon genetic loss of Nr3c1, Txnip or Cnr2 function, analyzed by two-tailed t-test. b, Viability upon inducible expression of Pax5 with or without loss of Nr3c1, Txnip or Cnr2 function. c, Fold change of GFP+ patient-derived pre-B ALL cells carrying Cas9 and gRNAs (NT: non-targeting) upon induction of GFP-tagged PAX5. Western blots of NR3C1, TXNIP and CNR2 to verify deletion (no induction). Data, mean ± s.d. (n = 3 independent experiments). Data assessed by two-way ANOVA (b, c). For gel source data, see Supplementary Fig. 1.
Figure 4
Figure 4. Transcriptional restriction of glucose and energy supply prevents oncogenic signaling and pre-B cell transformation
a, Fold change of GFP+ patient-derived pre-B ALL cells carrying GFP-tagged PAX5 (left) or IKZF1 (right) upon treatment with methyl pyruvate (MP; 5 mM), dimethyl succinate (DMS; 5 mM) and oxaloacetate (OAA; 5 mM; two-way ANOVA). b,c, Colony formation, GFP expression (b, two-tailed t-test), and Western blots of vehicle or OAA/DMS-treated murine BCR-ABL1+ pre-B cells (n = 3, c). d, Kaplan-Meier analysis (log-rank test) of recipient mice injected with treated BCR-ABL1+ pre-B cells (n = 7 per group). e, Representative FACS plots of bone marrow and spleens harvested from (d). f, Scenario for B-lymphoid transcription factors as metabolic gatekeepers. Data, mean from 3 independent experiments (± s.d; a, b). For gel source data, see Supplementary Fig. 1.

Comment in

References

    1. Nutt SL, Heavey B, Rolink AG, Busslinger M. Commitment to the B-lymphoid lineage depends on the transcription factor Pax5. Nature. 1999;401:556–562. - PubMed
    1. Georgopoulos K, Bigby M, Wang JH, Molnar A, Wu P, Winandy S, Sharpe A. The Ikaros gene is required for the development of all lymphoid lineages. Cell. 1994;79:143–156. - PubMed
    1. Mullighan CG, et al. Genome-wide analysis of genetic alterations in acute lymphoblastic leukaemia. Nature. 2007;446:758–764. - PubMed
    1. Mullighan CG, et al. BCR-ABL1 lymphoblastic leukaemia is characterized by the deletion of Ikaros. Nature. 2008;453:110–114. - PubMed
    1. Nakada D, Saunders TL, Morrison SJ. Lkb1 regulates cell cycle and energy metabolism in haematopoietic stem cells. Nature. 2010;468:653–658. - PMC - PubMed

Publication types

MeSH terms

Substances