

Development of an Ion Mobility Spectrometry-Orbitrap Mass Spectrometer Platform
- PMID: 28193022
- PMCID: PMC6211177
- DOI: 10.1021/acs.analchem.6b03027
Development of an Ion Mobility Spectrometry-Orbitrap Mass Spectrometer Platform
Abstract
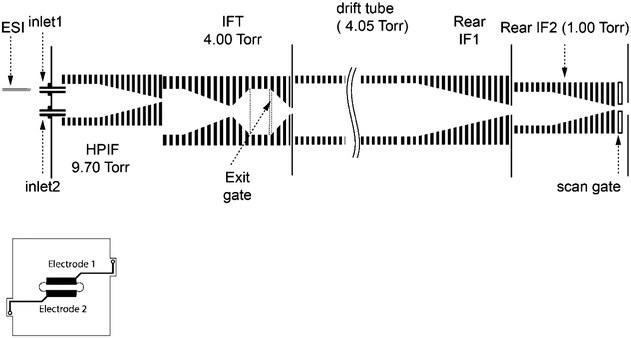
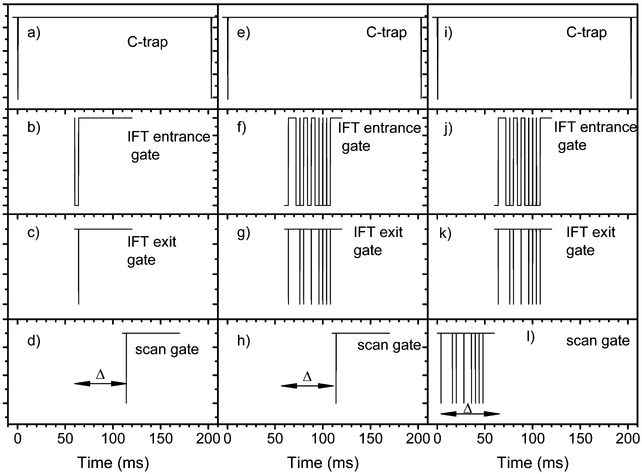
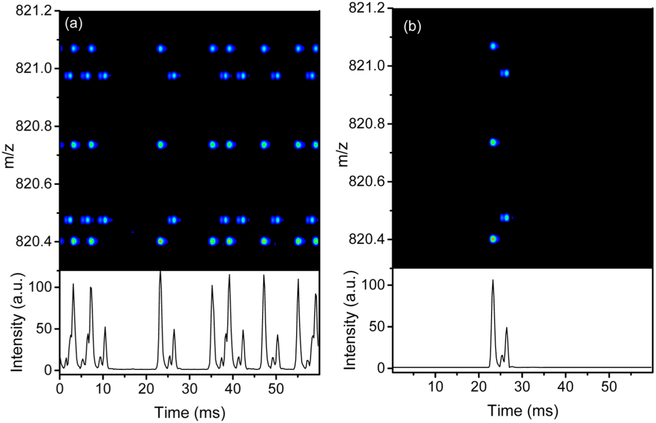
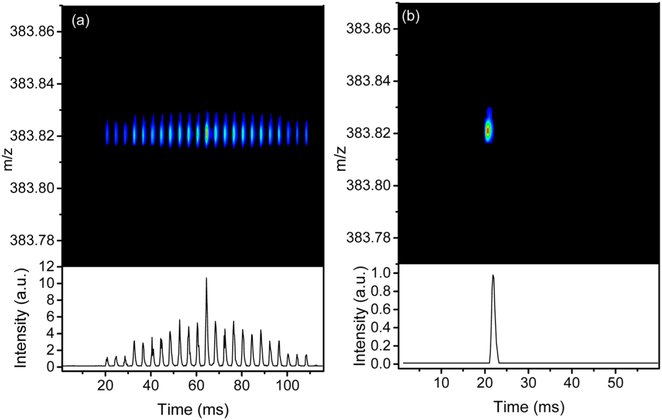
Complex samples benefit from multidimensional measurements where higher resolution enables more complete characterization of biological and environmental systems. To address this challenge, we developed a drift tube-based ion mobility spectrometry-Orbitrap mass spectrometer (IMS-Orbitrap MS) platform. To circumvent the time scale disparity between the fast IMS separation and the much slower Orbitrap MS acquisition, we utilized a dual gate and pseudorandom sequences to multiplex the injection of ions and allow operation in signal averaging (SA), single multiplexing (SM), and double multiplexing (DM) IMS modes to optimize the signal-to-noise ratio of the measurements. For the SM measurements, a previously developed algorithm was used to reconstruct the IMS data. A new algorithm was developed for the DM analyses involving a two-step process that first recovers the SM data and then decodes the SM data. The algorithm also performs multiple refining procedures to minimize demultiplexing artifacts. The new IMS-Orbitrap MS platform was demonstrated by the analysis of proteomic and petroleum samples, where the integration of IMS and high mass resolution proved essential for accurate assignment of molecular formulas.
Conflict of interest statement
The authors declare no competing financial interest.
Figures


Similar articles
-
A Dual-Gated Structures for Lossless Ion Manipulations-Ion Mobility Orbitrap Mass Spectrometry Platform for Combined Ultra-High-Resolution Molecular Analysis.Anal Chem. 2023 Jun 27;95(25):9531-9538. doi: 10.1021/acs.analchem.3c00881. Epub 2023 Jun 12. Anal Chem. 2023. PMID: 37307303
-
Toward artifact-free data in Hadamard transform-based double multiplexing of ion mobility-Orbitrap mass spectrometry.Analyst. 2017 May 21;142(10):1735-1745. doi: 10.1039/c7an00289k. Epub 2017 Apr 13. Analyst. 2017. PMID: 28406514
-
Online Ozonolysis Combined with Ion Mobility-Mass Spectrometry Provides a New Platform for Lipid Isomer Analyses.Anal Chem. 2018 Jan 16;90(2):1292-1300. doi: 10.1021/acs.analchem.7b04091. Epub 2017 Dec 21. Anal Chem. 2018. PMID: 29220163 Free PMC article.
-
THE IMS PARADOX: A PERSPECTIVE ON STRUCTURAL ION MOBILITY-MASS SPECTROMETRY.Mass Spectrom Rev. 2021 May;40(3):280-305. doi: 10.1002/mas.21642. Epub 2020 Jul 1. Mass Spectrom Rev. 2021. PMID: 32608033 Free PMC article. Review.
-
Magnifying ion mobility spectrometry-mass spectrometry measurements for biomolecular structure studies.Curr Opin Chem Biol. 2018 Feb;42:101-110. doi: 10.1016/j.cbpa.2017.11.013. Epub 2017 Dec 12. Curr Opin Chem Biol. 2018. PMID: 29241076 Free PMC article. Review.
Cited by
-
Rapid Characterization of Emerging Per- and Polyfluoroalkyl Substances in Aqueous Film-Forming Foams Using Ion Mobility Spectrometry-Mass Spectrometry.Environ Sci Technol. 2020 Dec 1;54(23):15024-15034. doi: 10.1021/acs.est.0c04798. Epub 2020 Nov 11. Environ Sci Technol. 2020. PMID: 33176098 Free PMC article.
-
Data Processing Workflow to Identify Structurally Related Compounds in Petroleum Substances Using Ion Mobility Spectrometry-Mass Spectrometry.Energy Fuels. 2021 Jul 1;35(13):10529-10539. doi: 10.1021/acs.energyfuels.1c00892. Epub 2021 Jun 16. Energy Fuels. 2021. PMID: 34366560 Free PMC article.
-
Analysis of Photoirradiated Water Accommodated Fractions of Crude Oils Using Tandem TIMS and FT-ICR MS.Environ Sci Technol. 2017 Jun 6;51(11):5978-5988. doi: 10.1021/acs.est.7b00508. Epub 2017 May 9. Environ Sci Technol. 2017. PMID: 28457132 Free PMC article.
-
Reference Library for Suspect Non-targeted Screening of Environmental Toxicants Using Ion Mobility Spectrometry-Mass Spectrometry.bioRxiv [Preprint]. 2025 Feb 27:2025.02.22.639656. doi: 10.1101/2025.02.22.639656. bioRxiv. 2025. Update in: Commun Chem. 2025 Aug 1;8(1):224. doi: 10.1038/s42004-025-01619-7. PMID: 40060593 Free PMC article. Updated. Preprint.
-
Reaction Monitoring and Structural Characterisation of Coordination Driven Self-Assembled Systems by Ion Mobility-Mass Spectrometry.Front Chem. 2021 Jun 8;9:682743. doi: 10.3389/fchem.2021.682743. eCollection 2021. Front Chem. 2021. PMID: 34169059 Free PMC article. Review.
References
-
- Johnson PV; Beegle LW; Kim HI; Eiceman GA; Kanik I Int. J. Mass Spectrom 2007, 262, 1–15.
-
- Kanu AB; Dwivedi P; Tam M; Matz L; Hill HH Jr. J. Mass Spectrom 2008, 43, 1–22. - PubMed
-
- Karpas Z Food Res. Int 2013, 54, 1146–1151.
-
- Fenn LS; McLean JA Anal. Bioanal. Chem 2008, 391, 905–909. - PubMed
-
- Fernandez-Lima FA; Becker C; McKenna AM; Rodgers RP; Marshall AG; Russell DH Anal. Chem 2009, 81, 9941–9947. - PubMed
Publication types
MeSH terms
Substances
Grants and funding
LinkOut - more resources
Full Text Sources
Other Literature Sources
