

Genome-wide characterization of JASMONATE-ZIM DOMAIN transcription repressors in wheat (Triticum aestivum L.)
- PMID: 28193162
- PMCID: PMC5307646
- DOI: 10.1186/s12864-017-3582-0
Genome-wide characterization of JASMONATE-ZIM DOMAIN transcription repressors in wheat (Triticum aestivum L.)
Abstract
Background: The JASMONATE-ZIM DOMAIN (JAZ) repressor family proteins are jasmonate co-receptors and transcriptional repressor in jasmonic acid (JA) signaling pathway, and they play important roles in regulating the growth and development of plants. Recently, more and more researches on JAZ gene family are reported in many plants. Although the genome sequencing of common wheat (Triticum aestivum L.) and its relatives is complete, our knowledge about this gene family remains vacant.
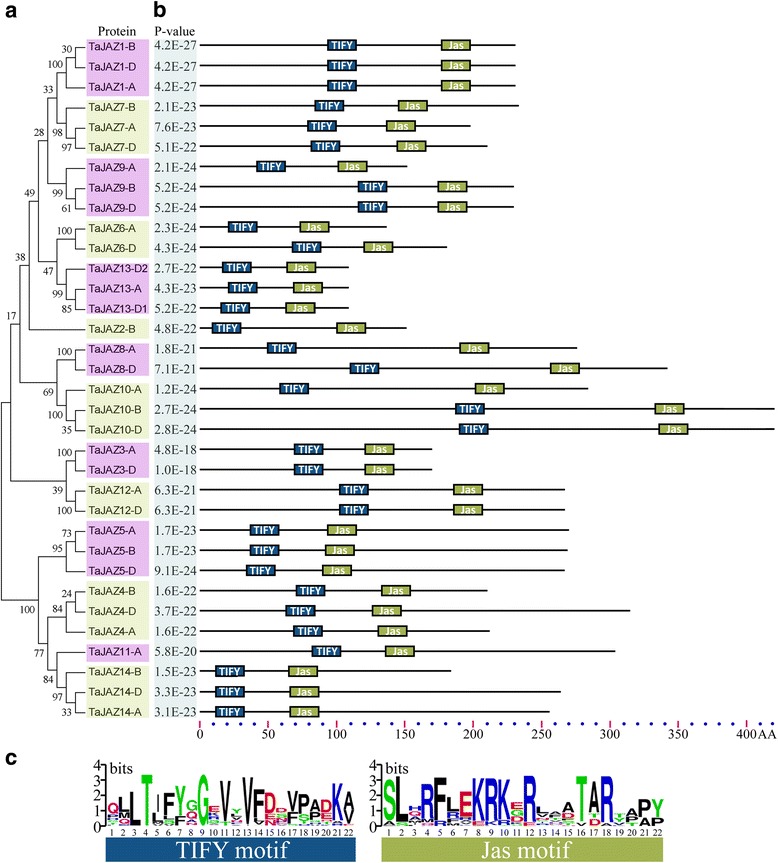
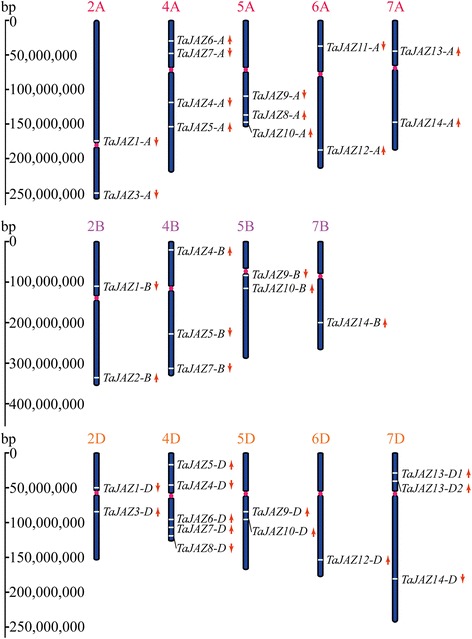
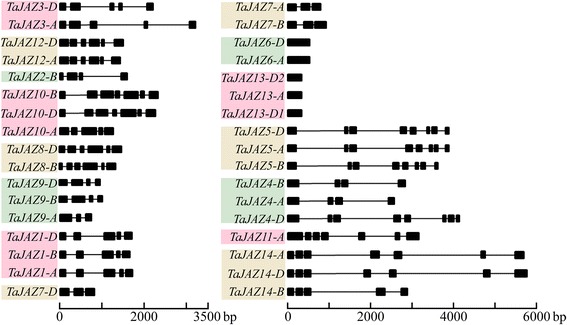
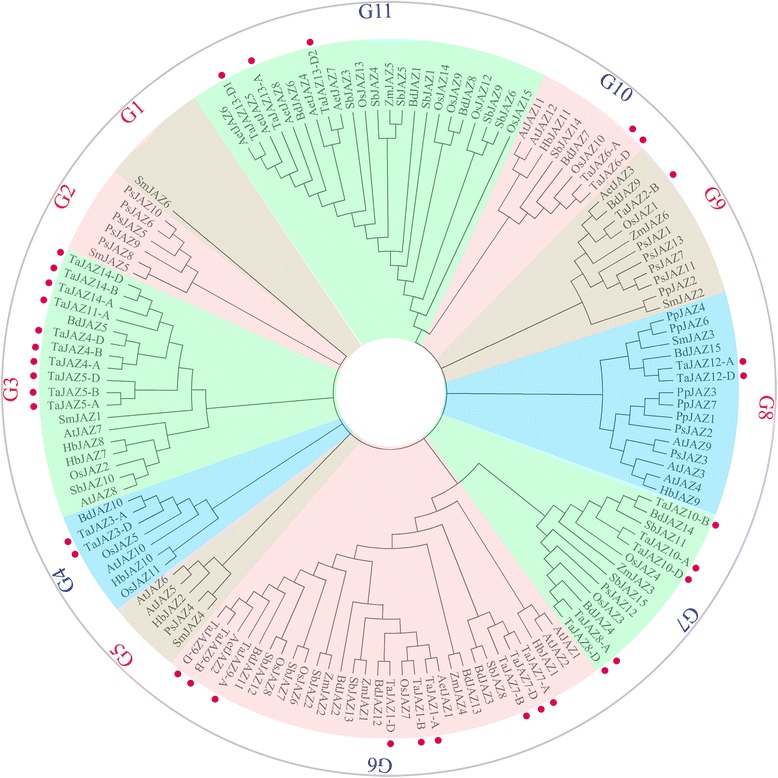
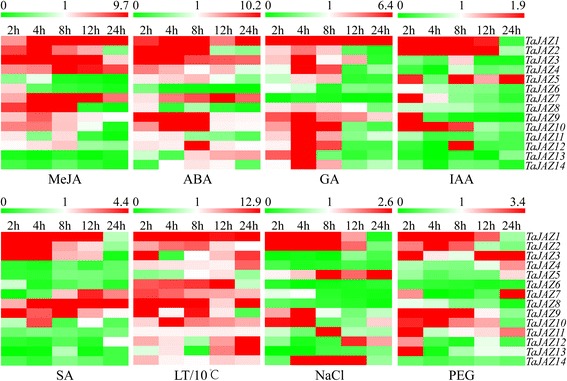
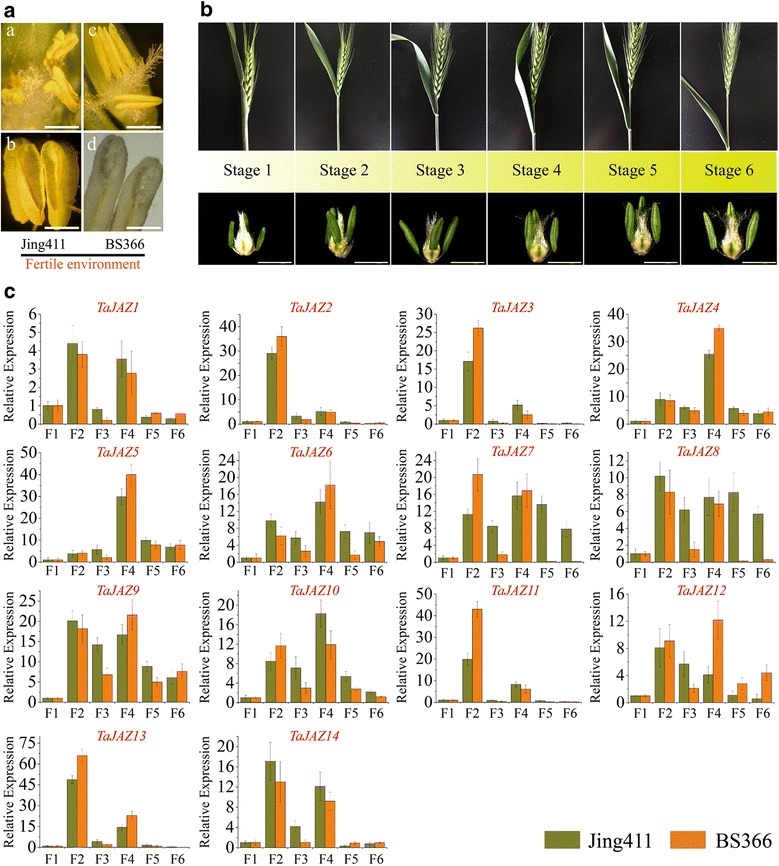
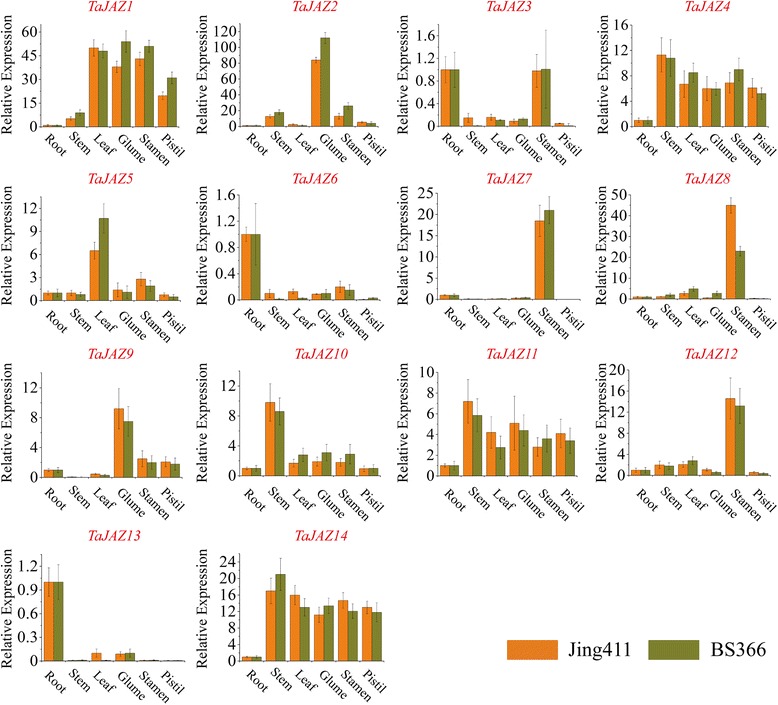
Results: Fourteen JAZ genes were identified in the wheat genome. Structural analysis revealed that the TaJAZ proteins in wheat were as conserved as those in other plants, but had structural characteristics. By phylogenetic analysis, all JAZ proteins from wheat and other plants were clustered into 11 sub-groups (G1-G11), and TaJAZ proteins shared a high degree of similarity with some JAZ proteins from Aegliops tauschii, Brachypodium distachyon and Oryza sativa. The Ka/Ks ratios of TaJAZ genes ranged from 0.0016 to 0.6973, suggesting that the TaJAZ family had undergone purifying selection in wheat. Gene expression patterns obtained by quantitative real-time PCR (qRT-PCR) revealed differential temporal and spatial regulation of TaJAZ genes under multifarious abiotic stress treatments of high salinity, drought, cold and phytohormone. Among these, TaJAZ7, 8 and 12 were specifically expressed in the anther tissues of the thermosensitive genic male sterile (TGMS) wheat line BS366 and normal control wheat line Jing411. Compared with the gene expression patterns in the normal wheat line Jing411, TaJAZ7, 8 and 12 had different expression patterns in abnormally dehiscent anthers of BS366 at the heading stage 6, suggesting that specific up- or down-regulation of these genes might be associated with the abnormal anther dehiscence in TGMS wheat line.
Conclusion: This study analyzed the size and composition of the JAZ gene family in wheat, and investigated stress responsive and differential tissue-specific expression profiles of each TaJAZ gene in TGMS wheat line BS366. In addition, we isolated 3 TaJAZ genes that would be more likely to be involved in the regulation of abnormal anther dehiscence in TGMS wheat line. In conclusion, the results of this study contributed some novel and detailed information about JAZ gene family in wheat, and also provided 3 potential candidate genes for improving the TGMS wheat line.
Keywords: Anther dehiscence; Gene expression; JASMONATE-ZIM DOMAIN; Phylogenetic analysis; Thermo sensitive genic male sterile (TGMS).
Figures
Similar articles
-
Genomic identification and characterization of MYC family genes in wheat (Triticum aestivum L.).BMC Genomics. 2019 Dec 30;20(1):1032. doi: 10.1186/s12864-019-6373-y. BMC Genomics. 2019. PMID: 31888472 Free PMC article.
-
Comprehensive analyses of the annexin gene family in wheat.BMC Genomics. 2016 May 28;17:415. doi: 10.1186/s12864-016-2750-y. BMC Genomics. 2016. PMID: 27236332 Free PMC article.
-
Genome-wide identification and analysis of the COI gene family in wheat (Triticum aestivum L.).BMC Genomics. 2018 Oct 17;19(1):754. doi: 10.1186/s12864-018-5116-9. BMC Genomics. 2018. PMID: 30332983 Free PMC article.
-
JAZ repressors and the orchestration of phytohormone crosstalk.Trends Plant Sci. 2012 Jan;17(1):22-31. doi: 10.1016/j.tplants.2011.10.006. Epub 2011 Nov 21. Trends Plant Sci. 2012. PMID: 22112386 Review.
-
JAZ repressors set the rhythm in jasmonate signaling.Curr Opin Plant Biol. 2008 Oct;11(5):486-94. doi: 10.1016/j.pbi.2008.06.003. Epub 2008 Jul 22. Curr Opin Plant Biol. 2008. PMID: 18653378 Review.
Cited by
-
Genome-wide and expression pattern analysis of JAZ family involved in stress responses and postharvest processing treatments in Camellia sinensis.Sci Rep. 2020 Feb 17;10(1):2792. doi: 10.1038/s41598-020-59675-z. Sci Rep. 2020. PMID: 32066857 Free PMC article.
-
Genome-Wide Identification and Variation Analysis of JAZ Family Reveals BnaJAZ8.C03 Involved in the Resistance to Plasmodiophora brassicae in Brassica napus.Int J Mol Sci. 2022 Oct 25;23(21):12862. doi: 10.3390/ijms232112862. Int J Mol Sci. 2022. PMID: 36361657 Free PMC article.
-
Genome Wide Identification and Characterization of Wheat GH9 Genes Reveals Their Roles in Pollen Development and Anther Dehiscence.Int J Mol Sci. 2022 Jun 5;23(11):6324. doi: 10.3390/ijms23116324. Int J Mol Sci. 2022. PMID: 35683004 Free PMC article.
-
Genome-wide identification and abiotic stress-responsive pattern of heat shock transcription factor family in Triticum aestivum L.BMC Genomics. 2019 Apr 1;20(1):257. doi: 10.1186/s12864-019-5617-1. BMC Genomics. 2019. PMID: 30935363 Free PMC article.
-
Genomic identification and characterization of MYC family genes in wheat (Triticum aestivum L.).BMC Genomics. 2019 Dec 30;20(1):1032. doi: 10.1186/s12864-019-6373-y. BMC Genomics. 2019. PMID: 31888472 Free PMC article.
References
Publication types
MeSH terms
Substances
LinkOut - more resources
Full Text Sources
Other Literature Sources
