Review
. 2017 May;152(7):1718-1727.e3.
doi: 10.1053/j.gastro.2017.01.052. Epub 2017 Feb 11.

Obesity Energetics: Body Weight Regulation and the Effects of Diet Composition

Affiliations
Review

Obesity Energetics: Body Weight Regulation and the Effects of Diet Composition

Kevin D Hall et al. Gastroenterology. 2017 May.

Abstract

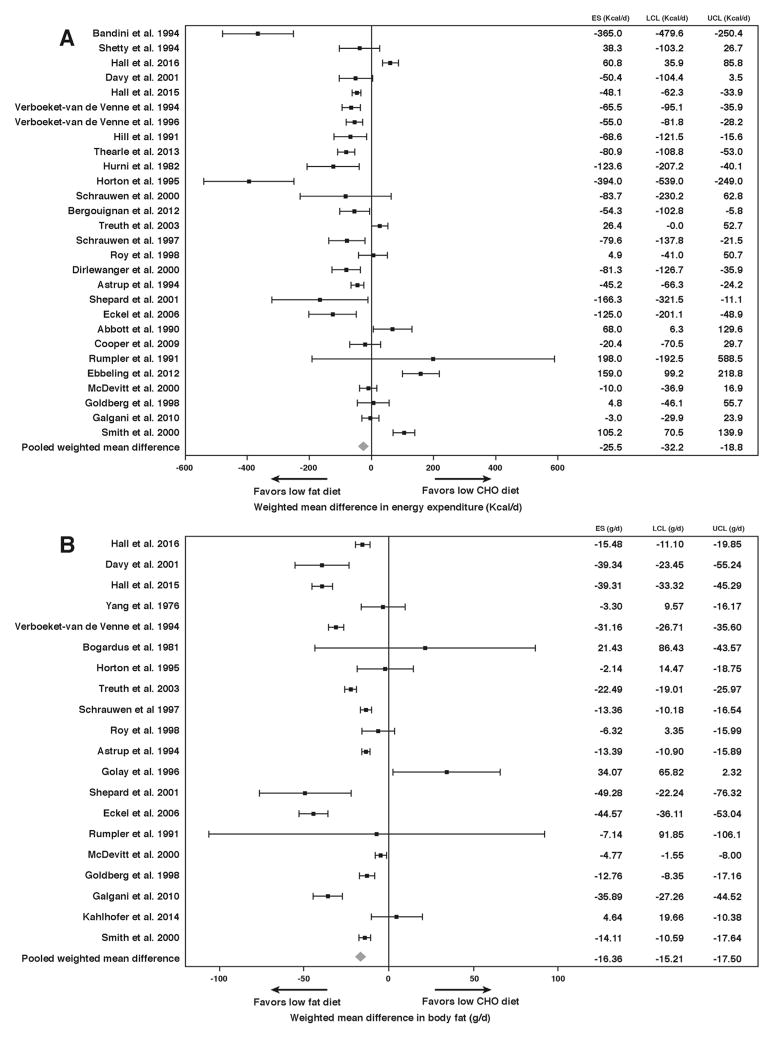
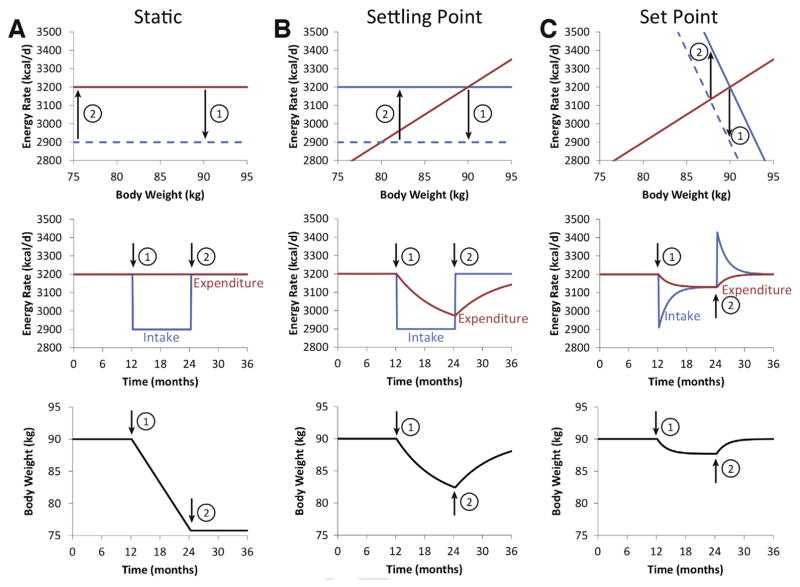
Weight changes are accompanied by imbalances between calorie intake and expenditure. This fact is often misinterpreted to suggest that obesity is caused by gluttony and sloth and can be treated by simply advising people to eat less and move more. Rather various components of energy balance are dynamically interrelated and weight loss is resisted by counterbalancing physiological processes. While low-carbohydrate diets have been suggested to partially subvert these processes by increasing energy expenditure and promoting fat loss, our meta-analysis of 32 controlled feeding studies with isocaloric substitution of carbohydrate for fat found that both energy expenditure (26 kcal/d; P <.0001) and fat loss (16 g/d; P <.0001) were greater with lower fat diets. We review the components of energy balance and the mechanisms acting to resist weight loss in the context of static, settling point, and set-point models of body weight regulation, with the set-point model being most commensurate with current data.

Keywords: Body Weight Regulation; Energy Expenditure; Energy Intake; Macronutrients.


Conflict of interest statement

Conflicts of interest

K.D.H. has received funding from the Nutrition Science Initiative to investigate the effects of ketogenic diets on human energy expenditure. K.D.H. also has a patent pending on a method of personalized dynamic feedback control of body weight (US Patent Application No. 13/754,058; assigned to the National Institutes of Health). J.G. has no conflicts of interest to disclose.

Figures

Figure 1
Figure 1
Components of human energy expenditure and body composition in average 100-kg and 70-kg men. (A) Daily energy expenditure comprises the energy cost of digesting and processing food, called the thermic effect of food, the energy expended in physical activity, and the energy expended at rest to maintain life. People with obesity have a higher thermic effect of food because of greater food intake. Furthermore, people with obesity may expend more energy for physical activity despite typically moving around less than a lean individual because physical activity expenditure is proportional to body weight. Energy expended at rest is also greater in people with obesity because they have more metabolically active fat-free mass in addition to greater body fat as depicted in (B). (C) Body fat represents the vast majority of energy stores in the body compared with the energy content of body protein and glycogen. People with obesity can have vast quantities of stored energy in the form of body fat that represents several months of energy expenditure.
Figure 2
Figure 2
Meta-analysis of controlled isocaloric feeding studies with constant dietary protein and varying ratios of carbohydrate to fat. Studies are ordered from top to bottom according to the largest difference in carbohydrate between diet comparisons. Effect size (ES), upper and lower 95% confidence limits (UCL and LCL, respectively) are indicated for the differences in daily energy expenditure (A) and rate of body fat change (B). The pooled weighted mean difference across studies demonstrated small differences in daily energy expenditure (26 kcal/d, P <.0001) and body fat change (16 g/d, P <.0001) favoring lower fat diets
Figure 3
Figure 3
Comparison of static, settling point, and set point models of body weight regulation in a simulated 90-kg man. (A) The static model assumes that energy intake (blue) and expenditure (red) are independent quantities that do not depend on body weight, as shown by the horizontal lines in the top panel. For the first year, energy intake and expenditure are assumed to be balanced and correspond to overlapping solid lines. At the end of the first year, the energy intake line is shifted downward by 300 kcal/d to the dashed blue line corresponding with the start of a weight loss intervention indicated by (1). Because energy expenditure is assumed to be constant, a constant energy deficit is achieved (top and middle panels) resulting in a linear rate of weight loss (bottom panel). At the start of the second year (2), the intervention is stopped and the dashed energy intake curve shifts back to the solid baseline intake line and weight loss is maintained. (B) The settling point model assumes that energy expenditure is an increasing function of body weight whereas energy intake is independent of weight (top panel). Shifting the intake curve down by the same 300 kcal/d after the first year (1) results in an energy deficit that decreases in proportion to weight lost (top panel) resulting in an exponential decay of the energy deficit over time (middle panel). Body weight falls according to a parallel exponential pattern and it takes years to reach a new equilibrium weight (bottom panel). At the beginning of the second year (2), the energy intake curve is shifted upward (top panel) and energy intake increases (middle panel), generating an energy surplus that results in an exponential pattern of weight regain mirroring prior weight loss. (C) The set point model assumes that both energy intake and expenditure are functions of body weight (top panel) and the same 300 kcal/d shift in the energy intake curve (top panel) results in an initial decrease in energy intake that subsequently exponentially increases (middle panel) as weight is lost and energy expenditure decreases. Body weight is lost in an abbreviated exponential pattern and achieves a new equilibrium after about 6 months and no further loss occurs despite the continued intervention (bottom panel). At the start of the second year (2), the energy intake curve shifts to baseline (top panel) and leads to transient hyperphagia (middle panel) and rapid weight regain (bottom panel).

References

    1. Levine DI. The curious history of the calorie in U.S. policy: a tradition of unfulfilled promises. Am J Prev Med. 2017;52:125–129. - PubMed
    1. Guth E. JAMA patient page. Healthy weight loss. JAMA. 2014;312:974. - PubMed
    1. Hall KD, Chow CC. Why is the 3500 kcal per pound weight loss rule wrong? Int J Obes (Lond) 2013;37:1614. - PMC - PubMed
    1. Hall KD, Heymsfield SB, Kemnitz JW, et al. Energy balance and its components: implications for body weight regulation. Am J Clin Nutr. 2012;95:989–994. - PMC - PubMed
    1. Ochner CN, Tsai AG, Kushner RF, et al. Treating obesity seriously: when recommendations for lifestyle change confront biological adaptations. Lancet Diabetes Endocrinol. 2015;3:232–234. - PubMed

Publication types