. 2017 Jun 15;23(12):3168-3180.
doi: 10.1158/1078-0432.CCR-17-0270. Epub 2017 Feb 13.

Transcriptional Mechanisms of Resistance to Anti-PD-1 Therapy

Affiliations

Transcriptional Mechanisms of Resistance to Anti-PD-1 Therapy

Maria L Ascierto et al. Clin Cancer Res. .

Abstract

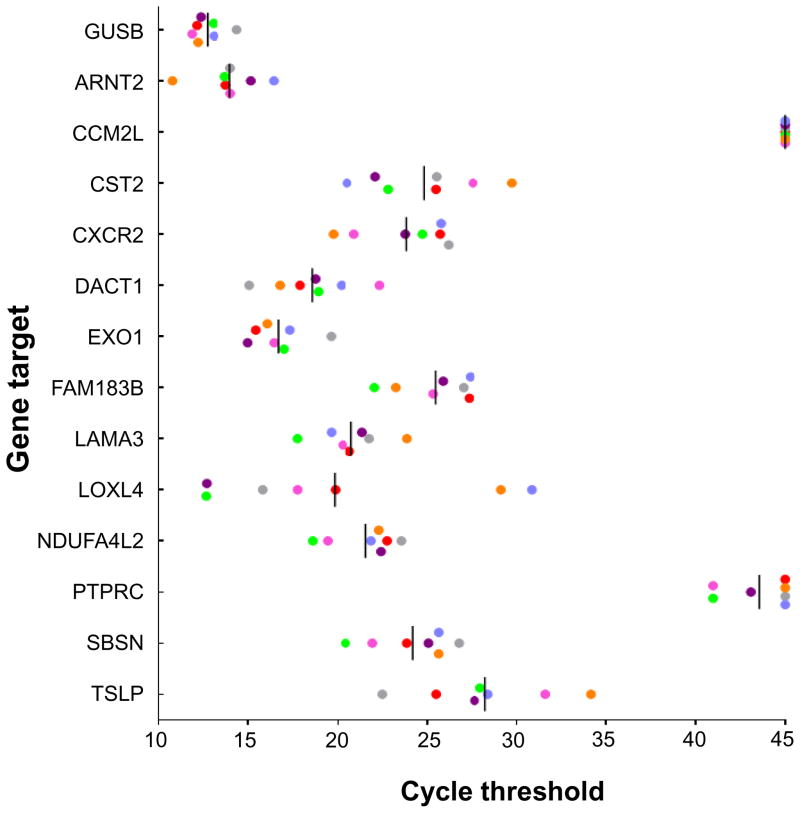
Purpose: To explore factors associated with response and resistance to anti-PD-1 therapy, we analyzed multiple disease sites at autopsy in a patient with widely metastatic melanoma who had a heterogeneous response.Materials and Methods: Twenty-six melanoma specimens (four premortem, 22 postmortem) were subjected to whole exome sequencing. Candidate immunologic markers and gene expression were assessed in 10 cutaneous metastases showing response or progression during therapy.Results: The melanoma was driven by biallelic inactivation of NF1 All lesions had highly concordant mutational profiles and copy number alterations, indicating linear clonal evolution. Expression of candidate immunologic markers was similar in responding and progressing lesions. However, progressing cutaneous metastases were associated with overexpression of genes associated with extracellular matrix and neutrophil function.Conclusions: Although mutational and immunologic differences have been proposed as the primary determinants of heterogeneous response/resistance to targeted therapies and immunotherapies, respectively, differential lesional gene expression profiles may also dictate anti-PD-1 outcomes. Clin Cancer Res; 23(12); 3168-80. ©2017 AACRSee related commentary by Wilmott et al., p. 2921.


Figures

Figure 1
Figure 1
Cutaneous melanoma metastases demonstrating progression (white arrows) or regression (black arrows) after 25 and 19 weeks of nivolumab anti-PD-1 therapy, respectively.
Figure 2
Figure 2
Mutational profiling of a metastatic melanoma of cutaneous origin. (A) The abundance of mutations in every lesion is typical of cutaneous melanoma. Most mutations are clonal (n=618) and present in every specimen. Each specimen, including the primary lesion, 3 pre-mortem and 22 post-mortem specimens, harbors the NF1 Q519* driver mutation. Excluding lesions M13 (local recurrence left arm skin) and M14 (lung metastasis), which have the greatest number of private mutations (281 and 622, respectively), 50% of all somatic nonsynonymous mutations are present in all tumors. Melanoma lesions (described in Table 1) are ordered from top to bottom by increasing numbers of private mutations. Intensity of blue shading indicates fraction of mutant tumor cells. (B) Phylogenetic tree of mutational evolution in this patient. The variants in Fig. 2A were filtered for phylogenetic analysis (see Methods). The branches colored in light green, clustered with the 10 regressing/progressing cutaneous metastases on nivolumab therapy in 2013, represent cutaneous lesions M24 and M25 obtained in 2011 and 2012, respectively. The primary melanoma lesion from 2008 (M26) is highly similar to these cutaneous metastases.
Figure 2
Figure 2
Mutational profiling of a metastatic melanoma of cutaneous origin. (A) The abundance of mutations in every lesion is typical of cutaneous melanoma. Most mutations are clonal (n=618) and present in every specimen. Each specimen, including the primary lesion, 3 pre-mortem and 22 post-mortem specimens, harbors the NF1 Q519* driver mutation. Excluding lesions M13 (local recurrence left arm skin) and M14 (lung metastasis), which have the greatest number of private mutations (281 and 622, respectively), 50% of all somatic nonsynonymous mutations are present in all tumors. Melanoma lesions (described in Table 1) are ordered from top to bottom by increasing numbers of private mutations. Intensity of blue shading indicates fraction of mutant tumor cells. (B) Phylogenetic tree of mutational evolution in this patient. The variants in Fig. 2A were filtered for phylogenetic analysis (see Methods). The branches colored in light green, clustered with the 10 regressing/progressing cutaneous metastases on nivolumab therapy in 2013, represent cutaneous lesions M24 and M25 obtained in 2011 and 2012, respectively. The primary melanoma lesion from 2008 (M26) is highly similar to these cutaneous metastases.
Figure 3
Figure 3
Geography of CD8 infiltrates does not distinguish regressing from progressing cutaneous melanoma metastases. (A) Representative regressing and progressing cutaneous melanoma metastases, stained with hematoxylin/eosin (H&E) or anti-CD8. The distribution of intratumoral and peritumoral CD8+T cells does not differ between these lesions. (B) Density of CD8 T cells in 6 regressing and 4 progressing melanoma metastases, mapped according to intratumoral and peripheral zones. (C) Density mapping of CD8 T cells in the primary melanoma lesion and 3 metastases biopsied before death. Note the difference in Y-axis scale between (B) and (C). Two specimens, the primary melanoma and metastasis M25, did not contain sufficient peritumoral tissue to perform a complete analysis. See also Supplementary Figure S2B.
Figure 3
Figure 3
Geography of CD8 infiltrates does not distinguish regressing from progressing cutaneous melanoma metastases. (A) Representative regressing and progressing cutaneous melanoma metastases, stained with hematoxylin/eosin (H&E) or anti-CD8. The distribution of intratumoral and peritumoral CD8+T cells does not differ between these lesions. (B) Density of CD8 T cells in 6 regressing and 4 progressing melanoma metastases, mapped according to intratumoral and peripheral zones. (C) Density mapping of CD8 T cells in the primary melanoma lesion and 3 metastases biopsied before death. Note the difference in Y-axis scale between (B) and (C). Two specimens, the primary melanoma and metastasis M25, did not contain sufficient peritumoral tissue to perform a complete analysis. See also Supplementary Figure S2B.
Figure 4
Figure 4
Expression of genes associated with progressing cutaneous metastases, in melanoma cell lines. The expression of 13 genes significantly differentially expressed in progressing compared to regressing cutaneous metastases (Table 2) was assessed in seven established human melanoma cell lines with qRT-PCR. Each dot represents a single cell line. Vertical bars, mean values. GUSB expression is shown as an internal control. Undetermined values are depicted as having a cycle threshold of 45, the maximum number of PCR cycles in this assay.
Figure 5
Figure 5
LAMA3 protein expression in melanoma lesions assessed by IHC. (A) LAMA3 is expressed in a progressing cutaneous melanoma metastasis, and in three non-cutaneous metastases, but not in the primary melanoma lesion nor in a regressing melanoma cutaneous metastasis. Brown staining detects LAMA3 protein. Specimen numbers are found in Table 1. Met, metastasis. (B) LAMA3 protein expression quantified by histoscore (H-score), the product of the percentage of positively staining cells with IHC, by the staining intensity (graded as 0, no stain; 1, weak; 2, medium; 3, strong staining). Horizontal bars, mean values. P-value derived from a one-sided Wilcoxon rank sum test.
Figure 5
Figure 5
LAMA3 protein expression in melanoma lesions assessed by IHC. (A) LAMA3 is expressed in a progressing cutaneous melanoma metastasis, and in three non-cutaneous metastases, but not in the primary melanoma lesion nor in a regressing melanoma cutaneous metastasis. Brown staining detects LAMA3 protein. Specimen numbers are found in Table 1. Met, metastasis. (B) LAMA3 protein expression quantified by histoscore (H-score), the product of the percentage of positively staining cells with IHC, by the staining intensity (graded as 0, no stain; 1, weak; 2, medium; 3, strong staining). Horizontal bars, mean values. P-value derived from a one-sided Wilcoxon rank sum test.

References

    1. Embuscado EE, Laheru D, Ricci F, Yuni KJ, Witzell SD, Seigel A, et al. Immortalizing the complexity of cancer metastasis: genetic features of lethal metastatic pancreatic cancer obtained from rapid autopsy. Cancer Biol Ther. 2005;4:548–54. - PMC - PubMed
    1. Gerlinger M. Intratumor heterogeneity and branched evolution revealed by multiregion sequencing. N Engl J Med. 2012;366:883–72. - PMC - PubMed
    1. de Bruin EC, McGranahan N, Mitter R, Salm M, Wedge DC, Yates L, et al. Spatial and temporal diversity in genomic instability processes defines lung cancer evolution. Science. 2014;346:251–6. - PMC - PubMed
    1. Yachida S, Jones S, Bozic I, Antal T, Leary R, Fu BJ, et al. Distant metastasis occurs late during the genetic evolution of pancreatic cancer. Nature. 2010;467:1114–7. - PMC - PubMed
    1. Topalian SL, Drake CG, Pardoll DM. Immune checkpoint blockade: a common denominator approach to cancer therapy. Cancer Cell. 2015;27:450–61. - PMC - PubMed

MeSH terms

Substances