

Mycolates of Mycobacterium tuberculosis modulate the flow of cholesterol for bacillary proliferation in murine macrophages
- PMID: 28193630
- PMCID: PMC5392746
- DOI: 10.1194/jlr.M073171
Mycolates of Mycobacterium tuberculosis modulate the flow of cholesterol for bacillary proliferation in murine macrophages
Abstract
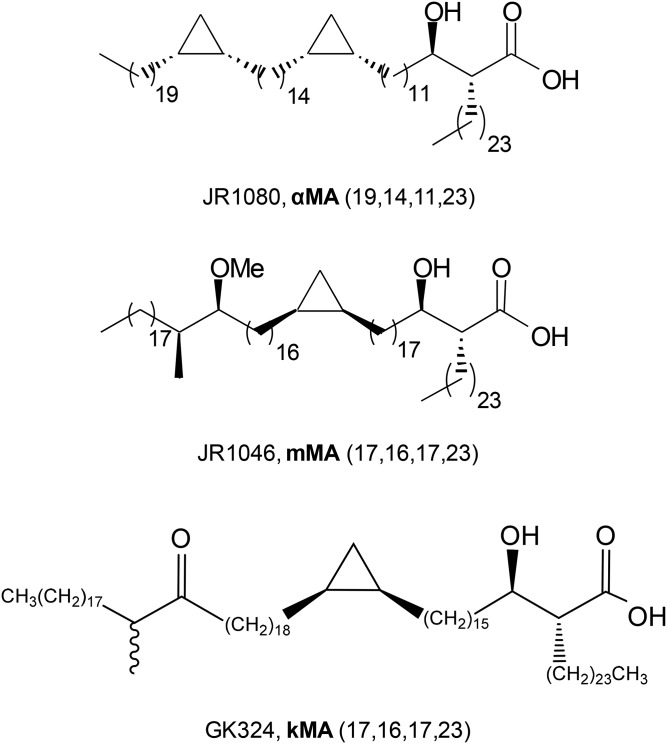
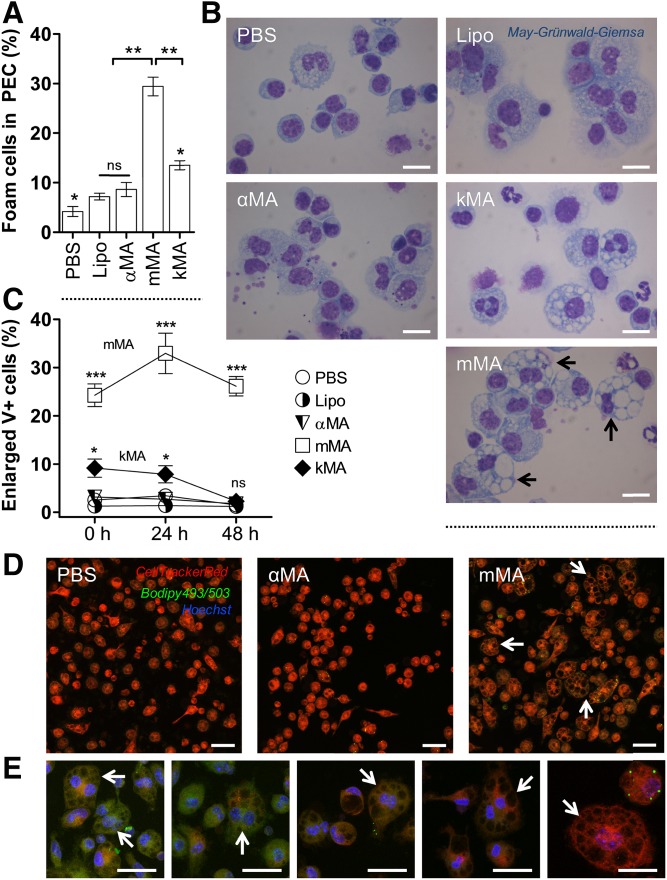
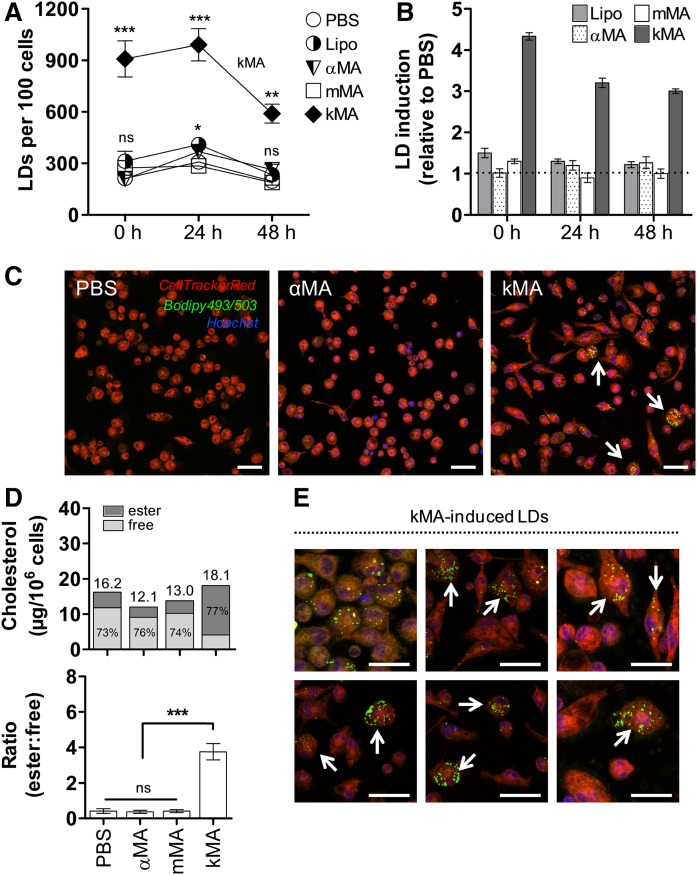
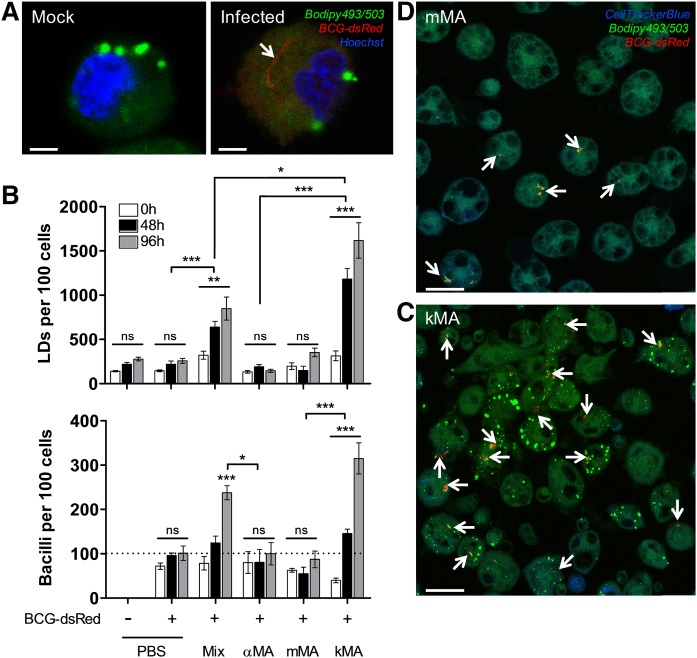
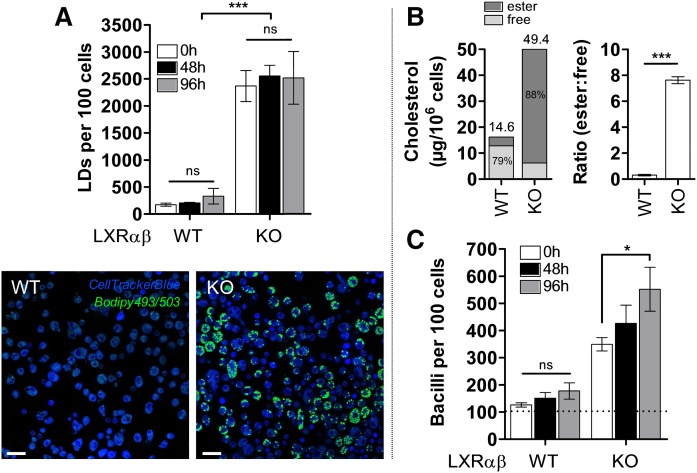
The differentiation of macrophages into lipid-filled foam cells is a hallmark of the lung granuloma that forms in patients with active tuberculosis (TB). Mycolic acids (MAs), the abundant lipid virulence factors in the cell wall of Mycobacterium tuberculosis (Mtb), can induce this foam phenotype possibly as a way to perturb host cell lipid homeostasis to support the infection. It is not exactly clear how MAs allow differentiation of foam cells during Mtb infection. Here we investigated how chemically synthetic MAs, each with a defined stereochemistry similar to natural Mtb-associated mycolates, influence cell foamy phenotype and mycobacterial proliferation in murine host macrophages. Using light and laser-scanning-confocal microscopy, we assessed the influence of MA structure first on the induction of granuloma cell types, second on intracellular cholesterol accumulation, and finally on mycobacterial growth. While methoxy-MAs (mMAs) effected multi-vacuolar giant cell formation, keto-MAs (kMAs) induced abundant intracellular lipid droplets that were packed with esterified cholesterol. Macrophages from mice treated with kMA were permissive to mycobacterial growth, whereas cells from mMA treatment were not. This suggests a separate yet key involvement of oxygenated MAs in manipulating host cell lipid homeostasis to establish the state of TB.
Keywords: confocal microscopy; foam cell; infection; lipid droplets; liver X receptor; mycolic acid; tuberculosis.
Copyright © 2017 by the American Society for Biochemistry and Molecular Biology, Inc.
Figures
Similar articles
-
Mycobacterium tuberculosis keto-mycolic acid and macrophage nuclear receptor TR4 modulate foamy biogenesis in granulomas: a case of a heterologous and noncanonical ligand-receptor pair.J Immunol. 2014 Jul 1;193(1):295-305. doi: 10.4049/jimmunol.1400092. Epub 2014 Jun 6. J Immunol. 2014. PMID: 24907344
-
Foamy macrophages from tuberculous patients' granulomas constitute a nutrient-rich reservoir for M. tuberculosis persistence.PLoS Pathog. 2008 Nov;4(11):e1000204. doi: 10.1371/journal.ppat.1000204. Epub 2008 Nov 11. PLoS Pathog. 2008. PMID: 19002241 Free PMC article.
-
Mycobacterium tuberculosis Infection-Driven Foamy Macrophages and Their Implications in Tuberculosis Control as Targets for Host-Directed Therapy.Front Immunol. 2020 May 12;11:910. doi: 10.3389/fimmu.2020.00910. eCollection 2020. Front Immunol. 2020. PMID: 32477367 Free PMC article. Review.
-
Chewing the fat: lipid metabolism and homeostasis during M. tuberculosis infection.Curr Opin Microbiol. 2016 Feb;29:30-6. doi: 10.1016/j.mib.2015.10.002. Epub 2015 Nov 3. Curr Opin Microbiol. 2016. PMID: 26544033 Review.
-
The impact of Mycobacterium tuberculosis on the macrophage cholesterol metabolism pathway.Front Immunol. 2024 May 30;15:1402024. doi: 10.3389/fimmu.2024.1402024. eCollection 2024. Front Immunol. 2024. PMID: 38873598 Free PMC article. Review.
Cited by
-
Revealing solvent-dependent folding behavior of mycolic acids from Mycobacterium tuberculosis by advanced simulation analysis.J Mol Model. 2019 Feb 14;25(3):68. doi: 10.1007/s00894-019-3943-5. J Mol Model. 2019. PMID: 30762132 Free PMC article.
-
Lack of methoxy-mycolates characterizes the geographically restricted lineage 7 of Mycobacterium tuberculosis complex.Microb Genom. 2023 May;9(5):mgen001011. doi: 10.1099/mgen.0.001011. Microb Genom. 2023. PMID: 37171244 Free PMC article.
-
The antigenicity and cholesteroid nature of mycolic acids determined by recombinant chicken antibodies.PLoS One. 2018 Aug 9;13(8):e0200298. doi: 10.1371/journal.pone.0200298. eCollection 2018. PLoS One. 2018. PMID: 30092023 Free PMC article.
-
Early cell-autonomous accumulation of neutral lipids during infection promotes mycobacterial growth.PLoS One. 2020 May 14;15(5):e0232251. doi: 10.1371/journal.pone.0232251. eCollection 2020. PLoS One. 2020. PMID: 32407412 Free PMC article.
-
Analyzing the impact of Mycobacterium tuberculosis infection on primary human macrophages by combined exploratory and targeted metabolomics.Sci Rep. 2020 Apr 27;10(1):7085. doi: 10.1038/s41598-020-62911-1. Sci Rep. 2020. PMID: 32341411 Free PMC article.
References
-
- WHO. 2015. Global Tuberculosis Report. 20th edition. World Health Organization, Geneva.
-
- Pieters J. 2008. Mycobacterium tuberculosis and the macrophage: maintaining a balance. Cell Host Microbe. 3: 399–407. - PubMed
Publication types
MeSH terms
Substances
LinkOut - more resources
Full Text Sources
Other Literature Sources
Medical
