. 2017 Mar 15;37(11):2904-2915.
doi: 10.1523/JNEUROSCI.3390-16.2017. Epub 2017 Feb 13.

Cortical Spreading Depression Closes Paravascular Space and Impairs Glymphatic Flow: Implications for Migraine Headache

Affiliations

Cortical Spreading Depression Closes Paravascular Space and Impairs Glymphatic Flow: Implications for Migraine Headache

Aaron J Schain et al. J Neurosci. .

Abstract

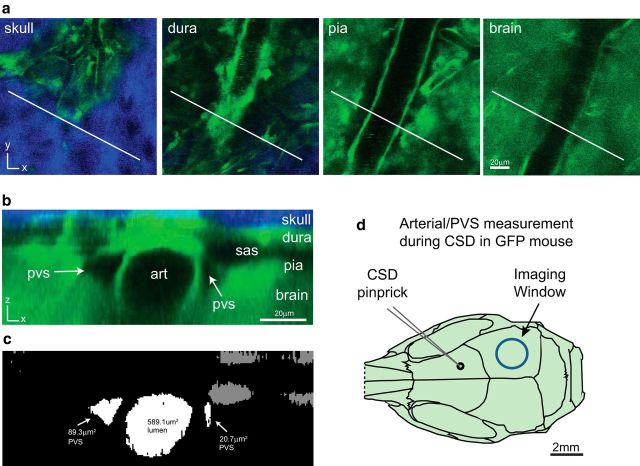
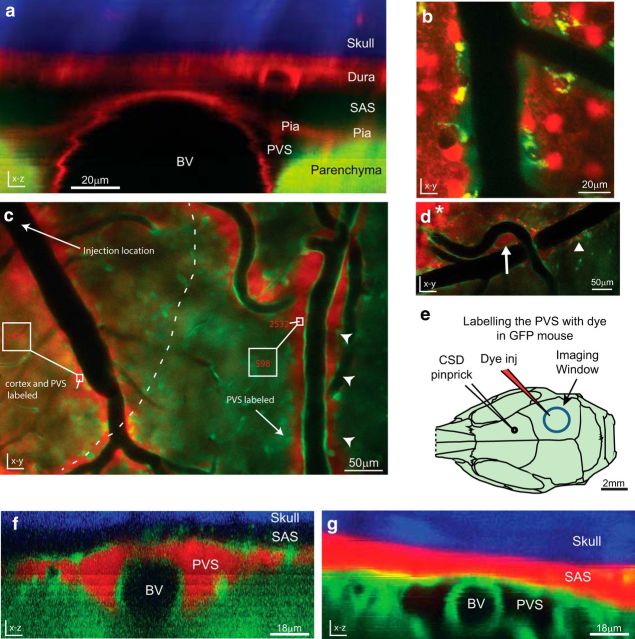
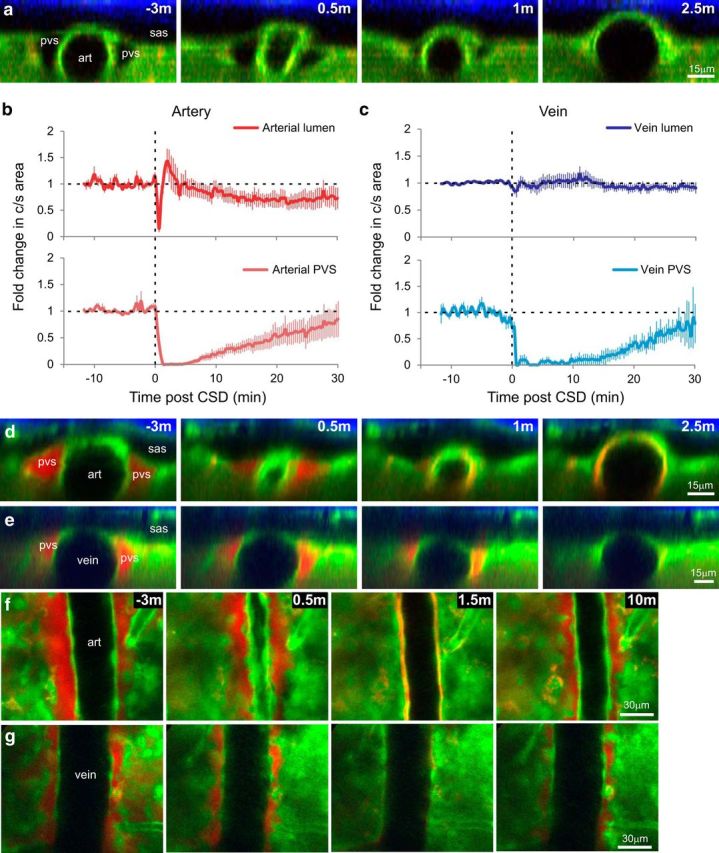
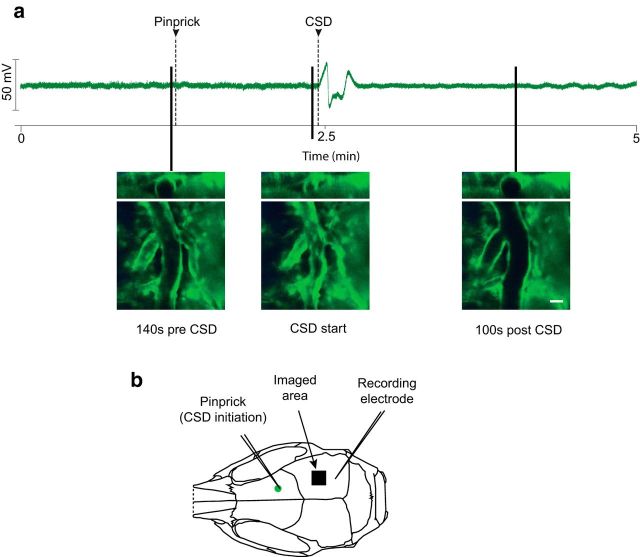
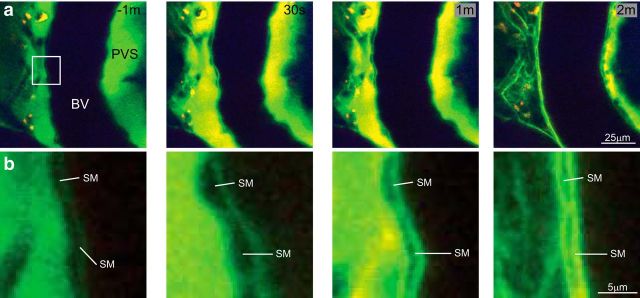
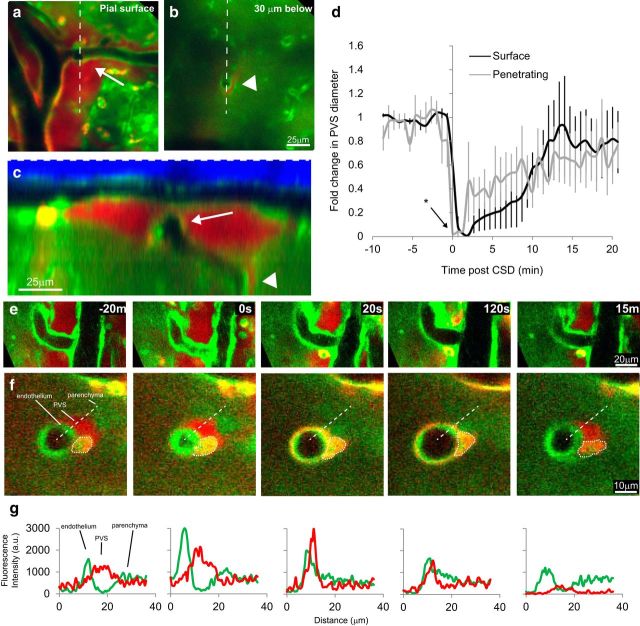
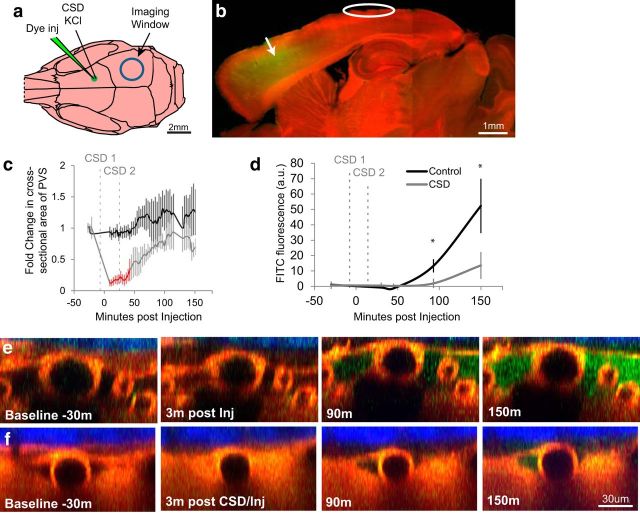
Functioning of the glymphatic system, a network of paravascular tunnels through which cortical interstitial solutes are cleared from the brain, has recently been linked to sleep and traumatic brain injury, both of which can affect the progression of migraine. This led us to investigate the connection between migraine and the glymphatic system. Taking advantage of a novel in vivo method we developed using two-photon microscopy to visualize the paravascular space (PVS) in naive uninjected mice, we show that a single wave of cortical spreading depression (CSD), an animal model of migraine aura, induces a rapid and nearly complete closure of the PVS around surface as well as penetrating cortical arteries and veins lasting several minutes, and gradually recovering over 30 min. A temporal mismatch between the constriction or dilation of the blood vessel lumen and the closure of the PVS suggests that this closure is not likely to result from changes in vessel diameter. We also show that CSD impairs glymphatic flow, as indicated by the reduced rate at which intraparenchymally injected dye was cleared from the cortex to the PVS. This is the first observation of a PVS closure in connection with an abnormal cortical event that underlies a neurological disorder. More specifically, the findings demonstrate a link between the glymphatic system and migraine, and suggest a novel mechanism for regulation of glymphatic flow.SIGNIFICANCE STATEMENT Impairment of brain solute clearance through the recently described glymphatic system has been linked with traumatic brain injury, prolonged wakefulness, and aging. This paper shows that cortical spreading depression, the neural correlate of migraine aura, closes the paravascular space and impairs glymphatic flow. This closure holds the potential to define a novel mechanism for regulation of glymphatic flow. It also implicates the glymphatic system in the altered cortical and endothelial functioning of the migraine brain.

Keywords: aura; glymph; interstitial fluid; lymph; neurodegeneration; trigeminovascular.


Figures

Figure 1.
Figure 1.
Method for anatomical characterization and quantification of arterial lumen and PVS. a, A three-dimensional image stack is obtained using two-photon microscopy through the thinned skull of a bAct-GFP mouse, with representative slices shown at the level of the skull (blue is second harmonic generation created by bone), dura, pia, and brain (green). White line represents angle and position of the orthogonal reconstruction shown in b. b, Each cranial layer [including SAS (sas)], along with the arterial lumen (art) and arterial PVS (pvs). c, To quantify cross-sectional areas of PVS and lumen, the green GFP channel is thresholded and cross-sectional areas of PVS and lumen are measured from the result. PVS and lumen areas are normalized across time points to their average baseline size to compare across mice. d, Diagram of mouse skull showing the location of frontal craniotomy, where CSD was induced by pinprick (glass micropipette, black circle), and the thinned area in parietal bone (blue circle), where pial blood vessels and PVS were imaged.
Figure 2.
Figure 2.
Functional definition of PVS. a, Orthogonal reconstruction from a GFAP-cre/mTmG mouse, which expresses red tdTomato fluorescence in all tissues except astrocytes and most neurons, which instead express GFP. In this mouse the parenchyma is green, including astrocytic endfeet; the rest of the tissue is red, and the skull is visible as blue second-harmonic generation. The PVS is bordered by the parenchyma (green), blood vessel endothelium, and pial membrane (red; representative of n = 3 mice). b, SR101-labeled astrocytes (red) also reveal the border of the FITC-dextran (green) filled PVS (n = 2). c–f, Labeling of PVS following local intracortical dye injection (n = 7). c, In vivo two-photon image from a bAct-GFP mouse taken near the site of intracortical injection of 3 kDa TRD (slightly above and to the left of the image, arrow), ∼5 min postinjection. Dye has diffused only a short distance through the cortex (dotted line) compared with the faster and farther-reaching bulk flow through PVS (arrowheads). Numbers in red represent dye intensity in the corresponding box. The labeling intensity is higher within PVS than within cortex, and decreases with distance from the injection site more in the cortex than the PVS. d, Dye from an intracortical injection (asterisk) fills both para-arterial space (arrow) and para-venous space (arrowhead), and these spaces can be shared and continuous with each other near large superficial blood vessels. e, Diagram of mouse skull as in Figure 1d, showing the location of the injection of 3 kDa TRD dye (red electrode) through a small craniotomy on the edge of the imaging window (blue circle) for PVS labeling. Dye was injected and allowed to label PVS before imaging. f, g, Orthogonal reconstructions of pial blood vessels after dye injection. f, Dye injected intracortically fills the PVS, but does not cross into the SAS, nor does it fill the blood vessel lumen (BV). g, Dye injected directly into the SAS, achieved by using an oblique angle when inserting the glass electrode, does not cross freely into the underlying PVS. (n = 3).
Figure 3.
Figure 3.
CSD causes closure of arterial and venous PVSs. a, d–g, Pre-CSD and post-CSD in vivo two-photon orthogonal (a, d, e) and XY (f, g) images of PVS near artery (art; a, d, f) and vein (e, g) in bAct-GFP mice. b, c, Quantification of CSD-induced changes in normalized cross-sectional area of lumen (top) and PVS (bottom) of arteries (b) and veins (c) pre-CSD and post-CSD measured in the uninjected mice (a). Time 0 was set at 20 s before initial arterial constriction, which lasted for 1 min and reduced cross-sectional area to 15.1 ± 6.6% of baseline. Arterial lumen then dilated for 3 min to 155 ± 18% of baseline, and constricted again, though to a lesser degree, for ≥20 min (to a minimum of 62.4 ± 12% of baseline at 22 min), while the vein lumen remained unchanged. During this period, para-arterial and paravenous spaces closed (area <1 SD of 0%) for 6 and 16 min, respectively, and partially reopened by 30 min (n = 5 arteries/PVS in 5 mice, n = 4 veins/PVS in 4 mice, error bars are ±SEM). dg, To determine what happens to PVS solutes during closure, we also examined mice in which the PVS had been dye-filled by intracortical injection of TRD (red) before CSD induction (n = 5). When PVS closes, dye appears nearer to the arterial endothelium but not in the brain parenchyma or SAS (sas).
Figure 4.
Figure 4.
Simultaneous field potential recording of CSD and imaging of pial blood vessels. a, Field potential recording of a CSD-induced mouse with representative images of pial vascular changes marked according to the timing of their occurrence. Scale bar, 20 μm (results representative of n = 3 mice). b, Experimental setup. Note imaged area is ∼0.5 mm closer to the CSD initiation site than the recording electrode.
Figure 5.
Figure 5.
Dye in the PVS during CSD. a, XY images of a pial artery during CSD postintracortical injection of 3 kDa FITC-dextran into a wild-type nonfluorescent mouse (images representative of n = 2 mice). Dye in the PVS near a blood vessel lumen (BV) appears to concentrate within the PVS ∼30 s to 1 min, and is then brightest between smooth muscle and near the endothelium when the PVS closes completely at ∼2 min. b, Detail of box indicated in a at −1 min. Smooth muscle (SM) can be seen at the border of the BV and the PVS. Note that the SM cells enlarge as the blood vessel constricts (as expected; 30 s), and that the dye is forced between and around SM cells as the PVS closes (2 min).
Figure 6.
Figure 6.
Penetrating-vessel PVS closes with dynamics similar to those of surface vessels. a, b, Two optical planes from a three-dimensional image stack from a bAct-GFP mouse whose PVS was labeled with a nearby intracortical injection of TRD that includes a surface artery with a penetrating branch. a, A surface pial artery that branches (arrow) and penetrates into the cortex. b, Artery in a as seen 30 μm below surface. c, A Y-Z orthogonal reconstruction along the dotted line in a and b shows the path of the descending artery, and the shared PVS between the surface (arrow) and penetrating (arrowhead) vessel. d, Change in PVS of surface (black) and penetrating (gray) vessel, which was quantified as linear distance between the endothelium and parenchyma, and represented as fold change from average baseline size, in nondye-injected animals. PVS changes of surface and penetrating vessels occur with a similar time course, except that closure tends to occur earlier in penetrating vessels. At the zero time point (time of maximal surface artery constriction) penetrating PVS shows a significantly greater reduction than the pial surface PVS (*p = 0.002, paired t test, n = 3). eg, CSD causes PVS closure for surface (e) and penetrating (f) artery (16 μm deeper; images of penetrating artery taken 7 s after images of surface artery were taken) in a dye-injected animal. Dotted circle in f is likely a macrophage that has taken up dye. Note that the 20 s time point shows nearly complete closure of penetrating artery PVS while surface PVS is still open. g, Color intensity (arbitrary units) profiles over the dotted line in f show how the Texas-red dextran within PVS of penetrating vessel becomes brighter as it is forced into a smaller volume. Representative of n = 3 dye-injected mice.
Figure 7.
Figure 7.
CSD impairs interstitial/glymphatic flow. Interstitial/glymphatic flow was measured by the rate at which green 3 kDa FITC-dextran (FD) dye appeared in the parieto-occipital PVS after being injected into the frontal cortex of ubiquitously fluorescent red mice, here using the tdTomato-expressing Ai14Dx strain, exemplifying fluorophore versatility in this technique. a, Diagram of mouse skull showing where CSD was induced with a crystal of KCl, and 3 kDa FITC-dextran was injected (green electrode), along with the imaging window (blue circle). b, Parasagittal view showing location and spread of FD injection in relation to imaging site. c, d, Induction of two CSDs, one before injection and one 20 min after, caused PVS to close significantly for 40 min (c, red time points), and extended the time it took for FD to reach the imaging window by ∼40 min (d), and reduced total accumulation nearly fourfold (b; * denotes p < 0.05, n = 5 control; n = 6 CSD, see Materials and Methods). e, f, Orthogonal (xz) views of pial artery and its PVS taken before and after FD injection (green) in control (e) and CSD (f) mice. Note correlation between CSD-induced PVS closure and paucity of green dye in the PVS (f).

Similar articles

Cited by

References

    1. Abbott NJ. (2004) Evidence for bulk flow of brain interstitial fluid: significance for physiology and pathology. Neurochem Int 45:545–552. 10.1016/j.neuint.2003.11.006 - DOI - PubMed
    1. Anderson K, Tinawi S, Lamoureux J, Feyz M, de Guise E (2015) Detecting migraine in patients with mild traumatic brain injury using three different headache measures. Behav Neurol 2015:693925. 10.1155/2015/693925 - DOI - PMC - PubMed
    1. Aspelund A, Antila S, Proulx ST, Karlsen TV, Karaman S, Detmar M, Wiig H, Alitalo K (2015) A dural lymphatic vascular system that drains brain interstitial fluid and macromolecules. J Exp Med 212:991–999. 10.1084/jem.20142290 - DOI - PMC - PubMed
    1. Aurora SK, Ahmad BK, Welch KM, Bhardhwaj P, Ramadan NM (1998) Transcranial magnetic stimulation confirms hyperexcitability of occipital cortex in migraine. Neurology 50:1111–1114. 10.1212/WNL.50.4.1111 - DOI - PubMed
    1. Ayata C, Lauritzen M (2015) Spreading depression, spreading depolarizations, and the cerebral vasculature. Physiol Rev 95:953–993. 10.1152/physrev.00027.2014 - DOI - PMC - PubMed

Publication types

MeSH terms