. 2017 Feb 28;114(9):2230-2234.
doi: 10.1073/pnas.1616556114. Epub 2017 Feb 13.

Contribution of epigenetic mechanisms to variation in cancer risk among tissues

Affiliations

Contribution of epigenetic mechanisms to variation in cancer risk among tissues

Michael Klutstein et al. Proc Natl Acad Sci U S A. .

Abstract

Recently, it was suggested that tissue variation in cancer risk originates from differences in the number of stem-cell divisions underlying each tissue, leading to different mutation loads. We show that this variation is also correlated with the degree of aberrant CpG island DNA methylation in normal cells. Methylation accumulates during aging in a subset of molecules, suggesting that the epigenetic landscape within a founder-cell population may contribute to tumor formation.

Keywords: aging; methylation; polycomb.


Conflict of interest statement

The authors declare no conflict of interest.

Figures

Fig. 1.
Fig. 1.
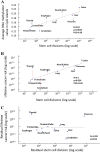
Correlation between cancer lifetime risk and tissue DNA methylation. Methylation β-value scores were calculated from patient samples (n = 803) by using the Illumina 450K methylation array platform. The average methylation score at 500 polycomb-bound CpG islands was calculated, and normalized for each patient age, resulting in an estimated average methylation value at 70 y of age for each tissue (Fig. S1 and Materials and Methods). This value was plotted against cancer lifetime risk (in log scale), as calculated for each tissue (Materials and Methods), resulting in a Pearson correlation coefficient of 0.75 (P = 0.0006), and a Spearman correlation of 0.70 (P = 0.002) with the percentage of variance (PVE) being 0.56. It should be noted that the calculation of β value is a close approximation of percent methylation (36).
Fig. S1.
Fig. S1.
DNA methylation at CpG islands as a function of age. Methylation levels of polycomb-bound CpG Islands as a function of age in tissues from individual patients. Data obtained by using the Illumina 450K platform was compiled from TCGA or GEO databases and subject to linear regression analysis (Materials and Methods).
Fig. S2.
Fig. S2.
CpG island sensitivity analysis. The graph in Fig. 1 was reconfigured by using different numbers of CpG islands with the highest H3K27me3 signal as measured in human ES cells (Materials and Methods) to obtain the Pearson correlation (A) and P value (B). Note that the Pearson correlation remains statistically significant over the full range of island number. (C) Pearson correlations for the select 500 CpG islands with the highest levels of H3K27me3 as derived from different individual tissue types. There is considerable overlap when these sets are compared with the original 500 islands found in hES cells. As a control, lifetime cancer risk compared with average DNA methylation over the 500 CpG islands with the lowest H3K27me3 levels showed no significant correlation (R = 0.4, P = 0.11).
Fig. S3.
Fig. S3.
Sensitivity and bootstrap analysis. (A) The data in Fig. 1 were reconfigured by using methylation data (Fig. S1) to obtain the Pearson correlation for different extrapolated ages (P < 10−3 for the ages included in the region marked by the horizontal line). (B) The data in Fig. 1 was reconfigured by using methylation data calculated from all of the different combinations of 15 of 17 tissues (Materials and Methods) to obtain the Pearson correlations (P < 0.05 for all combinations). (C) Bootstrap analysis was performed on the data shown in Fig. 1 by using 1,000 iterations over all tissues to obtain the Pearson correlation. Note that >99% of the analyses remained statistically significant (P < 0.01).
Fig. S4.
Fig. S4.
Residual analysis. (A) Methylation β value score was plotted against stem-cell division number (1). Pearson correlation = 0.81 (P = 0.0045). Dotted red lines represent the residual methylation value not explained by cell division number. Note that only tissues for which there are both methylation and stem-cell division data were used in this graph. (B) Cancer lifetime risk for each tissue (Materials and Methods) was plotted against stem-cell division number calculated for each tissue (Materials and Methods). Pearson correlation = 0.70 (P = 0.02). Dotted red lines represent the residual lifetime risk that cannot be explained by stem-cell division number. (C) Residual stem-cell division number plotted against residual lifetime risk as calculated from A and B. Pearson correlation = -0.03 (P = 0.93).
Fig. 2.
Fig. 2.
Statistical modeling. (A) Residual cancer lifetime risk (i.e., effect not explained by stem-cell division number per tissue) vs. residual methylation (i.e., methylation not explained by correlation with stem-cell division number) as derived from the data in Fig. S4A. Here, we plot the 10 tissues for which all datasets were measured. This comparison is described by a Pearson correlation coefficient of 0.74 (P = 0.014). (B) Linear regression modeling of the statistical link among DNA methylation, cancer lifetime risk, and stem-cell divisions (Materials and Methods). Each arrow marks the percent of variance (PVE, R-squared) of the destination variable, explained by a linear model of the origin variable. For example, stem-cell division number explains 49% of the variance in cancer life time risk estimates over the different tissues (PVE = R2 = (0.7)2). The two-headed arrow signifies the cancer lifetime risk PVE given a multiple linear model of both DNA methylation and cell division number per tissue. P values calculated for each correlation: division vs. risk: P = 0.024; division vs. methylation: P = 0.0045; methylation vs. risk: P = 0.0008; divisions and methylation vs. risk: P = 0.0057. The PVE for DNA methylation vs. lifetime cancer risk (0.77) differs from that shown in Fig. 1 (0.56) because the analysis in Fig. 2 was based on the subset of tissues for which there is also data for cell division number (Table S1).
Fig. S5.
Fig. S5.
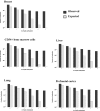
Molecular distribution of tissue DNA methylation. Molecular distribution of methylation in the top 500 polycomb-bound CpG islands (Fig. 1) from different tissues showing the frequency of molecules having 0–5 of 5 CpG methylations compared with expected (Materials and Methods). Although this analysis was restricted to molecules with five CpGs, it should be noted that Miseq bisulfite data of whole CpG islands suggests that molecules containing even a single stretch of five methylated CpGs are, on average, more than 70% methylated (11). This observation suggests that RRBS analysis is highly representative of the entire island. The average nonage corrected level of DNA methylation for the CpG islands covered in this analysis ranges from 3.4% in CD34+ cells to 6.5% in liver.
Fig. S6.
Fig. S6.
Cancer hypermethylation in driver genes. Box-and-whisker plots showing distribution of methylation in normal and cancerous tissue in multiple tissues from TCGA in three polycomb-bound CpG islands in the promoter regions of tumor suppressor genes, known to be cancer drivers (37). Boxes depict the interquartile range (IQR) and whiskers extend to the farthest point within 1.5 × IQR. Each plot shows the name of the relevant gene and the hg19 genome coordinates of the CpG island analyzed.

References

    1. Tomasetti C, Vogelstein B. Cancer etiology. Variation in cancer risk among tissues can be explained by the number of stem cell divisions. Science. 2015;347(6217):78–81. - PMC - PubMed
    1. Danaei G, Vander Hoorn S, Lopez AD, Murray CJ, Ezzati M. Comparative Risk Assessment collaborating group (Cancers) Causes of cancer in the world: Comparative risk assessment of nine behavioural and environmental risk factors. Lancet. 2005;366(9499):1784–1793. - PubMed
    1. Fearon ER. Human cancer syndromes: Clues to the origin and nature of cancer. Science. 1997;278(5340):1043–1050. - PubMed
    1. Wu S, Powers S, Zhu W, Hannun YA. Substantial contribution of extrinsic risk factors to cancer development. Nature. 2016;529(7584):43–47. - PMC - PubMed
    1. Feinberg AP, Ohlsson R, Henikoff S. The epigenetic progenitor origin of human cancer. Nat Rev Genet. 2006;7(1):21–33. - PubMed

Publication types

MeSH terms

LinkOut - more resources