. 2017 Feb 28;114(9):2319-2324.
doi: 10.1073/pnas.1611958114. Epub 2017 Feb 13.

Essential role of immobilized chemokine CXCL12 in the regulation of the humoral immune response

Affiliations

Essential role of immobilized chemokine CXCL12 in the regulation of the humoral immune response

Aleksandr Barinov et al. Proc Natl Acad Sci U S A. .

Abstract

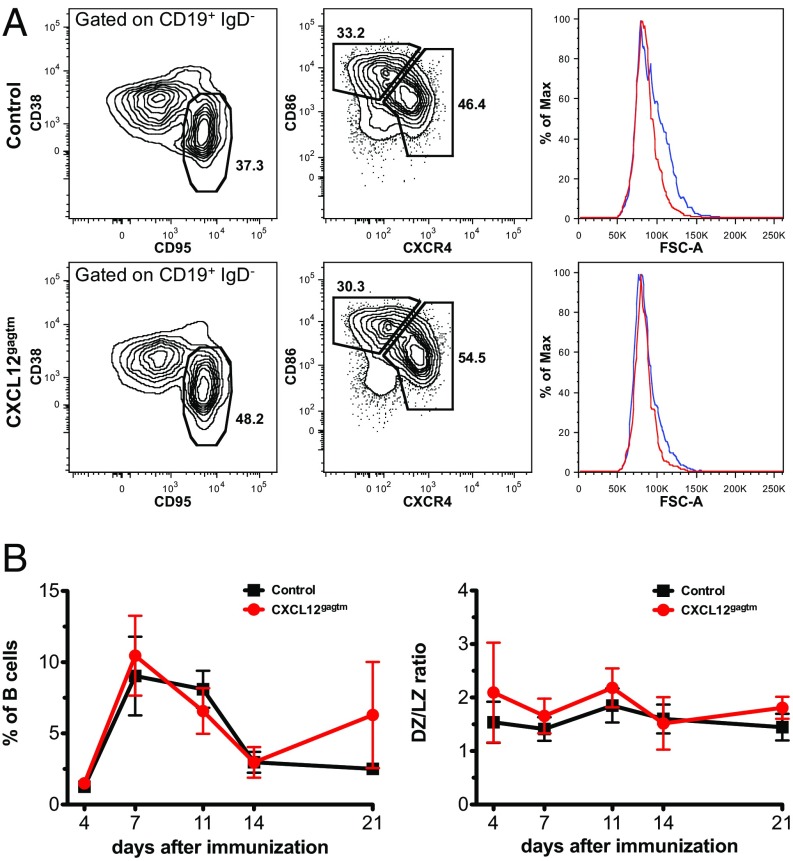
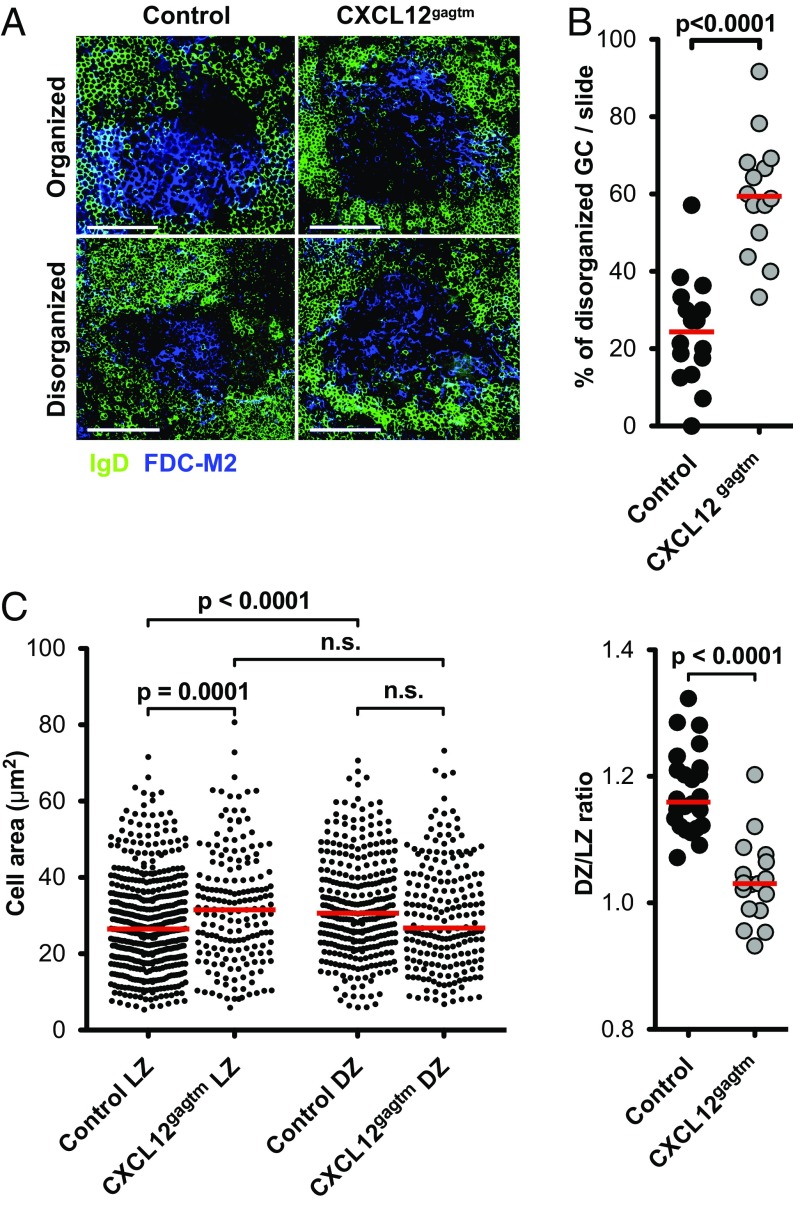
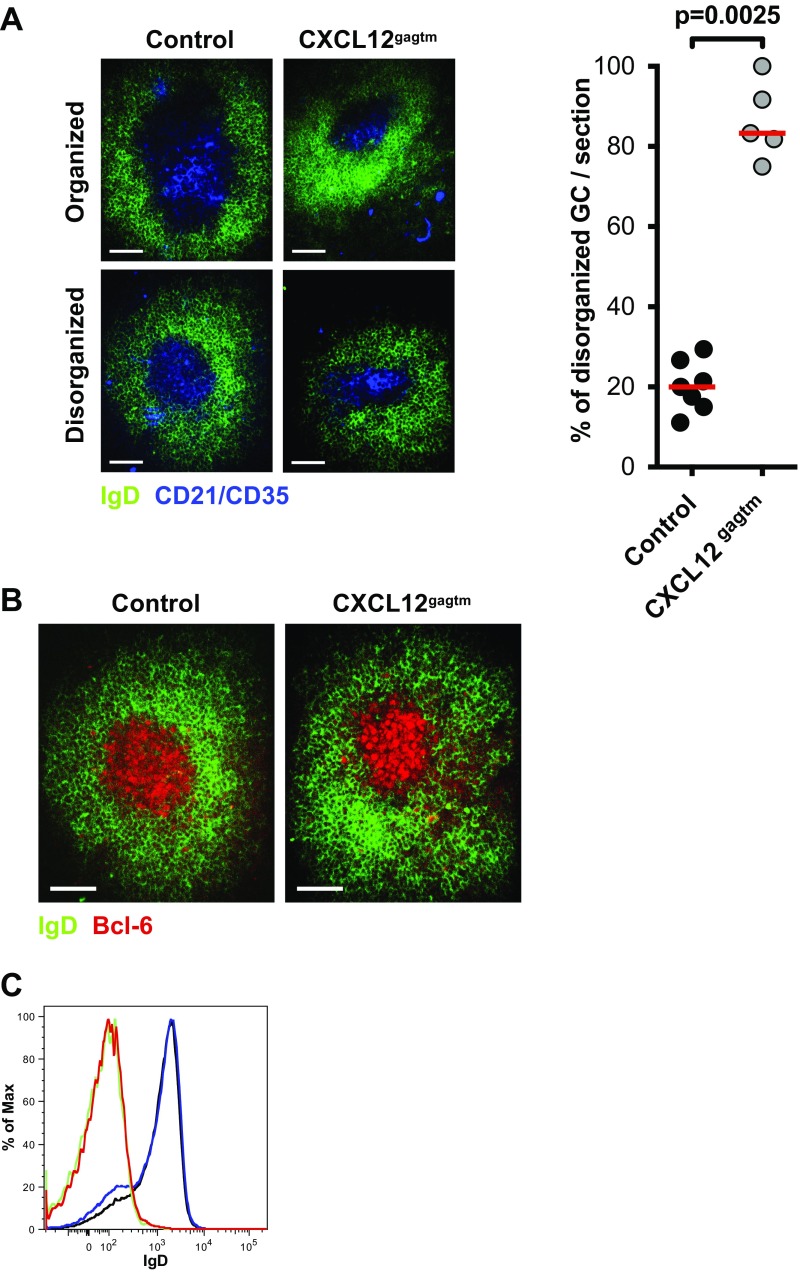
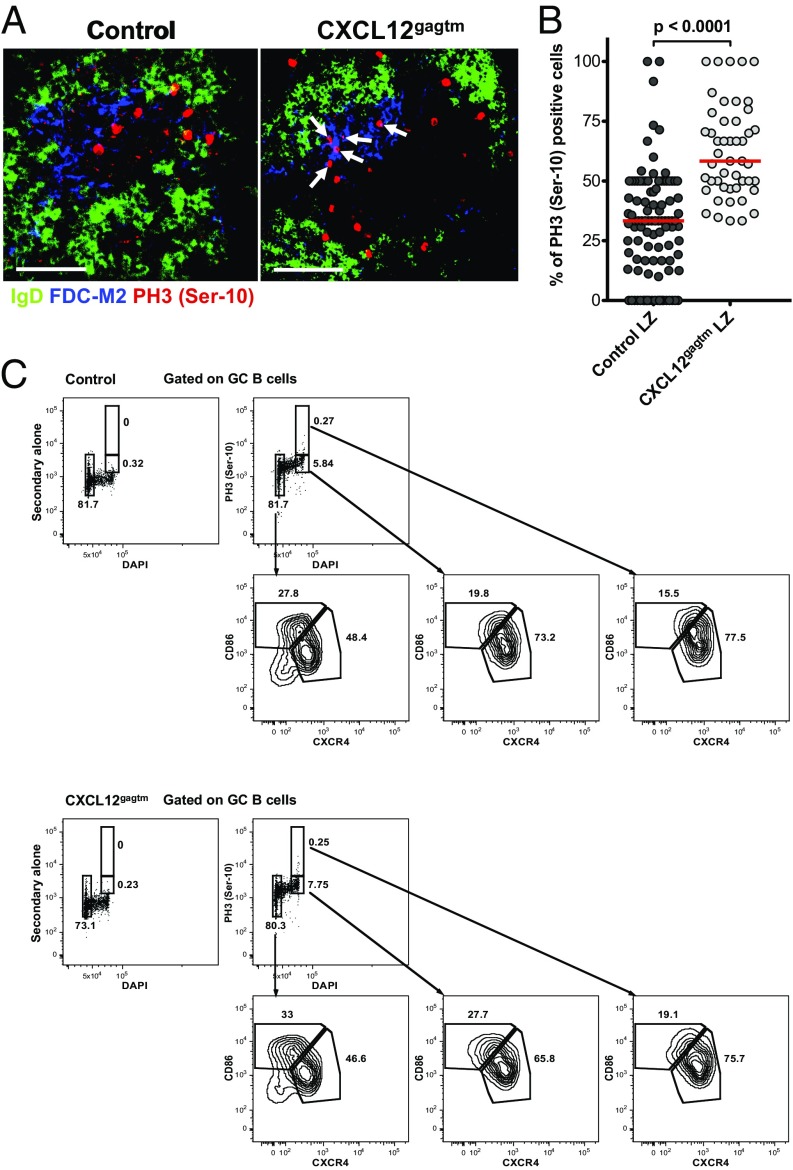
Chemokines control the migration of a large array of cells by binding to specific receptors on cell surfaces. The biological function of chemokines also depends on interactions between nonreceptor binding domains and proteoglycans, which mediate chemokine immobilization on cellular or extracellular surfaces and formation of fixed gradients. Chemokine gradients regulate synchronous cell motility and integrin-dependent cell adhesion. Of the various chemokines, CXCL12 has a unique structure because its receptor-binding domain is distinct and does not overlap with the immobilization domains. Although CXCL12 is known to be essential for the germinal center (GC) response, the role of its immobilization in biological functions has never been addressed. In this work, we investigated the unexplored paradigm of CXCL12 immobilization during the germinal center reaction, a fundamental process where cellular traffic is crucial for the quality of humoral immune responses. We show that the structure of murine germinal centers and the localization of GC B cells are impaired when CXCL12 is unable to bind to cellular or extracellular surfaces. In such mice, B cells carry fewer somatic mutations in Ig genes and are impaired in affinity maturation. Therefore, immobilization of CXCL12 is necessary for proper trafficking of B cells during GC reaction and for optimal humoral immune responses.

Keywords: CXCL12; germinal center reaction; humoral immune responses.


Conflict of interest statement

The authors declare no conflict of interest.

Figures

Fig. S1.
Fig. S1.
B-cell subsets in the bone marrow and spleen of control and CXCL12gagtm mice. (A) Frequencies of Pro/Pre (B220+ CD43+ IgM IgD), immature (B220+ IgM+ IgDlow-neg), and mature B cells (B220+ IgMlow IgD+) in the bone marrow of control and CXCL12 mutant mice were evaluated by flow cytometry. The graph shows the percentage of each subpopulation among B220+ cells. Data are from two independent experiments with a total of 10 mice per group. Statistical significance was assessed by a two-way ANOVA test. (B, Left) Representative flow cytometry dot plots showing the percentage of CD138+ plasma cells in the BM of control (Upper) and CXCL12gagtm (Lower) mice. (Right) Number of antibody-secreting cells in the BM of control and mutant mice at 10 to 11 wk of age as determined by ELISPOT assays. Data are from one representative experiment with five mice per group out of two performed. (C) Frequency of splenic follicular (B220+ CD93 CD21low-neg IgMlow), transitional (B220+ CD93+), and marginal zone (B220+ CD93 CD21+ IgM+) B cells. The graph shows the percentage of each subpopulation among B220+ cells. (D) Frequency of CD138+ plasma cells in the spleen of control and CXCL12gagtm mice as evaluated by flow cytometry. Data from C and D are from two independent experiments with a total of 10 mice per group. (E) Histograms indicate FSC profiles of control (black) and CXCL12gagtm (green) LZ GC B cells from the gates shown in Fig. 1 A, Middle.
Fig. 1.
Fig. 1.
Magnitude and kinetics of germinal center reaction in CXCL12gagtm mice. (A) Flow cytometry analysis of splenic GC B cells. (Left) The percentage of GC B cells (CD38low CD95high) among CD19+ IgD splenocytes from control (Upper) and CXCL12gagtm (Lower) mice 7 d after SRBC immunization. (Middle) Percentage of dark zone (CXCR4high CD86low) and light zone (CXCR4low CD86high) cells in the GC gate shown on the Left. (Right) Histograms indicate forward scatter (FSC) profiles of DZ (blue) and LZ (red) cells in the gates shown in Middle. Mean FSC intensity in control DZ = 89.3k (±2.6k), LZ = 83.6k (±1.9k) (n = 5, P = 0.0045); mean FSC in CXCL12gagtm DZ = 87.2k (±1.2k), LZ = 84.3k (±1.1k) (n = 5, P = 0.0037). Statistical significance determined by Student’s t test. (B) Kinetics of the splenic GC reaction after immunization with SRBC (Left), and DZ/LZ ratios for the corresponding time points (Right) in one representative experiment out of three performed. Data are from 3 to 11 mice per time point and are shown as mean ± SD.
Fig. 2.
Fig. 2.
Structure of GC and analysis of B-cell size. (A) Representative spleen sections showing organized and disorganized GCs 7 d after immunization with SRBC. Sections were stained with IgD (green) to identify the GC and FDC-M2 (blue) to delineate the LZ. In organized GCs, a clear discrimination between LZ and DZ areas can be made (Upper); in disorganized GCs, the discrimination is not evident (Lower). One representative GC of each type from eight control and seven CXCL12gagtm mice is shown. (Scale bars: 50 µm.) (B) Percentage of disorganized GCs per slide 7 d after immunization. Sixteen slides in eight control mice (202 GC), and 14 slides in seven CXCL12gagtm mice (219 GC) were analyzed blind. Red bars indicate the median values in each group. Statistical significance was determined by Mann-–Whitney test. (C, Left) Surface areas of individual B cells in the LZ and DZ of organized GC. Data from one representative experiment out of two performed. Each point corresponds to one cell in 15 control and 8 CXCL12gagtm GCs from four control and three CXCL12gagtm mice. Statistical significance determined by Student’s t test. (Right) Ratio between DZ/LZ mean surface areas calculated in individual GC. Data are pooled from two independent experiments with a total of 27 control and 17 CXCL12gagtm GCs from eight control and seven CXCL12gagtm mice. Red bars indicate the median values in each group. Statistical significance was determined by Mann-–Whitney test.
Fig. S2.
Fig. S2.
Structure of GC in control and CXCL12gagtm mice. (A, Left) Representative spleen sections showing organized and disorganized GCs 7 d after immunization with SRBC. Sections were stained with IgD (green) to identify the GC, and CD21/35 (blue) to delineate the LZ. In organized GCs, a clear discrimination between LZ and DZ areas can be made (Upper); in disorganized GCs, the discrimination is not evident (Lower). One representative GC of each type from three control and three CXCL12gagtm mice is shown. (Scale bars: 50 µm.) (Right) Percentage of disorganized GCs/slide 7 d after immunization. Seven sections in three control mice (107 GC) and five sections in three CXCL12gagtm mice (48 GC) were analyzed blind. Red bars indicate the median values in each group. Statistical significance was determined by Mann–Whitney test. (B) Spleen cryosections showing a representative GC from three control (Left) and three CXCL12gagtm (Right) mice on day 7 of SRBC immunization after staining with IgD (green) and Bcl-6 (red). (Scale bars: 50 µm.) (C) Histograms showing IgD expression in GC (CD19+ CD38 CD95+) and total splenic B cells (CD19+) in control and CXCL12gagtm mice from Fig. 1. Green line, control GC B cells; red line, CXCL12gagtm GC B cells; black line, control total splenic B cells; blue line, CXCL12gagtm total splenic B cells.
Fig. S3.
Fig. S3.
Strategy to analyze individual B-cell areas using ICY software. (A) The color images of spleen sections stained for IgD, FDC-M2, and B220 were split into separate color channels. The region of interest (ROI) for germinal center was delineated on the IgD channel (IgD area in green), the ROI for the LZ was delineated on the FDC-M2 channel (FDC-M2+ area in green), and the ROI for DZ was defined by the LZ ROI minus the GC ROI. B-cell contours were analyzed inside LZ and DZ regions in the B220 channel using ICY software. (B) Cellular density in the GC LZ was calculated in 12 control (four mice) and 9 CXCL12gagtm (three mice) GCs and plotted as number of cells per 100 µm2. Statistical significance was determined by Mann–Whitney test.
Fig. 3.
Fig. 3.
Mitotic cells in the LZ of mutant mice. (A) Spleen sections 7 d after SRBC immunization. IgD (green), FDC-M2 (blue), phospho-histone H3 (red). Arrows point to PH3+ cells in the LZ. One representative GC from seven control and six CXCL12gagtm mice out of 152 organized GCs analyzed is shown. (Scale bars: 50 µm.) (B) The plot shows the proportion of total GC PH3 Ser-10+ B cells that are localized in the LZ compartment of organized GCs. PH3 Ser-10–positive GC B cells from A were counted in LZ and DZ compartments from 104 control (1,039 cells) and 48 CXCL12gagtm GCs (658 cells) and plotted as the percentage of LZ-localized PH3 Ser-10+ cells in individual organized GCs. Data pooled from two independent experiments. Red bars show the median; statistical significance was determined by Mann–Whitney test. (C) Splenic GC B cells from a pool of three control (Upper) and 3 CXCL12gagtm (Lower) mice 7 d after SRBC immunization were assessed for PH3 Ser-10, DNA content, CD86 and CXCR4 expression. Data are from one representative experiment out of two. Upper Left plots are negative controls with secondary antibody alone.
Fig. S4.
Fig. S4.
Flow cytometry analysis of splenic GC B cells for the expression of phospho-histone H3 (Ser-28). Splenic GC B cells from the pool of three control (A) and three CXCL12gagtm (B) mice 7 d after SRBC immunization were assessed by flow cytometry for PH3 Ser-28, DNA content, CD86 and CXCR4 expression. Data are from one representative experiment out of two performed. Black boxes highlight the gates used to evaluate CD86 and CXCR4 expression.
Fig. S5.
Fig. S5.
Analysis of the light and dark zone BrdU-labeled GC B cells by flow cytometry and immunofluorescence. (A) Flow cytometry analysis of splenic GC B cells from control (Upper) and CXCL12gagtm (Lower) mice at day 7 of SRBC immunization and a 5-h pulse labeling with 2.5 mg of BrdU. Histograms on the Left show the frequency of BrdU+ GC B cells. Contour plots indicate the DZ/LZ phenotype in BrdU-negative (Middle) and BrdU-positive (Right) GC B cells. Immunized, non-BrdU–injected mice were used as negative controls for the BrdU staining. Data are from one representative mouse out of five control and four CXCL12gagtm mice analyzed. (B) Spleen cryosections, from control (Upper) and CXCL12gagtm (Lower) mice at day 7 of SRBC immunization and a 5-h pulse labeling with 2.5 mg of BrdU, were stained for IgD (blue), CD21/CD35 (red), and BrdU (green). Images depict the staining patterns for each channel separately and as merged image (Rightmost). White lines on the IgD channel delineate the borders of the GC (IgD area). The CD21/35 channel was used to delineate LZ (CD21/35+ red area) and DZ (CD21/35 area). The distribution of the BrdU+ cells in the DZ and the LZ is shown on the BrdU channel. One representative GC from seven control and seven CXCL12gagtm mice analyzed in two independent experiments is shown. (Scale bars: 100 µm.)
Fig. 4.
Fig. 4.
Somatic hypermutation in GC B cells. (A) VH186.2 gene mutations in λ1+ IgG1+ GC B cells from control and CXCL12gagtm mice on day 13 after immunization with NP35-CGG. Data are grouped from two independent experiments, each including three control and three CXCL12gagtm mice. Results are presented as number of mutations per sequence. A total of 104 control and 80 CXCL12gagtm sequences were analyzed. Red bars indicate the median. Statistical significance determined by Mann–Whitney test. (B) Frequency of clones with the W33L substitution in the VH186.2 gene from A. Statistical significance determined by Fisher's exact test.
Fig. 5.
Fig. 5.
Impaired affinity maturation in CXC12gagtm mice. (A) ELISA for high-affinity NP4-specific IgG1 in serum from control and CXC12gagtm mice at the indicated time points after immunization with NP35-CGG. (B) Ratio of NP4- and NP29-specific IgG1 titers. Data are from one representative experiment out of two and are presented as mean ± SEM from four control and five CXC12gagtm mice per time point. *P < 0.05; **P < 0.01 as determined by the two-way ANOVA test.

Similar articles

Cited by

References

    1. Cyster JG. Chemokines and cell migration in secondary lymphoid organs. Science. 1999;286(5447):2098–2102. - PubMed
    1. Campbell JJ, et al. Chemokines and the arrest of lymphocytes rolling under flow conditions. Science. 1998;279(5349):381–384. - PubMed
    1. Laguri C, Arenzana-Seisdedos F, Lortat-Jacob H. Relationships between glycosaminoglycan and receptor binding sites in chemokines-the CXCL12 example. Carbohydr Res. 2008;343(12):2018–2023. - PubMed
    1. Schumann K, et al. Immobilized chemokine fields and soluble chemokine gradients cooperatively shape migration patterns of dendritic cells. Immunity. 2010;32(5):703–713. - PubMed
    1. Laguri C, et al. The novel CXCL12gamma isoform encodes an unstructured cationic domain which regulates bioactivity and interaction with both glycosaminoglycans and CXCR4. PLoS One. 2007;2(10):e1110. - PMC - PubMed

Publication types

MeSH terms