. 2017 Feb 28;114(9):2389-2394.
doi: 10.1073/pnas.1616332114. Epub 2017 Feb 13.

TMEM175 deficiency impairs lysosomal and mitochondrial function and increases α-synuclein aggregation

Affiliations

TMEM175 deficiency impairs lysosomal and mitochondrial function and increases α-synuclein aggregation

Sarah Jinn et al. Proc Natl Acad Sci U S A. .

Abstract

Parkinson disease (PD) is a neurodegenerative disorder pathologically characterized by nigrostriatal dopamine neuron loss and the postmortem presence of Lewy bodies, depositions of insoluble α-synuclein, and other proteins that likely contribute to cellular toxicity and death during the disease. Genetic and biochemical studies have implicated impaired lysosomal and mitochondrial function in the pathogenesis of PD. Transmembrane protein 175 (TMEM175), the lysosomal K+ channel, is centered under a major genome-wide association studies peak for PD, making it a potential candidate risk factor for the disease. To address the possibility that variation in TMEM175 could play a role in PD pathogenesis, TMEM175 function was investigated in a neuronal model system. Studies confirmed that TMEM175 deficiency results in unstable lysosomal pH, which led to decreased lysosomal catalytic activity, decreased glucocerebrosidase activity, impaired autophagosome clearance by the lysosome, and decreased mitochondrial respiration. Moreover, TMEM175 deficiency in rat primary neurons resulted in increased susceptibility to exogenous α-synuclein fibrils. Following α-synuclein fibril treatment, neurons deficient in TMEM175 were found to have increased phosphorylated and detergent-insoluble α-synuclein deposits. Taken together, data from these studies suggest that TMEM175 plays a direct and critical role in lysosomal and mitochondrial function and PD pathogenesis and highlight this ion channel as a potential therapeutic target for treating PD.

Keywords: Parkinson disease; TMEM175; lysosome; mitochondria; α-synuclein.


Conflict of interest statement

Conflict of interest statement: All of the authors are employed by Merck & Co.

Figures
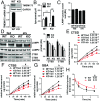
Fig. 1.
Fig. 1.
Unstable lysosomal pH and reduced lysosomal enzyme activity in TMEM175 KO cells (A) Western blotting and quantitative real-time PCR (qRT-PCR) showing levels of TMEM175 in SH-SY5Y WT and TMEM175 KO cells. (B) Lysosomal pH of WT and KO was measured in fed (white) and starved (stv, black, EBSS 3 h) conditions (n = 6). (C) Number of LAMP1+ lysosomes determined by immunohistochemistry and shown relative to WT (n = 5–7). (D) Protein levels of lysosomal CTSD and CTSB were quantified by Western blotting (Left) and shown normalized to glyceraldehyde 3-phosphate dehydrogenase (GAPDH) (Right, faster migrating LAMP1 in the second row is indicated with red asterisk) (n = 4). (E–G) Lysosomal enzyme activity of CTSD, CTSB, and GBA was determined by the relative fluorescence from enzyme activities of crude lysosomal fractions of WT and KO cells in fed (black) and starved (red) conditions (n = 3–4). Relative fluorescence as a function of time was fit to first order reaction with rate constants, k, for each group indicated on the right. (H) Relative intensity of HPG-labeled proteins after incorporation of HPG was plotted as a function of time and fit to one phase exponential decay (n = 3–5). The rate constant k is indicated on the right. Data are given in relative units (RU). Data presented are mean + SEM. Two-way ANOVA in B, D, E–H; Bonferroni's test in C, *P < 0.05, **P < 0.01, and ***P < 0.001 WT vs. KO.
Fig. S1.
Fig. S1.
Unstable lysosomal pH and impaired lysosomal enzyme activity in TMEM175-depleted rat hippocampal neurons. (A) Levels of TMEM175 mRNA from rat hippocampal cells treated with control siRNA (siCTL) or TMEM175 targeting siRNA (siTM175) were measured by qRT-PCR (n = 20). (B) Lysosomal pH was measured from rat hippocampal neurons treated with control siRNA (siCTL) or TMEM175 mRNA targeting siRNAs (siTM175) in fed (white) and starved (stv, black, EBSS 4 h) conditions (n = 6). (C) Number of LAMP1+ lysosomes determined by immunohistochemistry and shown relative to WT (n = 6). (D) Protein levels of lysosomal CTSD and CTSB were determined by Western blotting and presented normalized to GAPDH (n = 4; Right). (E–G) Lysosomal CTSD (E), CTSB (F), and GBA (G) activity were measured in fed (black) and starved (red) conditions (n = 3). (H) Relative intensity of HPG-labeled proteins after incorporation of HPG was plotted as a function time and fit to one-phase exponential decay. Rate constant k is indicated on the right (n = 4–5). Data are given in relative units (RU). Data presented are mean + SEM. Student t test in A; two-way ANOVA in B and E–H, Mann–Whitney test in C. *P < 0.05, **P < 0.01, and ***P < 0.001. siCTL vs. siTM175.
Fig. 2.
Fig. 2.
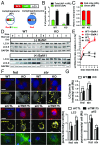
TMEM175 deficiency leads to accelerated autophagosome–lysosome fusion and impairs clearance of autophagosome. (A) Schematic describing autophagosome–lysosome fusion assay with the RFP- and GFP-tagged LC3 construct transfected into WT and TMEM175 KO cells. (B) The number of green and total LC3 puncta from WT and KO cells was quantified (n = 5). (C) Ratio of GFP puncta or RFP only puncta to total is quantified (n = 5). (D and E) Level of autophagy substrate LC3 was measured at indicated time points by Western blotting in WT and KO cells with or without bafilomycin A1 (100 nM). Quantified ratio of LC3-II to LC3-I relative to time = 0 is shown (n = 4). Extra space between LC3-I and LC3-II was cropped to improve the clarity of images. (F and G) Autophagosome-associated LC3 puncta [red, Top, 5-h starvation, SH-SY5Y; Middle, 4-h starvation, rat hippocampal neurons treated with control (siCTL) or TMEM175 targeting (siTM175) shRNA], and p62 puncta (green, Bottom, rat hippocampal neurons) in fed and starved conditions were assessed by immunohistochemistry. Black and white contrast images of LC3 were highlighted with puncta quantified (yellow) (F). Quantified intensity of each puncta is plotted (n = 5) (G). (Scale bars, 10 μm.) Data presented are mean + SEM. Two-way ANOVA in B, E, G; Mann–Whitney test in C, *P < 0.05, **P < 0.01, and ***P < 0.001. WT vs. KO or siCTL vs. siTM175.
Fig. S2.
Fig. S2.
TMEM175 deficiency results in accumulation of autophagy substrate by the inefficient degradation in the lysosome. (A) Autophagosome-associated LC3 puncta from SH-SY5Y WT and KO cells were assessed by immunohistochemistry at the indicated time points after starvation with or without bafilomycin A1 (100 nM, ±BafA1). Puncta intensity was quantified (Right) (n = 4). (Scale bar, 10 μm.) (B) Protein levels of p62, LC3-I, and LC3-II at fed and starved conditions were quantified from rat hippocampal neurons treated with control siRNA (siCTL) or TMEM175 mRNA targeting siRNAs (siTM175) by Western blotting and values were normalized to GAPDH (n = 4) (Right). LC3-II* indicates a longer exposure. Data presented are mean + SEM. Two way ANOVA, *P < 0.05, **P < 0.01 and ***P < 0.001. WT vs. KO or siCTL vs. siTM175.
Fig. 3.
Fig. 3.
Mitochondrial respiration is decreased by TMEM175 depletion. (A) OCR of SH-SY5Y WT and TMEM175 KO cells were measured in real time. (B) Basal OCR and the difference between FCCP-induced OCR and Oligomycin A-induced OCR were plotted (n = 9–11). (C) Total intracellular ATP normalized to protein was plotted (n = 9). (D and E) Representative images of MitoTracker Red staining of siCTL and siTM175-treated rat hippocampal neurons were shown (D). (Scale bar, 50 μm.) Quantification of intensity, area and number of MitoTracker Red puncta in neurites was plotted (E) (n = 6). Data presented are mean + SEM. Mann–Whitney test in B and C; two-way ANOVA in E, *P < 0.05, **P < 0.01, and ***P < 0.001. WT vs. KO or siCTL vs. siTM175.
Fig. S3.
Fig. S3.
Mitochondrial respiration is decreased by TMEM175 depletion. (A and B) OCR of WT or KO cells was measured in real time with FCCP concentrations in the range of 0.1 μM to 1 μM (A). The difference between FCCP-induced OCR and Oligomycin A-induced OCR at FCCP concentrations from 0.03 μM to 10 μM was plotted (n = 9–11) (B). (C and D) OCR of control siRNA (siCTL) or TMEM175 siRNAs-treated (siTM175) rat hippocampal neurons was measured in real time (C). Difference between FCCP-induced OCR and Oligomycin A-induced OCR from a representative experiment was plotted (n = 11) (D). (E) Total intracellular ATP normalized to protein was plotted (n = 13). Data presented are mean + SEM. Two-way ANOVA in B; Mann–Whitney test in D and E. *P < 0.05, **P < 0.01 and ***P < 0.001. WT vs. KO or siCTL vs. siTM175.
Fig. 4.
Fig. 4.
TMEM175 deficiency increases phosphorylated α-synuclein aggregates in rat primary hippocampal neurons. (A) Diagram depicting the experimental design of PFF-seeding model. (B) Levels of TMEM175 mRNA from rat hippocampal cells treated with control shRNA (shCTL) or TMEM175 targeting shRNA (shTM175) at 14 and 21 d after PFF. (C and G) Immunocytochemistry staining of phosphorylated α-synuclein (p-a-syn) aggregate (green) and βIII-tubulin outlining neuronal cell body and neurites (red) at 14 d (C,14 d) and 21 d (G, 21 d) after PBS/PFF treatment in control (shCTL) and TMEM175 (shTM175) targeting shRNA infected neurons. Blue indicates nuclear staining by Hoechst. (Scale bars, 100 μm.) (D and H) Quantification of intensity, area and number of aggregates was plotted (n = 3). (E and I) Cell viability was assessed by the number of healthy nuclei (Left) and metabolic activity (Right) (n = 3). (F and J) Protein amounts of phosphorylated α-synuclein (Upper) and total α-synuclein (Lower) aggregate in insoluble fraction were quantified by Western blotting, and intensity of monomer and oligomers normalized to tubulin was plotted on the right (n = 3–5). Data presented are mean + SEM. Student t test in B; two-way ANOVA in D and H; Bonferroni's test in E, F, I, and J *P < 0.05, **P < 0.01, and ***P < 0.001. shCTL vs. shTM175.
Fig. S4.
Fig. S4.
TMEM175 deficiency increases phosphorylated α-synuclein aggregates without affecting endogenous level of α-synuclein or PFF uptake. (A) Amounts of phosphorylated α-synuclein (p-a-syn) aggregates in neurites at 14 d after PBS/PFF treatment in control (CTL) and TMEM175-KD (TM175#1, TM175#2, TM175#3) neurons were assessed by immunocytochemistry and intensity of aggregates was plotted (n = 3) (Right). Levels of TMEM175 mRNA from CTL or TM175s are shown (Left). (B) Endogenous levels of rat α-synuclein from cells treated with shCTL or shTM175 at 14 or 21 d after PBS were assessed by immunocytochemistry and shown quantified in graphs. (C) Protein amounts of phosphorylated α-synuclein and total α-synuclein in Triton X-100 soluble fraction were determined by Western blotting (Upper), and quantified intensity of monomers normalized to tubulin was plotted (Lower) (n = 3–5). (D) Amounts of Alexa 555-PFF internalized after 3-h incubation from shCTL or shTM175-treated cells were assessed by live-cell imaging and shown quantified (n = 4). Data presented are mean + SEM. One-way ANOVA in A; Mann–Whitney test in B and C; two-way ANOVA in D; *P < 0.05 and ***P < 0.001. CTL vs. TM175. ns, not significant.

References

    1. Nalls MA, et al. Large-scale meta-analysis of genome-wide association data identifies six new risk loci for Parkinson’s disease. Nat Genet. 2014;56(9):1–7. - PMC - PubMed
    1. Gusev A, et al. Integrative approaches for large-scale transcriptome-wide association studies. Nat Genet. 2016;48(3):245–252. - PMC - PubMed
    1. Zhu Z, et al. Integration of summary data from GWAS and eQTL studies predicts complex trait gene targets. Nat Genet. 2016;48(5):481–487. - PubMed
    1. Clark LN, et al. Mutations in the glucocerebrosidase gene are associated with early-onset Parkinson disease. Neurology. 2007;69(12):1270–1277. - PMC - PubMed
    1. Neumann J, et al. Glucocerebrosidase mutations in clinical and pathologically proven Parkinson’s disease. Brain. 2009;132(Pt 7):1783–1794. - PMC - PubMed

MeSH terms

LinkOut - more resources