. 2017 Feb 28;114(9):2379-2382.
doi: 10.1073/pnas.1616864114. Epub 2017 Feb 13.

Multiple-scale neuroendocrine signals connect brain and pituitary hormone rhythms

Affiliations

Multiple-scale neuroendocrine signals connect brain and pituitary hormone rhythms

Nicola Romanò et al. Proc Natl Acad Sci U S A. .

Abstract

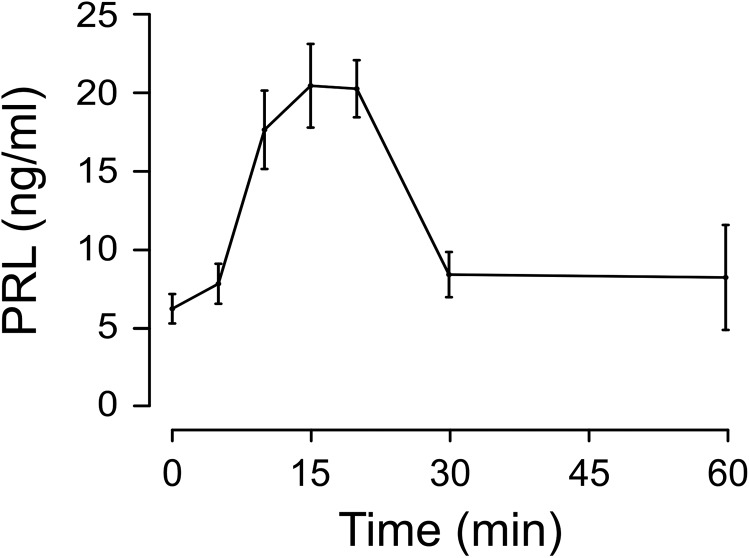
Small assemblies of hypothalamic "parvocellular" neurons release their neuroendocrine signals at the median eminence (ME) to control long-lasting pituitary hormone rhythms essential for homeostasis. How such rapid hypothalamic neurotransmission leads to slowly evolving hormonal signals remains unknown. Here, we show that the temporal organization of dopamine (DA) release events in freely behaving animals relies on a set of characteristic features that are adapted to the dynamic dopaminergic control of pituitary prolactin secretion, a key reproductive hormone. First, locally generated DA release signals are organized over more than four orders of magnitude (0.001 Hz-10 Hz). Second, these DA events are finely tuned within and between frequency domains as building blocks that recur over days to weeks. Third, an integration time window is detected across the ME and consists of high-frequency DA discharges that are coordinated within the minutes range. Thus, a hierarchical combination of time-scaled neuroendocrine signals displays local-global integration to connect brain-pituitary rhythms and pace hormone secretion.

Keywords: dopamine; hypothalamus; neuronal networks; prolactin; rhythms.


Conflict of interest statement

The authors declare no conflict of interest.

Figures

Fig. 1.
Fig. 1.
In vivo monitoring of DA release events at the median eminence (ME) level. (A) Electrodes were implanted at the ME of mice and dopamine (DA) was detected using constant voltage amperometry. Serial blood microsampling was performed from the tail vein. (B) Representative 24-h recording of DA release (Top, shaded area is lights out), with zoom of a 10-min sequence (Bottom). (C) Representative 11-d recording from a female mouse. Each vertical line corresponds to a single secretion event. The stage of the estrus cycle is indicated on the Left for each day (M, metestrus; D, diestrus; P, proestrus, E, estrus). (D) Mean distribution of DA release events during the day (n = 80 d from seven female mice). (E) Histogram of interevent intervals (IEIs): two prominent frequencies are apparent at 1.5 and 12 Hz (n = 80 d, from seven female mice). (F) Relation between DA and PRL. Average normalized PRL levels occurring around a DA event (n = 501 DA events, from six 1-h long sessions) (black, mean; blue, SEM). (G) DA secretory response to an i.p. injection of 1 µg ovine PRL (PRL injected at time 0) (from five animals, seven injections). (H) Distribution of the IEIs of DA events induced by i.p. injection of PRL. (I) Example of simultaneous recording of PRL levels (red) and DA release events (black). In all cases, bar graphs show the mean ± SEM.
Fig. S1.
Fig. S1.
Average frequency of DA release events during the different stages of the estrus cycle (M, metestrus; D, diestrus; P, proestrus, E, estrus) (n = 5 female mice, shaded area is lights out). No statistical difference between the different days of the cycle was detected (P > 0.05, mixed effects model). Individual data points, which are outside of the interquartile range (indicated by bars), are shown as dots.
Fig. S2.
Fig. S2.
Levels of PRL detected after i.p. injection of 1 µg ovine (o)PRL in B6 female mice (n = 6, mean ± SEM).
Fig. S3.
Fig. S3.
(A) Density of secretory events in a mouse recorded during lactation (days 6–16) and weaning (days 1–4) (n = 2). Insets show examples of the raw signal. (BD) Distribution of IEIs during different phases of the recording in A.
Fig. 2.
Fig. 2.
Temporal patterning of DA release events. (A) Distribution of IEIs for each class of event obtained after clustering all events from one recording by shape (n = 13,541). Insets show average event shape in each group; the proportion of each class is shown near each graph. (B–E) Example of temporal patterns of DA release. Each dot represents a single DA release event, colored depending on the subgroup (as in Fig. 2A). Each line shows one repetition of the sequence during the recording; five examples of repetition are shown for each pattern. (FI) Frequency of the four temporal patterns during 8 d of recording.
Fig. S4.
Fig. S4.
Properties of release patterns. (A) Choice of statistically significant patterns. Each recording was analyzed for n-event long (3 ≤ n ≤ 10) patterns, repeated at least five times. The number of occurrences of each pattern are plotted against n, each dot representing one temporal pattern. The same procedure was repeated on 1,000 computer-generated sequences, with the same number of events, same distribution of IEI, and same proportion of different classes. A 95% confidence limit (blue dotted line) was then calculated for the distribution of the maximum number of repeats in the bootstrap samples. Patterns repeated a greater number of times than the bootstrap limit are indicated in green and are considered to be occurring with a higher-than-chance probability. (B) Distribution of temporal patterns during the day (n = 7 mice). (C) Duration of statistically significant temporal patterns in the recording from mouse 4, in relation to the number of events in the pattern. (D) Duration of statistically significant six event-long temporal patterns in seven different mice.
Fig. 3.
Fig. 3.
Spatial patterning of DA release events. (A) Representative double recording of DA secretion at distant sites in the ME (500 µm rostrocaudal), showing desynchronization of release events at the minute timescale. (B) Distribution of events from a double recording. (Top) “Rug plot” of DA release events, where each vertical line represents one event detected by one of the two electrodes. (Bottom) Density plot of the DA events, showing coincidence over a long timescale. (C) Cross-distribution of IEI between the two electrodes, showing reciprocal delays during a ∼7-min time lag. (D) Autocorrelation of the signals on each of the single electrodes shows only the expected peak at lag 0, suggesting that the coordination is not dependent on pituitary feedback. (E and F) Distribution of IEIs from the signals detected by the two electrodes during a period in which DA release was only detected by one electrode (E) (light purple) or during a period of coordination between both electrodes (F) (light purple and green; dark purple shows overlap of IEIs between both electrodes).
Fig. 4.
Fig. 4.
Schematic of the brain–pituitary dialogue proposed to underlie hypothalamic dopaminergic control of pituitary prolactin secretion. Illustrated are three subsets of hypothalamic TIDA neurons (colored in green, brown, and magenta), which each locally release DA at the median eminence level (where the first loop of portal capillaries reside). Local DA release events are organized in the frequency domain (0.001 Hz–10 Hz) and recur as sequences. Local–global integration across the median eminence coordinates high frequency DA release events within the minutes range. This allows the build-up of DA in the portal blood required to efficiently inhibit pituitary prolactin secretion.

Similar articles

Cited by

References

    1. Buzsáki G, Logothetis N, Singer W. Scaling brain size, keeping timing: Evolutionary preservation of brain rhythms. Neuron. 2013;80(3):751–764. - PMC - PubMed
    1. Grattan DR. 60 years of neuroendocrinology: The hypothalamo-prolactin axis. J Endocrinol. 2015;226(2):T101–T122. - PMC - PubMed
    1. Herbison AE. Control of puberty onset and fertility by gonadotropin-releasing hormone neurons. Nat Rev Endocrinol. 2016;12(8):452–466. - PubMed
    1. Le Tissier P, et al. An updated view of hypothalamic-vascular-pituitary unit function and plasticity. Nat Rev Endocrinol. December 9, 2016 doi: 10.1038/nrendo.2016.193. - DOI - PubMed
    1. Le Tissier PR, et al. Anterior pituitary cell networks. Front Neuroendocrinol. 2012;33(3):252–266. - PubMed

Publication types