Clinical Trial
. 2017 Feb 28;114(9):2425-2430.
doi: 10.1073/pnas.1621489114. Epub 2017 Feb 13.

Systems analysis of protective immune responses to RTS,S malaria vaccination in humans

Affiliations
Clinical Trial

Systems analysis of protective immune responses to RTS,S malaria vaccination in humans

Dmitri Kazmin et al. Proc Natl Acad Sci U S A. .

Abstract

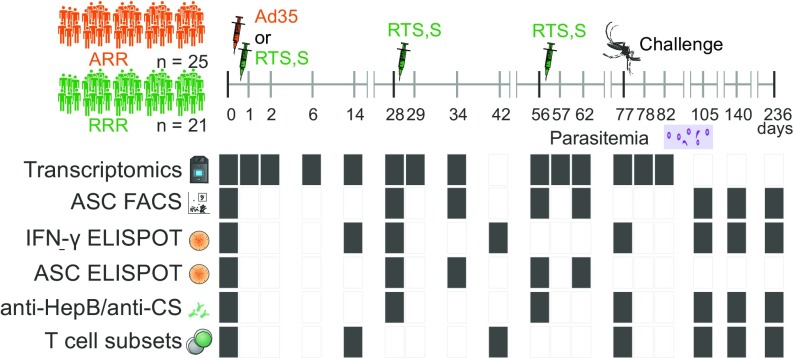
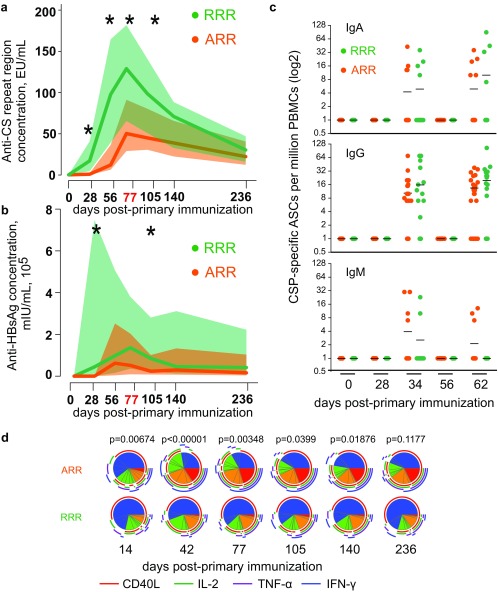
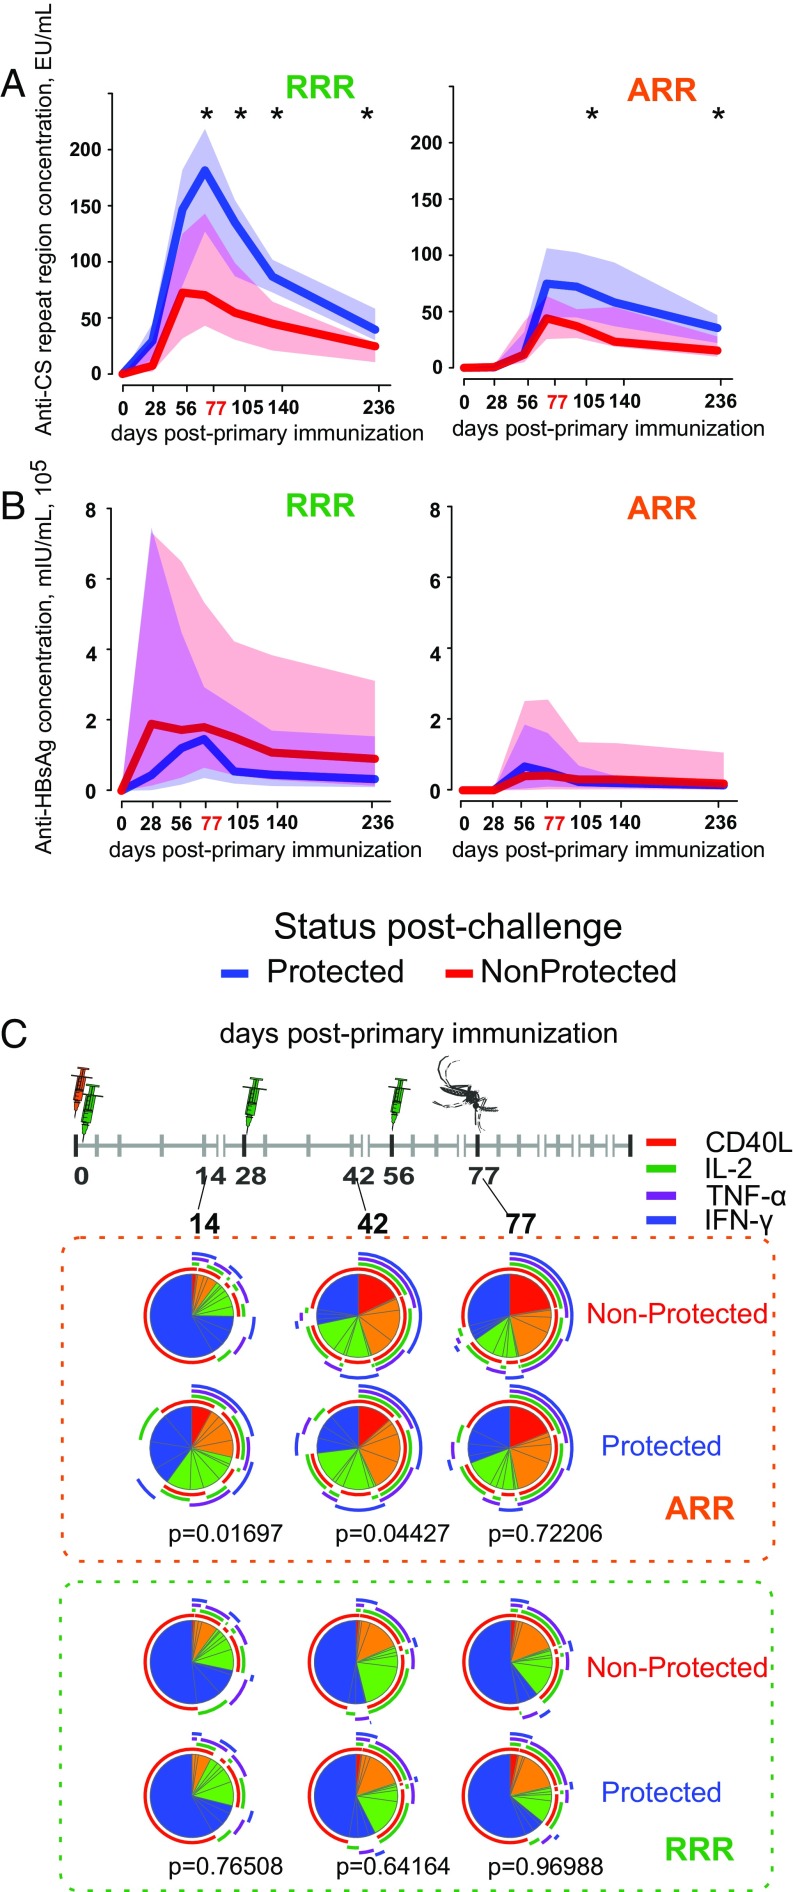
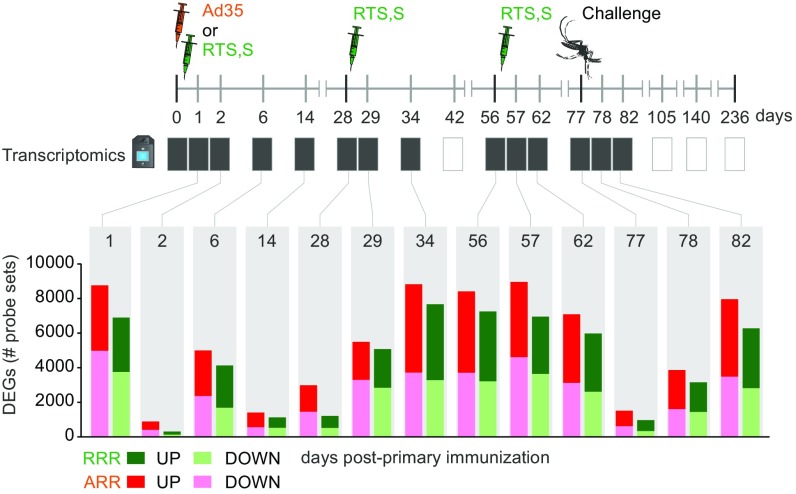
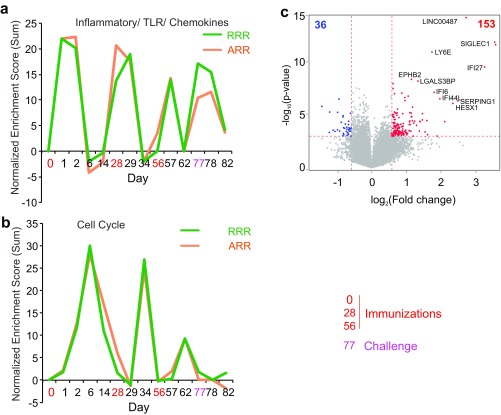
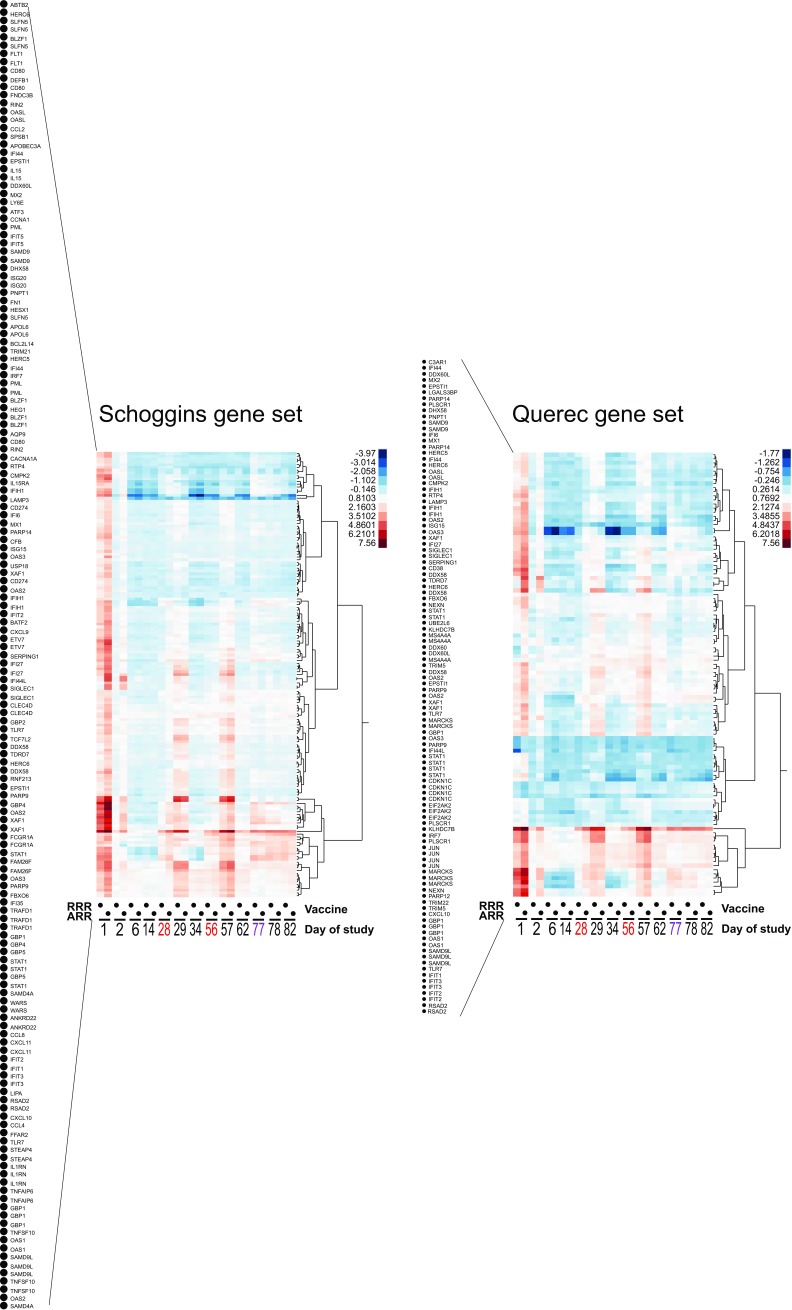
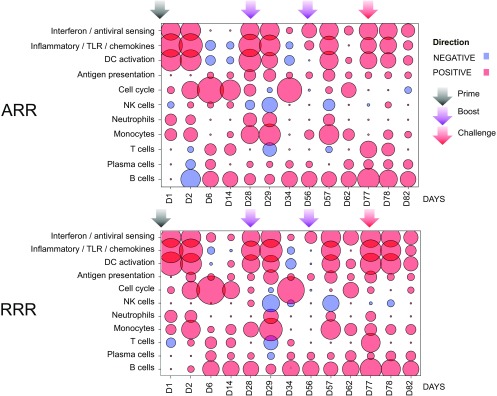
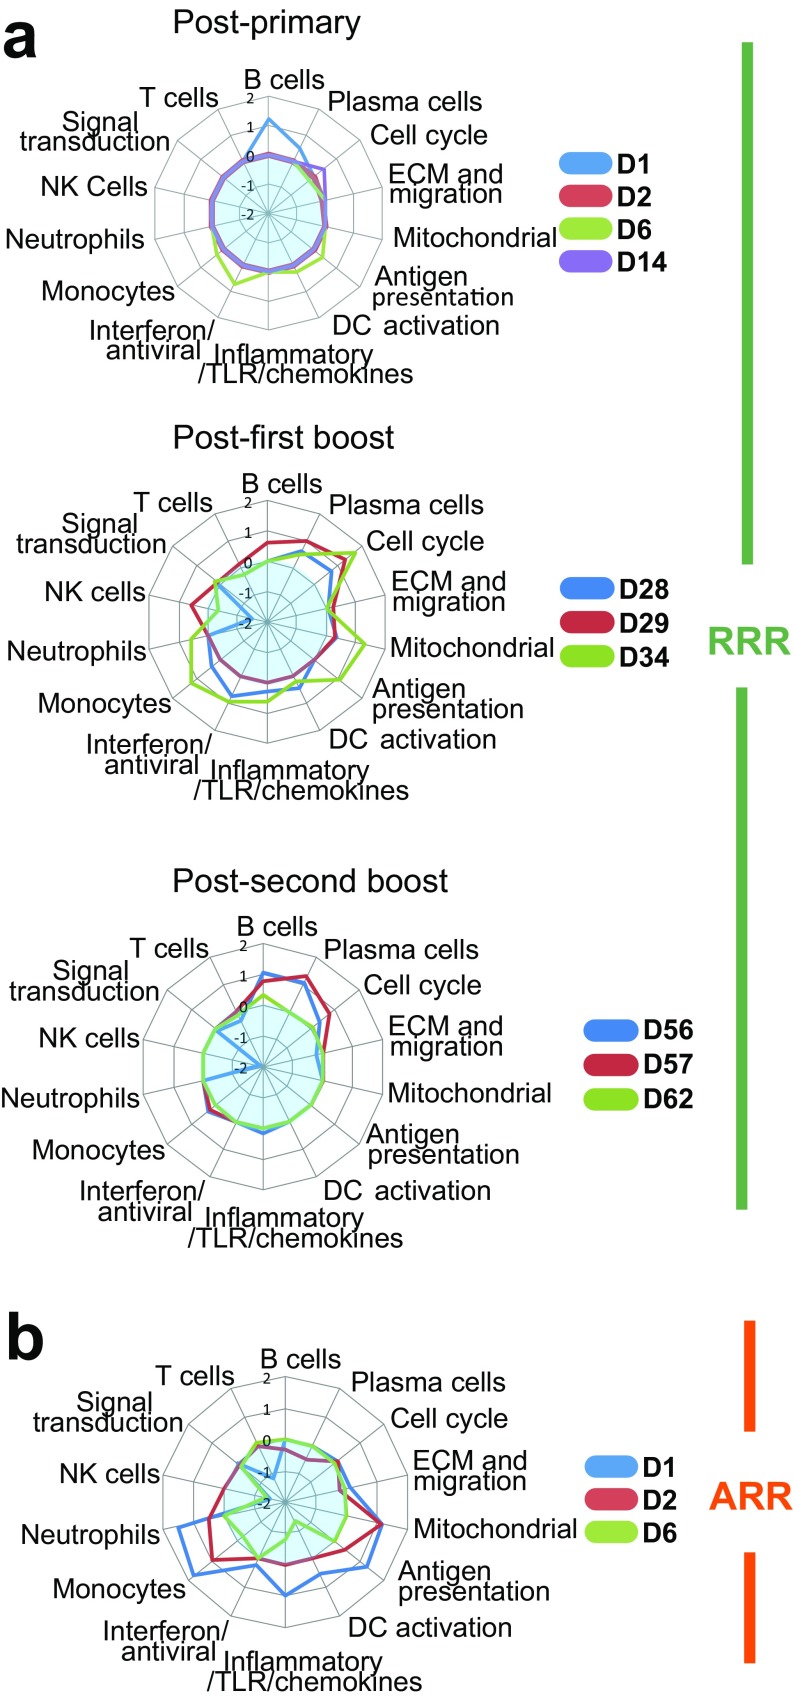
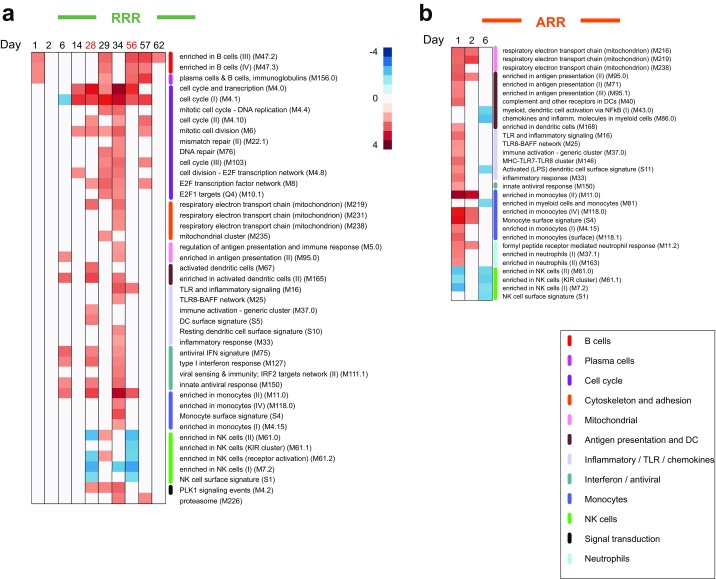
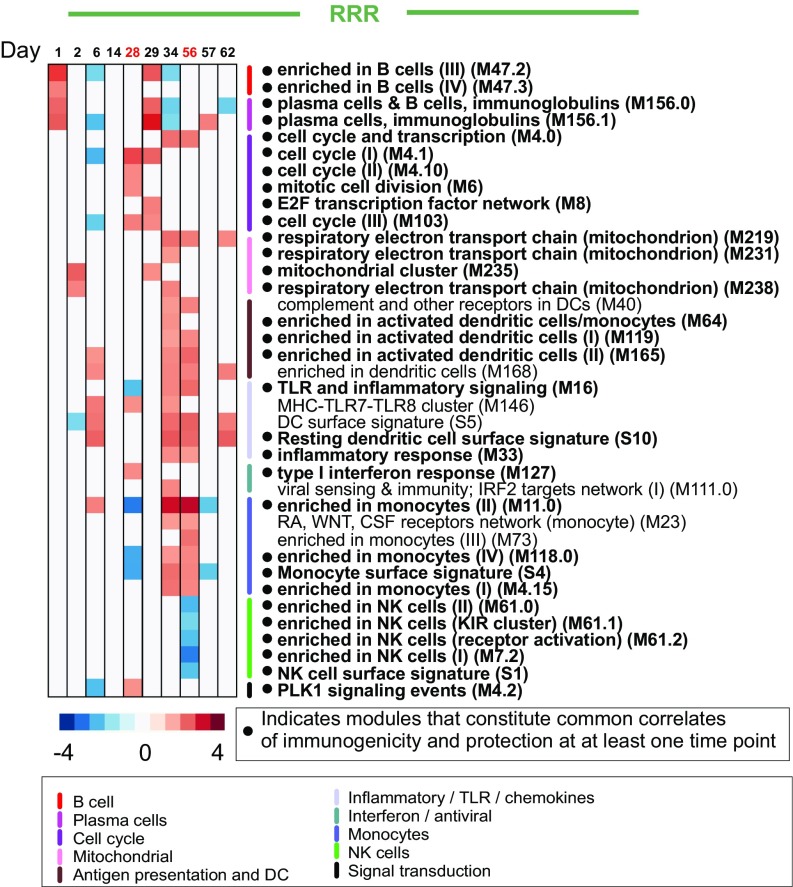
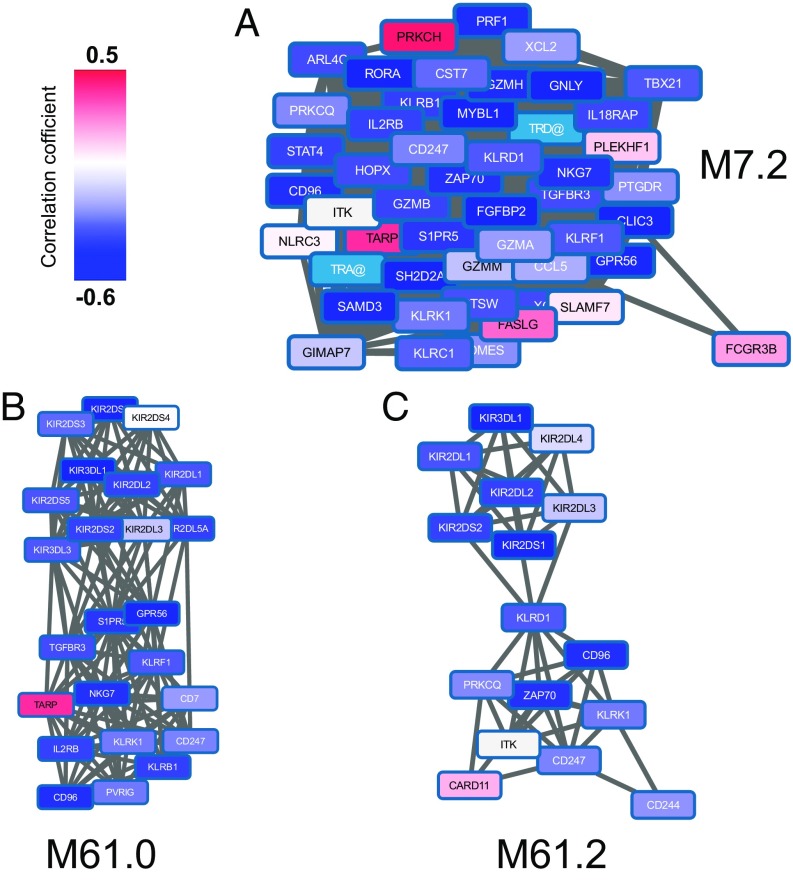
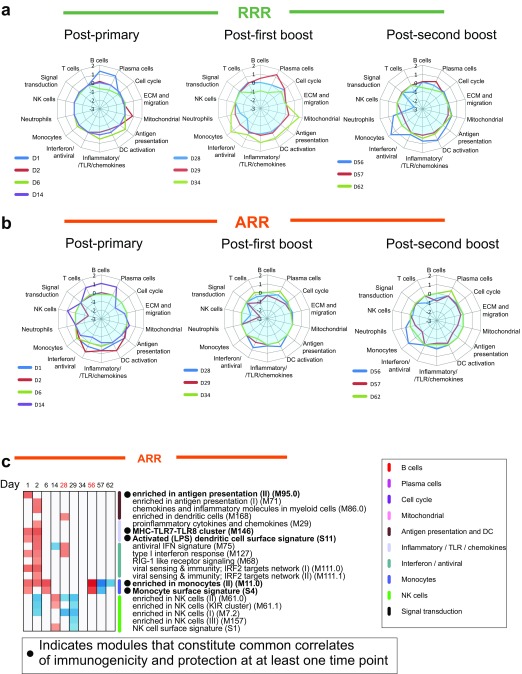
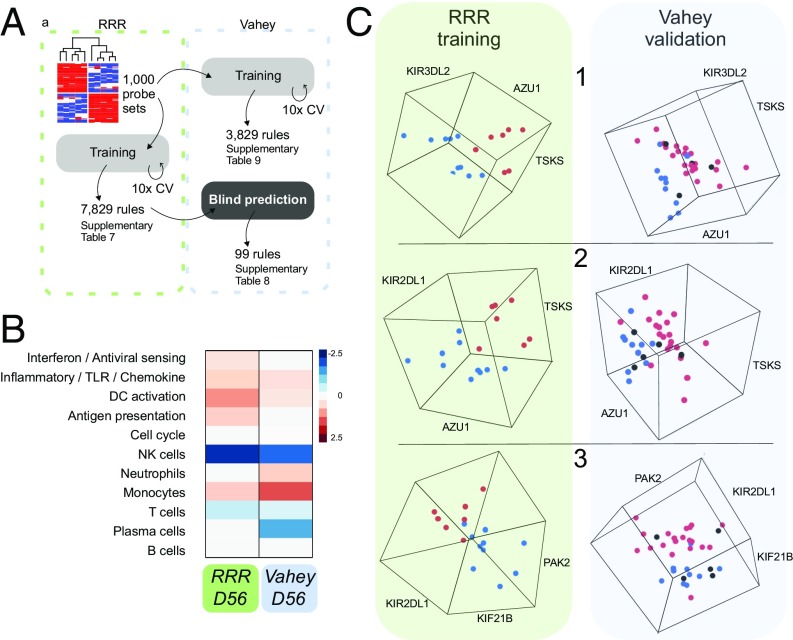
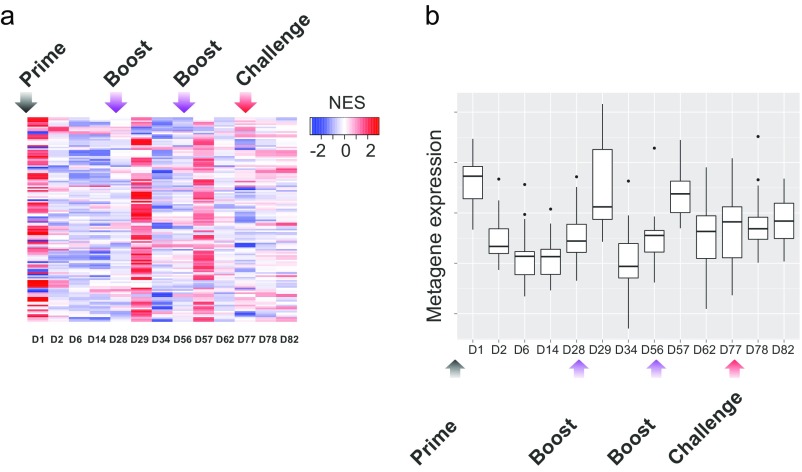
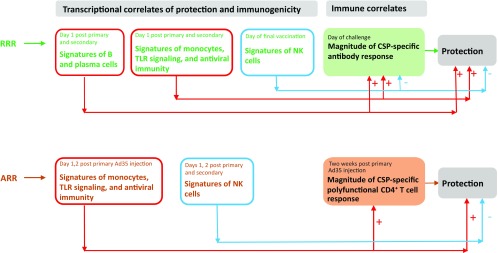
RTS,S is an advanced malaria vaccine candidate and confers significant protection against Plasmodium falciparum infection in humans. Little is known about the molecular mechanisms driving vaccine immunity. Here, we applied a systems biology approach to study immune responses in subjects receiving three consecutive immunizations with RTS,S (RRR), or in those receiving two immunizations of RTS,S/AS01 following a primary immunization with adenovirus 35 (Ad35) (ARR) vector expressing circumsporozoite protein. Subsequent controlled human malaria challenge (CHMI) of the vaccinees with Plasmodium-infected mosquitoes, 3 wk after the final immunization, resulted in ∼50% protection in both groups of vaccinees. Circumsporozoite protein (CSP)-specific antibody titers, prechallenge, were associated with protection in the RRR group. In contrast, ARR-induced lower antibody responses, and protection was associated with polyfunctional CD4+ T-cell responses 2 wk after priming with Ad35. Molecular signatures of B and plasma cells detected in PBMCs were highly correlated with antibody titers prechallenge and protection in the RRR cohort. In contrast, early signatures of innate immunity and dendritic cell activation were highly associated with protection in the ARR cohort. For both vaccine regimens, natural killer (NK) cell signatures negatively correlated with and predicted protection. These results suggest that protective immunity against P. falciparum can be achieved via multiple mechanisms and highlight the utility of systems approaches in defining molecular correlates of protection to vaccination.

Keywords: immune; malaria; systems biology; systems vaccinology; vaccine.


Conflict of interest statement

Conflict of interest statement: R.v.d.M., R.A.v.d.B., W.R.B., and E.J. are employees of the GSK group of companies. They report ownership of GSK shares and/or restricted GSK shares.

Figures

Fig. 1.
Fig. 1.
Study design. Filled rectangles indicate the time points of data collection. ARR regimen was immunization with Ad35 followed by two immunizations with RTS,S. RRR regimen was three consecutive immunizations with RTS,S.
Fig. S1.
Fig. S1.
Immune responses to vaccination. (A and B) Baseline-normalized anti-CS repeat region antibody concentration (A) and anti-HBsAg antibody concentration (B) in RRR and ARR groups after vaccination. Lines indicate median across all subjects; shaded areas indicate 25–75% interquartile range. Asterisks indicate significance at a = 0.05 level by Wilcoxon signed rank test. (C) Frequency of CSP-specific antibody secreting cells by ELISPOT. Each dot represents a subject. (D) SPICE plots illustrating the functionality of CSP-specific CD4+ T cells by vaccination at each time point. Sectors indicate the number of markers expressed: blue, one marker; green, two markers; orange, three markers; red, four markers. Arches indicate which markers are expressed. Significance test was performed to illustrate whether the pattern of distribution of T-cell populations for the two vaccines came from the same distribution or different ones. Sum of χ2 values was used as a test metric. P values were generated by partial permutation test. For more details, see ref. .
Fig. 2.
Fig. 2.
Serological and cellular associations with protection. (A) Serum anti-CS IgG antibody titers. Lines indicate median values, shaded areas indicate 25–75% interquartile range. *α = 0.05 level by Wilcoxon signed rank test. (B) Serum anti-HBsAg antibody titers in protected and nonprotected subjects. (C) SPICE plots indicate the functionality of CSP-specific CD4 T cells. Inner sectors on SPICE plots indicate the number of markers expressed: Blue, green, orange, and red indicate 1, 2, 3, and 4 markers, respectively. Outside arches indicate the identity of expressed markers, per legend in the figure. Sum of χ2 values was used as a test metric. P values were generated by partial permutation test (37) and indicate the statistical significance of the differences in frequencies of T-cell subsets in P vs. NP.
Fig. 3.
Fig. 3.
Transcriptional responses to vaccination. The number of probe sets displaying significantly different signals compared with D0. Significance was determined as Benjamini–Hotchberg FDR q value <0.01 and |Fold-change| >1.5-fold.
Fig. S2.
Fig. S2.
Transcriptional responses to vaccination. (A and B) Functional responses to vaccination in the two cohorts. GSEA using BTMs as gene sets was performed on lists of genes ranked by fold-change relative to prevaccination baseline. Plotted are the sums of normalized enrichment scores across high-level annotation groups of BTMs displaying statistically significant (FDR q < 0.05) enrichment. Additional details are provided in Dataset S1. (C) Differentially expressed probe sets between Ad35-prime and RTS,S/AS01-prime vaccines at D1 after prime immunization. Criteria used are raw P value of <0.01, and |Fold-change| > 1.5-fold.
Fig. S3.
Fig. S3.
Magnitude and kinetics of induction of antiviral and type I IFN-related genes by the ARR and RRR vaccines. The list of antiviral and type I IFN-related genes, indicated as “Schoggins gene set” in the heat map on the left, was obtained from Schoggins et al. (27); the list of genes indicated as “Querec gene set” in the heat map on the right represent genes induced by YF-17D vaccination (24). For the Schoggins gene set, only probe sets that display more than fourfold induction at D1 after primary vaccination with either Ad35.CS or RTS,S/AS01 are included.
Fig. S4.
Fig. S4.
Functional enrichment among genes regulated in response to vaccination. BTMs are grouped into high-level annotation groups based on common pathways or cell lineages they represent. Size of circles indicates the sum of normalized enrichment scores for BTMs included in high-level annotation groups. Only BTMs with statistically significant enrichment (FDR q value <0.05) are included in the sums. Full details are available in Dataset S1.
Fig. S5.
Fig. S5.
Molecular associations of immunogenicity. Illustration of GSEA with genes being ranked by correlation to the immunogenicity endpoints. Spider plots indicate the average normalized enrichment scores across all modules included in each of the represented high-level annotation groups. The distance from the center of the plot corresponds to the average NES across all BTMs included in the corresponding high-level annotation group. Only modules with FDR q values <0.05 are included in the count, for the rest of the NES is set to zero. Translucent blue zones indicate negative enrichment. (A) Correlates of anti-CSP repeat region IgG concentrations at the day of challenge, shown for each of the prechallenge time points for the RRR arm. (B) Correlates of the frequencies of CS-specific CD4+ T cells expressing three or more markers at D14 postprime immunization in the ARR arm. Time points before D14 are shown. Full details are provided in Dataset S2.
Fig. S6.
Fig. S6.
Transcriptional correlates of immunogenicity. Each square represents a BTM. Normalized enrichment scores for representative modules are illustrated by color. Assignment of a BTM to a high-level annotation group is illustrated by a colored sidebar. (A) RRR. (B) ARR. Full details are available in Dataset S2.
Fig. 4.
Fig. 4.
Transcriptional correlates of protection to RRR vaccination. Each square represents a BTM. Color represents normalized enrichment scores for BTMs. Assignment of a BTM to a high-level annotation group is illustrated by a colored sidebar (Dataset S3). Modules that represent common associations of both immunogenicity and protection are highlighted (Dataset S4).
Fig. 5.
Fig. 5.
Expression of genes in NK cell-related modules inversely correlates with protection induced by RRR. Cytoscape plots illustrating correlations of individual genes contained within three representative “NK cell” BTMs. Color corresponds to the values of Spearman rho. Vertices indicate interaction of genes within the same subnetwork.
Fig. S7.
Fig. S7.
Molecular associations of protection. (A and B) Illustration of GSEA with mRNA expression being ranked by correlation to the day of positive smear. For protected individuals, day of smear is set to 28 (the end of the observation period). Spider plots indicate the average normalized enrichment scores across all modules included in each of the represented high-level annotation groups. The distance from the center of the plot corresponds to the average NES across all BTMs included in the corresponding high-level annotation group. Only modules with FDR q values less than 0.05 are included in the count. Translucent blue zones indicate negative enrichment. (A) Correlates of protection for the RRR vaccine. (B) Correlates of protection for the ARR vaccine. Common associations of immunogenicity and protection are indicated by color on heatmaps. Full details are provided in Datasets S3 and S4. (C) Enrichment of representative BTMs that correlate with protection. Each square represents a BTM. Normalized enrichment scores for representative modules are illustrated by color. Assignment of a BTM to a high-level annotation group is illustrated by a colored sidebar.
Fig. 6.
Fig. 6.
Evaluation of candidate predictive signatures in an independent study (32). (A) Outline of the training and validation of signatures in DAMIP experiments. (B) GSEA with BTMs gene sets on lists of genes ranked by correlation to protection (encoded as a 0–1 binary variable). Color indicates average normalized enrichment scores across all modules included it the high-level annotation groups (Dataset S6). (C) Segregation of subjects in the space defined by baseline-normalized gene expression values for genes included in three representative predictive signatures. Each circle represents a subject. Color indicates protection: red, nonprotected; blue, protected; black, subjects consistently misclassified in >50% of the 99 successful rules.
Fig. S8.
Fig. S8.
Integration of the current dataset with the previously reported transcriptional response in a RTS,S/AS01 CHMI study. (A and B) Expression of inflammation related genes from ref. . (A) Expression of 63 inflammation related genes identified as being up-regulated 24 h after the third immunization in ref. in the RRR cohort of the current study. (B) A metagene was formed, representing average expression of these 63 genes, and the expression of this metagene was monitored in individual subjects across time points. Boxplots indicate mean, 25–75% interquartile range and 95% range. Each dot represents a subject.
Fig. S9.
Fig. S9.
A proposed model diagram of mechanisms of protection in the RRR and ARR vaccines.

References

    1. World Health Organization 2015. World Malaria Report (World Health Organization, Geneva)
    1. Strategic Advisory Group of Experts Meeting of the Strategic Advisory Group of Experts on immunization, October 2015 - conclusions and recommendations. Wkly Epidemiol Rec. 2011;90(50):681–699. - PubMed
    1. Cohen J, Nussenzweig V, Nussenzweig R, Vekemans J, Leach A. From the circumsporozoite protein to the RTS, S/AS candidate vaccine. Hum Vaccin. 2010;6(1):90–96. - PubMed
    1. Casares S, Brumeanu TD, Richie TL. The RTS,S malaria vaccine. Vaccine. 2010;28(31):4880–4894. - PubMed
    1. Didierlaurent AM, et al. Enhancement of adaptive immunity by the human vaccine adjuvant AS01 depends on activated dendritic cells. J Immunol. 2014;193(4):1920–1930. - PubMed

Publication types

MeSH terms